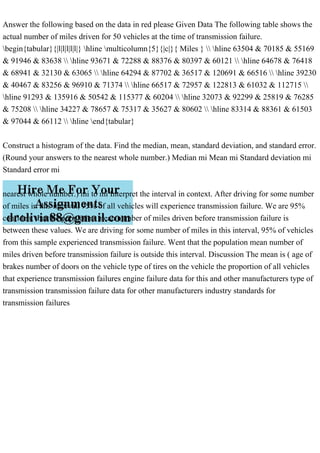
Answer the following based on the data in red please Given Data The following table shows the
actual number of miles driven for 50 vehicles at the time of transmission failure.
\begin{tabular}{|l|l|l|l|l|} \hline \multicolumn{5}{|c|}{ Miles } \\ \hline 63504 & 70185 & 55169
& 91946 & 83638 \\ \hline 93671 & 72288 & 88376 & 80397 & 60121 \\ \hline 64678 & 76418
& 68941 & 32130 & 63065 \\ \hline 64294 & 87702 & 36517 & 120691 & 66516 \\ \hline 39230
& 40467 & 83256 & 96910 & 71374 \\ \hline 66517 & 72957 & 122813 & 61032 & 112715 \\
\hline 91293 & 135916 & 50542 & 115377 & 60204 \\ \hline 32073 & 92299 & 25819 & 76285
& 75208 \\ \hline 34227 & 78657 & 75317 & 35627 & 80602 \\ \hline 83314 & 88361 & 61503
& 97044 & 66112 \\ \hline \end{tabular}
Construct a histogram of the data. Find the median, mean, standard deviation, and standard error.
(Round your answers to the nearest whole number.) Median mi Mean mi Standard deviation mi
Standard error mi
nearest whole number.) mi to mi Interpret the interval in context. After driving for some number
of miles in this interval, 95% of all vehicles will experience transmission failure. We are 95%
confident that the population mean number of miles driven before transmission failure is
between these values. We are driving for some number of miles in this interval, 95% of vehicles
from this sample experienced transmission failure. Went that the population mean number of
miles driven before transmission failure is outside this interval. Discussion The mean is ( age of
brakes number of doors on the vehicle type of tires on the vehicle the proportion of all vehicles
that experience transmission failures engine failure data for this and other manufacturers type of
transmission transmission failure data for other manufacturers industry standards for
transmission failures.
Micro-Scholarship, What it is, How can it help me.pdf
Answer the following based on the data in red please Given Data The .pdf
1. Answer the following based on the data in red please Given Data The following table shows the
actual number of miles driven for 50 vehicles at the time of transmission failure.
begin{tabular}{|l|l|l|l|l|} hline multicolumn{5}{|c|}{ Miles } hline 63504 & 70185 & 55169
& 91946 & 83638 hline 93671 & 72288 & 88376 & 80397 & 60121 hline 64678 & 76418
& 68941 & 32130 & 63065 hline 64294 & 87702 & 36517 & 120691 & 66516 hline 39230
& 40467 & 83256 & 96910 & 71374 hline 66517 & 72957 & 122813 & 61032 & 112715
hline 91293 & 135916 & 50542 & 115377 & 60204 hline 32073 & 92299 & 25819 & 76285
& 75208 hline 34227 & 78657 & 75317 & 35627 & 80602 hline 83314 & 88361 & 61503
& 97044 & 66112 hline end{tabular}
Construct a histogram of the data. Find the median, mean, standard deviation, and standard error.
(Round your answers to the nearest whole number.) Median mi Mean mi Standard deviation mi
Standard error mi
nearest whole number.) mi to mi Interpret the interval in context. After driving for some number
of miles in this interval, 95% of all vehicles will experience transmission failure. We are 95%
confident that the population mean number of miles driven before transmission failure is
between these values. We are driving for some number of miles in this interval, 95% of vehicles
from this sample experienced transmission failure. Went that the population mean number of
miles driven before transmission failure is outside this interval. Discussion The mean is ( age of
brakes number of doors on the vehicle type of tires on the vehicle the proportion of all vehicles
that experience transmission failures engine failure data for this and other manufacturers type of
transmission transmission failure data for other manufacturers industry standards for
transmission failures