SlideShare a Scribd company logo
1 of 4
Download to read offline
Plymouth, MI | Homes | Average Sold Price


                                      $258,414
                                                                                                                                     $260,000
                                                                                  $252,052


                           $229,896
                                                 $226,508                                                                          $232,500


$210,653                                                    $215,671
           $203,913 $204,093
                                                                       $207,296
                                                                                                                                 $205,000

                                                                                             $195,559

                                                                                                                    $188,800
                                                                                                        $181,893
                                                                                                                                $177,500


   Mar-10 Apr-10
                 May-10 Jun-10
                               Jul-10 Aug-10                                                                                   $150,000
                                             Sep-10 Oct-10
                                                           Nov-10
                                                                                        Dec-10          Jan-11
                                                               Sold Price                                          Feb-11
Plymouth MI | Homes | Sales Price as % of List Price


                                                                                                                  95.00%

93.42%             94.09%

                                                                  93.67%
          92.05%             92.60%
                                               92.62%                               93.21%
                                      91.81%             92.08%
                                                                                                               90.00%
                                                                           91.41%
                                                                                                      91.54%


                                                                                             88.88%
                                                                                                           85.00%


                                                                                                         80.00%


         Mar-10 Apr-10
                       May-10 Jun-10                                                                   75.00%
                                     Jul-10 Aug-10
                                                   Sep-10 Oct-10
                                                                 Nov-10 Dec-10
                                                                               Jan-11 Feb-11
                                                        SP/LP
Plymouth MI | Homes | Average Days on Market


                                                                                                 130
                                                                                                              130

                                                                   114      115
                                                                                      109
                                                100
90                                                                                                          98
                      83
       78
              73               76

                                        68
                                                          67
                                                                                                         65


                                                                                                       33


Mar-10 Apr-10
              May-10 Jun-10                                                                          0
                              Jul-10   Aug-10 Sep-10
                                                       Oct-10   Nov-10   Dec-10   Jan-11    Feb-11

                                         Days on Market
Plymouth MI | Homes | Avg Sales Price per Square Foot


$120

                                                                     $113
                                          $113

                                                    $109                             $107
                                   $109                                      $107
              $108
 $106                                                        $104                           $102
                      $104                                                                                 $100


       $93                                                                                         $88


        $79


                                                                                                       Feb-11
         $65                                                                             Dec-10 Jan-11
                                                                           Oct-10 Nov-10
                                                    Jul-10   Aug-10 Sep-10
                          Apr-10    May-10 Jun-10
                 Mar-10
                                                             SP per SqFt

More Related Content

What's hot

Windridge Condominiums
Windridge CondominiumsWindridge Condominiums
Windridge CondominiumsMichael Fisher
 
Windsor Park, Delwood, Mueller
Windsor Park, Delwood, MuellerWindsor Park, Delwood, Mueller
Windsor Park, Delwood, MuellerTaylor Real Estate
 
Area 3 windsor park, delwood, mueller
Area 3   windsor park, delwood, muellerArea 3   windsor park, delwood, mueller
Area 3 windsor park, delwood, muellerTaylor Real Estate
 
Area 4 hyde park, shoal creek, rosedale
Area 4   hyde park, shoal creek, rosedaleArea 4   hyde park, shoal creek, rosedale
Area 4 hyde park, shoal creek, rosedaleTaylor Real Estate
 

What's hot (18)

October 2012 Plymouth MI Homes Stats
October 2012 Plymouth MI Homes StatsOctober 2012 Plymouth MI Homes Stats
October 2012 Plymouth MI Homes Stats
 
Plymouth Housing Stats | December 2012
Plymouth Housing Stats | December 2012Plymouth Housing Stats | December 2012
Plymouth Housing Stats | December 2012
 
Windridge Condominiums
Windridge CondominiumsWindridge Condominiums
Windridge Condominiums
 
Condos Only
Condos OnlyCondos Only
Condos Only
 
Areas 10N, 10S South Austin
Areas 10N, 10S   South AustinAreas 10N, 10S   South Austin
Areas 10N, 10S South Austin
 
UT
UTUT
UT
 
June 2010 Philadelphia County Sold Median Price
June 2010 Philadelphia County Sold Median PriceJune 2010 Philadelphia County Sold Median Price
June 2010 Philadelphia County Sold Median Price
 
Area 5 east austin
Area 5   east austinArea 5   east austin
Area 5 east austin
 
Windsor Park, Delwood, Mueller
Windsor Park, Delwood, MuellerWindsor Park, Delwood, Mueller
Windsor Park, Delwood, Mueller
 
Area 3 windsor park, delwood, mueller
Area 3   windsor park, delwood, muellerArea 3   windsor park, delwood, mueller
Area 3 windsor park, delwood, mueller
 
July 2010 Philadelphia County Basic Supply and Demand
July 2010 Philadelphia County Basic Supply and DemandJuly 2010 Philadelphia County Basic Supply and Demand
July 2010 Philadelphia County Basic Supply and Demand
 
Delaware county sold median price
Delaware county sold median priceDelaware county sold median price
Delaware county sold median price
 
DT Downtown
DT   DowntownDT   Downtown
DT Downtown
 
June 2010 Delaware County Sold Median Price
June 2010 Delaware County Sold Median PriceJune 2010 Delaware County Sold Median Price
June 2010 Delaware County Sold Median Price
 
Area 4 hyde park, shoal creek, rosedale
Area 4   hyde park, shoal creek, rosedaleArea 4   hyde park, shoal creek, rosedale
Area 4 hyde park, shoal creek, rosedale
 
July 2010 Philadelphia County Basic Supply and Demand
July 2010 Philadelphia County Basic Supply and DemandJuly 2010 Philadelphia County Basic Supply and Demand
July 2010 Philadelphia County Basic Supply and Demand
 
Philadelphia County Sold Median Price
Philadelphia County Sold Median PricePhiladelphia County Sold Median Price
Philadelphia County Sold Median Price
 
Montgomery county basic supply and demand
Montgomery county basic supply and demandMontgomery county basic supply and demand
Montgomery county basic supply and demand
 

Similar to Plymouth Michigan Real Estate Stats | February 2011

Plenary session 1 the tricks and trials of investing in nut production - da...
Plenary session 1   the tricks and trials of investing in nut production - da...Plenary session 1   the tricks and trials of investing in nut production - da...
Plenary session 1 the tricks and trials of investing in nut production - da...MacadamiaSociety
 
39348363 google-earnings-slides-q3-2010
39348363 google-earnings-slides-q3-201039348363 google-earnings-slides-q3-2010
39348363 google-earnings-slides-q3-2010Pranav Bhatnagar
 
2010 q3 google_earnings_slides
2010 q3 google_earnings_slides2010 q3 google_earnings_slides
2010 q3 google_earnings_slidesrabier
 
Edgar's power point
Edgar's power pointEdgar's power point
Edgar's power pointEdgar_Rios
 
Austin Market Update January 2008
Austin Market Update January 2008Austin Market Update January 2008
Austin Market Update January 2008Dee Patience
 
March 2013 Sold Data for The Woodlands
March 2013 Sold Data for The WoodlandsMarch 2013 Sold Data for The Woodlands
March 2013 Sold Data for The WoodlandsReferred Realty Group
 
July regional seminar
July regional seminarJuly regional seminar
July regional seminarshelljud
 
Finalista Demo Day Startup Farm SP - 2a edição
Finalista Demo Day Startup Farm SP - 2a ediçãoFinalista Demo Day Startup Farm SP - 2a edição
Finalista Demo Day Startup Farm SP - 2a ediçãoStartup Farm
 
Finance Stocks And Bonds (Portfolio)
Finance Stocks And Bonds (Portfolio)Finance Stocks And Bonds (Portfolio)
Finance Stocks And Bonds (Portfolio)lyleslj
 

Similar to Plymouth Michigan Real Estate Stats | February 2011 (20)

Plenary session 1 the tricks and trials of investing in nut production - da...
Plenary session 1   the tricks and trials of investing in nut production - da...Plenary session 1   the tricks and trials of investing in nut production - da...
Plenary session 1 the tricks and trials of investing in nut production - da...
 
2010 HAR REALTOR® Expo- Ted Jones, PhD
2010 HAR REALTOR® Expo- Ted Jones, PhD2010 HAR REALTOR® Expo- Ted Jones, PhD
2010 HAR REALTOR® Expo- Ted Jones, PhD
 
8 9 Cyn Lk
8 9 Cyn Lk8 9 Cyn Lk
8 9 Cyn Lk
 
39348363 google-earnings-slides-q3-2010
39348363 google-earnings-slides-q3-201039348363 google-earnings-slides-q3-2010
39348363 google-earnings-slides-q3-2010
 
2010 q3 google_earnings_slides
2010 q3 google_earnings_slides2010 q3 google_earnings_slides
2010 q3 google_earnings_slides
 
Edgar's power point
Edgar's power pointEdgar's power point
Edgar's power point
 
Austin Market Update January 2008
Austin Market Update January 2008Austin Market Update January 2008
Austin Market Update January 2008
 
March 2013 Sold Data for The Woodlands
March 2013 Sold Data for The WoodlandsMarch 2013 Sold Data for The Woodlands
March 2013 Sold Data for The Woodlands
 
July regional seminar
July regional seminarJuly regional seminar
July regional seminar
 
My survey
My surveyMy survey
My survey
 
My survey
My surveyMy survey
My survey
 
Finalista Demo Day Startup Farm SP - 2a edição
Finalista Demo Day Startup Farm SP - 2a ediçãoFinalista Demo Day Startup Farm SP - 2a edição
Finalista Demo Day Startup Farm SP - 2a edição
 
Finance Stocks And Bonds (Portfolio)
Finance Stocks And Bonds (Portfolio)Finance Stocks And Bonds (Portfolio)
Finance Stocks And Bonds (Portfolio)
 
8 9 Menifee
8 9 Menifee8 9 Menifee
8 9 Menifee
 
Southwest California 2009 Housing Recap
Southwest California 2009 Housing RecapSouthwest California 2009 Housing Recap
Southwest California 2009 Housing Recap
 
2009 Southwest California Housing Summary
2009 Southwest California Housing Summary2009 Southwest California Housing Summary
2009 Southwest California Housing Summary
 
Book1
Book1Book1
Book1
 
TOL_2005_AR
TOL_2005_ARTOL_2005_AR
TOL_2005_AR
 
TOL_2005_AR
TOL_2005_ARTOL_2005_AR
TOL_2005_AR
 
TOL_2005_AR
TOL_2005_ARTOL_2005_AR
TOL_2005_AR
 

More from Berkshire Hathaway HomeServices, Snyder & Company, Realtors

More from Berkshire Hathaway HomeServices, Snyder & Company, Realtors (12)

Finding The Right Agent | todd waller
Finding The Right Agent | todd wallerFinding The Right Agent | todd waller
Finding The Right Agent | todd waller
 
9625 Blackburn, Livonia, MI | Old Rosedale Gardens Brick Tudor
9625 Blackburn, Livonia, MI | Old Rosedale Gardens Brick Tudor9625 Blackburn, Livonia, MI | Old Rosedale Gardens Brick Tudor
9625 Blackburn, Livonia, MI | Old Rosedale Gardens Brick Tudor
 
Fallen & Wounded Soldiers Fund 2013 9-11 Day of Remembrance Golf Outing
Fallen & Wounded Soldiers Fund 2013 9-11 Day of Remembrance Golf OutingFallen & Wounded Soldiers Fund 2013 9-11 Day of Remembrance Golf Outing
Fallen & Wounded Soldiers Fund 2013 9-11 Day of Remembrance Golf Outing
 
54125 Birchwood, South Lyon, MI
54125 Birchwood, South Lyon, MI54125 Birchwood, South Lyon, MI
54125 Birchwood, South Lyon, MI
 
25500 Meadow Ct, South Lyon, MI | Elegance without the Wait
25500 Meadow Ct, South Lyon, MI | Elegance without the Wait25500 Meadow Ct, South Lyon, MI | Elegance without the Wait
25500 Meadow Ct, South Lyon, MI | Elegance without the Wait
 
14572 Fairway Livonia, MI | Idyl Wyld Ranch
14572 Fairway Livonia, MI | Idyl Wyld Ranch14572 Fairway Livonia, MI | Idyl Wyld Ranch
14572 Fairway Livonia, MI | Idyl Wyld Ranch
 
428 W Sibley, Howell, MI | Victorian Elegance
428 W Sibley, Howell, MI | Victorian Elegance428 W Sibley, Howell, MI | Victorian Elegance
428 W Sibley, Howell, MI | Victorian Elegance
 
48510 E Normandy Ct, Plymouth, MI
48510 E Normandy Ct, Plymouth, MI48510 E Normandy Ct, Plymouth, MI
48510 E Normandy Ct, Plymouth, MI
 
2872 Duffers Lane, Commerce, MI
2872 Duffers Lane, Commerce, MI2872 Duffers Lane, Commerce, MI
2872 Duffers Lane, Commerce, MI
 
1436 Sheridan, Plymouth, MI | Steps from Downtown Plymouth
1436 Sheridan, Plymouth, MI | Steps from Downtown Plymouth1436 Sheridan, Plymouth, MI | Steps from Downtown Plymouth
1436 Sheridan, Plymouth, MI | Steps from Downtown Plymouth
 
Plymouth Michigan Real Estate Statistics | October 2010
Plymouth Michigan Real Estate Statistics | October 2010Plymouth Michigan Real Estate Statistics | October 2010
Plymouth Michigan Real Estate Statistics | October 2010
 
1724 Albany, Ferndale, Mi
1724 Albany, Ferndale, Mi1724 Albany, Ferndale, Mi
1724 Albany, Ferndale, Mi
 

Plymouth Michigan Real Estate Stats | February 2011

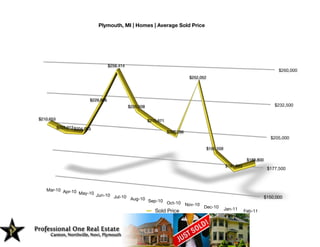
  • 1. Plymouth, MI | Homes | Average Sold Price $258,414 $260,000 $252,052 $229,896 $226,508 $232,500 $210,653 $215,671 $203,913 $204,093 $207,296 $205,000 $195,559 $188,800 $181,893 $177,500 Mar-10 Apr-10 May-10 Jun-10 Jul-10 Aug-10 $150,000 Sep-10 Oct-10 Nov-10 Dec-10 Jan-11 Sold Price Feb-11
  • 2. Plymouth MI | Homes | Sales Price as % of List Price 95.00% 93.42% 94.09% 93.67% 92.05% 92.60% 92.62% 93.21% 91.81% 92.08% 90.00% 91.41% 91.54% 88.88% 85.00% 80.00% Mar-10 Apr-10 May-10 Jun-10 75.00% Jul-10 Aug-10 Sep-10 Oct-10 Nov-10 Dec-10 Jan-11 Feb-11 SP/LP
  • 3. Plymouth MI | Homes | Average Days on Market 130 130 114 115 109 100 90 98 83 78 73 76 68 67 65 33 Mar-10 Apr-10 May-10 Jun-10 0 Jul-10 Aug-10 Sep-10 Oct-10 Nov-10 Dec-10 Jan-11 Feb-11 Days on Market
  • 4. Plymouth MI | Homes | Avg Sales Price per Square Foot $120 $113 $113 $109 $107 $109 $107 $108 $106 $104 $102 $104 $100 $93 $88 $79 Feb-11 $65 Dec-10 Jan-11 Oct-10 Nov-10 Jul-10 Aug-10 Sep-10 Apr-10 May-10 Jun-10 Mar-10 SP per SqFt