
Recommended
Recommended
More Related Content
Similar to Chapter One (Salkind)Statistics of Sadistics .docx
Similar to Chapter One (Salkind)Statistics of Sadistics .docx (20)
More from tiffanyd4
More from tiffanyd4 (20)
Recently uploaded
Recently uploaded (20)
Chapter One (Salkind)Statistics of Sadistics .docx
- 1. Chapter One (Salkind) Statistics of Sadistics? An Overview of This ChapterIn this chapter we cover the following items … Part One: Why Statistics? Part Two: A 5-Minute History of Statistics Part Three: Statistics: What It Is (And Isn’t) Part Four: What Am I Doing In A Statistics Class? Part Five: An Eye Toward The Future * Part One Why Statistics? Why Statistics?There may be dozens of reasons why statistics makes you groan:
- 2. I don’t like math I don’t understand math. Statistics are tough. Why do I even need this statistics stuff? Why can’t I just let a computer do statistics for me? * Why Statistics?There may be dozens of reasons why statistics makes you groan : I don’t plan on doing research when I graduate, so learning statistics is waste of time. The minute I leave class, I won’t remember any of this stuff. Those odd Greek symbols ( µ Σ σ ) make no sense! And a few other biggies … * Why Statistics?There may be dozens of reasons why statistics makes you groan : What am I supposed to do with a formula as complex as this?
- 3. Or this? * Why Statistics?Although you might have some trepidation about statistics and their applications, this course is designed to help you see past your fears, skepticism, and anxiousness about statistics I know statistics may scare a lot of you, but I think that is mostly because you don’t have the foundation yet to understand when, how, and why you should use statistics. But don’t let fear of the unknown prevent you from getting that knowledge. In a month, you might actually think methods is fun! * Part Two A 5-Minute History Of Statistics
- 4. A 5-Minute History of StatisticsImagine a caveman looking for food. He comes across a huge herd of bison, and he knows he can kill them all now OR come back time and time again. What does he do? What information does he use to make his decision about how many to kill and eat? If you said counting, you’re absolutely correct! Why deplete the food source if you only need a few bison at a time to live? Why not take only what you need and come back for more later? As our earliest ancestors came to know, counting is not only a good idea, it is a useful skill A 5-Minute History of StatisticsWe have come a long way from counting bison, as has our skills in trying to predict today what we hope to find tomorrow. A great deal of statistics compares our expectations with reality. If I expect XYZ to occur, will it? If it does occur, how confident can I be that I understand WHY it occurred. You’ll learn about a wide variety of statistics in this course, with some stats based on correlations (a relationship among variables) and some based on causation (A leads to B). A 5-Minute History of StatisticsCorrelational Research In correlational research, there is a relationship between two variables. That is, variables A and B are linked somehow When variable A increases, B also increases The more I like the color green, the more I’ll tend to buy green clothes
- 5. A 5-Minute History of StatisticsCorrelational Research In correlational research, there is a relationship between two variables. That is, variables A and B are linked somehow Or maybe when variable A decreases, B also decreases If I have a low opinion of Brussel sprouts, my likelihood of buying those disgusting green vegetables decreases A 5-Minute History of StatisticsCorrelational Research In correlational research, there is a relationship between two variables. That is, variables A and B are linked somehow Or it could be that as A increases, B decreases As I watch more TV (no studying!), my grades decrease A 5-Minute History of StatisticsCorrelational Research Some of the first “statistics” come from this correlation domain. Francis Galton, for example, studied intelligence by looking at the similarity of intelligence among members of the same family He used a correlation coefficient technique to assess this relationship (we’ll get to those in Chapter 5 - Salkind!)
- 6. Other early researchers looked at statistics in agricultural areas, astronomy, or politics. While such group statistics are common, other early researchers focused on single cases … A 5-Minute History of StatisticsSingle-Case Experimental Designs When it comes to human behavior, many early psychological researchers focused on single-case experimental designs As far back as 1860, Gustav Fechner explored human sensory processes by developing the concepts of sensory thresholds and just noticeable differences Imagine a regular staple (unstapled!). It has two prongs, right? Now, if you pressed the two prongs of this staple into your skin, would you feel two prongs or just one? Research by Fechner and others shows that we have different sensory thresholds for different body parts A 5-Minute History of StatisticsSingle-Case Experimental Designs When it comes to human behavior, many early psychological researchers focused on single-case experimental designs Fechner: That is, the receptors in our skin are NOT distributed in a uniform way in our bodies. Some areas—such as our fingers and lips—have more touch receptors than other areas, such as our backs. That's one reason
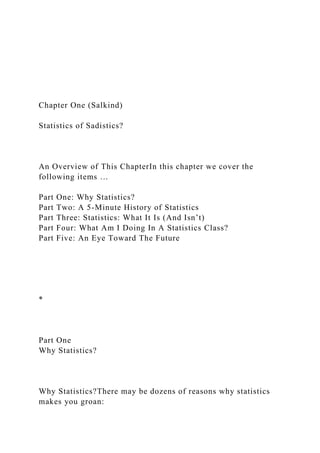
- 7. why we are more sensitive to touch in our fingers and face than on our backs. We can feel both staple prongs easier on our faces than on our backs! How Far Do Prongs Need To Be Apart Before We Can Detect Two Prongs? SiteThreshold DistanceFingers2-3 mmUpper Lip5 mmCheek6 mmNose7 mmPalm10 mmForehead15 mmFoot20 mmSiteThreshold DistanceBelly30 mmForearm35 mmUpper arm39 mmBack39 mmShoulder41 mmThigh42 mmCalf45 mm
- 8. A 5-Minute History of StatisticsSingle-Case Experimental Designs Think about some other early single-case experimenters … Herman Ebbinghaus: Focused on verbal learning and memory, often testing himself with “nonsense” syllables He’d memorize list of syllables, like “FHS” and “UDP” and then quiz himself on these lists A 5-Minute History of StatisticsSingle-Case Experimental Designs Think about some other early single-case experimenters … John Watson looked at fear responses in “Little Albert”. Do you know about this infant, Little Albert? Watson presented Albert with a white rat, which Albert loved. Then Watson clanged a hammer into a metal pole, scaring the baby in the presence of the rat. Soon, Albert paired the loud noise with the presence of the rat, and Albert developed a rat phobia. The list of single-case experiments goes on, of course, but our statistical understanding in psychology leapt forward with the advent of complex techniques like the t-Test and ANOVA A 5-Minute History of StatisticsExperimental Procedures
- 9. Statisticians like Ronald Fisher developed powerful statistics in the early 1920s to better understand the relationships among variables and between groups Today, statistics are easier to run and understand given the technological tools at our disposal (like SPSS on computers!) But just because we have tools that run statistics fast doesn’t mean we should neglect our understanding of those statistics A 5-Minute History of StatisticsExperimental Procedures The good thing to know (especially in this course) is that the statistical tests we use (and the reasons behind why and when we use them) have a degree of standardization. A 5-Minute History of StatisticsExperimental Procedures Such standardization lets us use the same kind of analyses across a wide variety of studies, providing us with a common language about results. It also gives us the ability to compare one study to another This class will each you that common language!
- 10. Part Three Statistics: What It Is (And Isn’t) Statistics: What It Is (And Isn’t)What are statistics? Statistics describe a set of tools and techniques used for describing, organizing, and interpreting information or data Data might involve scores on a test, speed with which problems are solved, the number of complaints that get called in to an Apple center’s help line when the newest iPhone goes berserk, etc. In this course, we will concentrate on two primary statistics: 1. Descriptive Statistics 2. Inferential Statistics Statistics: What It Is (And Isn’t)1. Descriptive Statistics Descriptive statistics are used to organize and describe the characteristics of a collection of data (a data set or just data) In your introductory statistics class, you probably came across a few of these “descriptive” statistics, including: A. The Mode B. The Median C. The Mean D. The Standard Deviation Statistics: What It Is (And Isn’t)1. Descriptive Statistics A. The mode is simply the most frequently occurring response
- 11. in a data set. Below, which is the most frequently occurring food (the most preferred food)? NameAgePreferred FoodLiving SituationJill17ItalianOff- campusAlfred18SaladsOff-CampsGary18MexicanOff- CampusBeth20ChineseOn-CampusRoss19ItalianOff- CampusAmanda21ThaiOn-CampusStephanie22GermanOff- Campus Statistics: What It Is (And Isn’t)1. Descriptive Statistics B. The median is the middle number in a distribution. Think about the following data set. If you ranked ages from low to high, which one falls in the middle? NameAgePreferred FoodLiving SituationJill17ItalianOff- campusAlfred18SaladsOff-CampsGary18MexicanOff- CampusBeth20ChineseOn-CampusRoss19ItalianOff- CampusAmanda21ThaiOn-CampusStephanie22GermanOff- Campus
- 12. Statistics: What It Is (And Isn’t)1. Descriptive Statistics C. The mean is simply the average number. In this case, we again only look at ranked data. What is the average age? NameAgePreferred FoodLiving SituationJill17ItalianOff- campusAlfred18SaladsOff-CampsGary18MexicanOff- CampusRoss19ItalianOff-CampusBeth20ChineseOn- CampusAmanda21ThaiOn-CampusStephanie22GermanOff- Campus
- 13. Statistics: What It Is (And Isn’t)1. Descriptive Statistics C. The mean is simply the average number. What is the mean for preferred food? NameAgePreferred FoodLiving SituationJill17ItalianOff- campusAlfred18SaladsOff-CampsGary18MexicanOff- CampusRoss19ItalianOff-CampusBeth20ChineseOn- CampusAmanda21ThaiOn-CampusStephanie22GermanOff- Campus Statistics: What It Is (And Isn’t)1. Descriptive Statistics See, you’re a statistician already! Now for the hard one: D. The standard deviation, or the average amount of variation in a set of scores or the score’s deviation from the mean
- 14. NameAgePreferred FoodLiving SituationJill17ItalianOff- campusAlfred18SaladsOff-CampsGary18MexicanOff- CampusRoss19ItalianOff-CampusBeth20ChineseOn- CampusAmanda21ThaiOn-CampusStephanie22GermanOff- Campus Statistics: What It Is (And Isn’t)1. Descriptive Statistics D. The standard deviation (SD): What is the SD for age? NameAgePreferred FoodLiving SituationJill17ItalianOff- campusAlfred18SaladsOff-CampsGary18MexicanOff- CampusRoss19ItalianOff-CampusBeth20ChineseOn- CampusAmanda21ThaiOn-CampusStephanie22GermanOff- Campus
- 15. Statistics: What It Is (And Isn’t)1. Descriptive Statistics D. The standard deviation (SD): What is the SD for age? Here’s your formula … Now solve! NameAgePreferred FoodLiving SituationJill17ItalianOff- campusAlfred18SaladsOff-CampsGary18MexicanOff- CampusRoss19ItalianOff-CampusBeth20ChineseOn- CampusAmanda21ThaiOn-CampusStephanie22GermanOff- Campus
- 16. Statistics: What It Is (And Isn’t)2. Inferential Statistics Inferential statistics are used to make inferences (get it!) from a smaller group of data (a sample) to a larger one (a population) Think about our class, which is a small sample of all psych majors at FIU. While I may want to know if the material that you see in this course helps you understand statistics, I may want to infer whether the course material would help other FIU psychology majors who are NOT currently taking stats. That is, can I infer that YOUR performance would apply to the LARGER population of psychology majors at FIU? Statistics: What It Is (And Isn’t)2. Inferential Statistics We will learn a lot more about inferential statistics when we get to chapters 9, 10, 11, and 12 toward the end of the semester. For now, let’s get back to the question we started this chapter with: What am I doing in a statistics class? Part Four What Am I Doing In A Statistics Class? What Am I Doing In A Statistics Class?What am I doing in a statistics class? Probably the most common answer among psych students is, “It’s required for my major!” But statistics will help you in
- 17. many other important ways 1. Taking this course shows your level of commitment to psychology 2. This course will give you an intellectual challenge in both writing about and engaging in psychological research What Am I Doing In A Statistics Class?What am I doing in a statistics class? Probably the most common answer among psych students is, “It’s required for my major!” But statistics will help you in many other important ways 3. More importantly, understanding foundational concepts in research starting from the ground-up will help you as you move to higher level undergraduate courses By the end of the two semester Research Methods and Design courses, you’ll have a better understanding of idea generation, study design, study implementation, data analysis, and publication What Am I Doing In A Statistics Class?What am I doing in a statistics class? Probably the most common answer among psych students is, “It’s required for my major!” But statistics will help you in many other important ways 4. If you plan a career in any social, behavioral, or biological field, this course will give you the foundation many graduate programs expect of their incoming students 5. You can brag that you completed a tough course! (And it will be tough, but entirely doable. I think you’ll be surprised at just how much you will learn!)
- 18. 6. Plus, it IS required, but I hope you like it anyway! Part Five An Eye Toward The Future An Eye Toward The FutureThe next few classes … Next class we are going to jump to a different book (Smith and Davis, The Psychologist as Detective), so make sure to read Chapter 5 in Smith and Davis: “Using The Scientific Method” Be aware that we will continue with Smith and Davis for several lectures, coming back to Salkind later this semester An Eye Toward The FutureThe next few classes … Smith and Davis will help us explore some of the foundational topics we need when beginning research, giving us a chance to look at characteristics of hypotheses, variables, and scientific methodology!