
Recommended
More Related Content
Similar to Department of Engineering Management and Systems Engineering Manag.docx
Similar to Department of Engineering Management and Systems Engineering Manag.docx (13)
More from theodorelove43763
More from theodorelove43763 (20)
Recently uploaded
Recently uploaded (20)
Department of Engineering Management and Systems Engineering Manag.docx
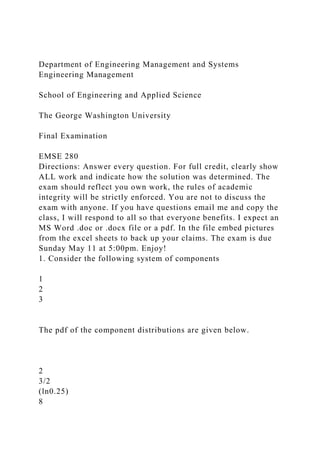
- 1. Department of Engineering Management and Systems Engineering Management School of Engineering and Applied Science The George Washington University Final Examination EMSE 280 Directions: Answer every question. For full credit, clearly show ALL work and indicate how the solution was determined. The exam should reflect you own work, the rules of academic integrity will be strictly enforced. You are not to discuss the exam with anyone. If you have questions email me and copy the class, I will respond to all so that everyone benefits. I expect an MS Word .doc or .docx file or a pdf. In the file embed pictures from the excel sheets to back up your claims. The exam is due Sunday May 11 at 5:00pm. Enjoy! 1. Consider the following system of components 1 2 3 The pdf of the component distributions are given below. 2 3/2 (ln0.25) 8
- 2. 1.5 /10 3/2 1/2 10 2 1 Component A () 2 Component B () (1/10) 1 Component C () 96 3 Component D () 2010 1 Component X () 50 x x x x x fxe x fxe fxxe x fxe fxxe p - - - -
- 3. æö - ç÷ èø - = = = æöæö = ç÷ç÷ èøèø = 2 /200 a. Find the mission length that corresponds to a probability of mission success (that is the system continues to function) of .9 b. Approximate and plot the failure rate curve for the system and discuss what it says about the system. 2. Consider the following system of components where the failure data for component 1 and 2 are given as (where “+” indicates a censored test) Component 1 2 14.2 15.+
- 4. 7.7 1.8 12.0+ 8.0+ 9.7 17.0+ 2.3 5.2 4.6 3.5 3.1 18.+ 10.0+ 8.6 10.0+ 3.9 9.4 6.9 7.3 19.0+ 16.0+ 11.0+ 13.0+ 16.0+ 6 0.8 1.8 4.3 Unfortunately there are only two data points, failure at 2.8 and a censored value at 10 for component 3. This is not enough data, so in addition to the data, experts specified that an exponential distribution would be appropriate distribution for component 3 Probability
- 5. 0.05 0.5 0.1 0.4 0.2 0.1 What is the probability of this system surviving a mission of length 10? 3. Consider the following system of components A B C D E where for a fixed mission time we have the following data. For 1000 missions the following failures were observed Failures of A 11 Failures of B 15 Failures of C 9 Failures of D 11 Failures of E 7 Failures of A and B 3 Failures of C and D 5 Failures of C and E 7
- 6. Failures of D and E 5 Failures of C, D, and E 2 What is the probability of system failure assuming a multivariate exponential model? 4. A component life time, T, is known to have a failure distribution (pdf) of the form ( ) q q q t e t f - = 1 ) | ( for t>0 Since ( is unknown a prior distribution is specified as
- 7. ( ) q b a a q a b q - + G = e g 1 1 ) ( ) ( for (>0 (this is not a distribution you have seen before) with (=2 and ( = 10 a. What does ( represent, i.e. what is your interpretation of (? b. Based on the prior, what is a point estimate for (? c. Derive the predictive distribution for T. d. If 5 systems are tested until time t=10 and three failures are
- 8. observed at 5, 7, and 8, what would be your estimate that a new system would survive for a mission of length 10? NOTE: This is not a spreadsheet problem! 5. (20 points) Consider the NHPP with mean value function M(t) = (1/()Ln(((t+1). Given the following interarrival time data 5.5 1.83 2.75 17.89 3.94 14.98 3.47 9.96 11.39 19.88 7.81 14.6 11.41 18.94 25.3 75.67 82.69 31.61 129.31 47.6 a. What is the probability that the next arrival time will be more than 10 time units? b. Predict the number of arrivals in the next interval of size 10 time units. c. What is the probability of no arrivals in the next 10 time units and then more than 2 arrivals in the next 10 time units
- 9. after that? PAGE 4 _1243576207.unknown _1367753722.unknown _1243575680.unknown Bond Analysis 3 Running Head: BOND ANALYSIS Bond Analysis Answer. 1 The below table indicates the bond yields for Treasury securities with the maturities of three months, six months, one year, three years, five years, 10 years, 30 years. Treasury Yield (%) 3-Month 0.023
- 10. 6-Month 0.056 1-Year 0.091 3-Year 0.672 5-Year 1.497 10-Year 2.651 30-Year 3.604 (Source: Dow Jones & Company, Inc, 2014) On the basis of this table, creates a yield curve through placing yield-to-maturity on the vertical (y) axis and term-to-maturity on the horizontal (x) axis, which is shown in the below: The above yield curve graphic indicators of the US bonds’ future value that helps the investors to visualize the changes in the interest rate on bonds represents to the maturity date. The general shape of the yield curve is upward meant the yield rate is increased when the maturity of yield increased. The yield curve indicates that in the future interest rate movements similarly with the yield curve means the high maturity Treasury bond secured interest rate is higher than low rate maturity (Brigham & Houston, 2009). In addition, it can also be concluded that yield curve indicates uncertainties of the economy and investors were profitable if they would outsmart the dealers those trades constitute the curve. Answer. 2 (a) In the case of yield-to-maturity (YTM) on the bond falls from 8.5% to 8%, then the present value of the treasury or the band raise means the market price increases. For example, if the future value (FV) of $1000 then calculation of present values is given below: FV= $1000
- 11. I = 8.0% (the new YTM) N = 10 (number of years) PMT= $90 P/Y = 1 Then, the PV is $1067.10 that means the new price is $1067.10. It indicates that if the YTM falls from 8.5% to 8%, then the price rises (Choudhry, 2002). (b) In the case of bond gets one year closer to its maturity than the present value ($1000) and future value ($1000) of bond is similar. So, if the bond gets one year closer to its maturity than the YTM and coupon rate are equal and the price of a bond is similar to the par value. (c) In the case of the market interest rates go from 8% to 9%, then the price of the bond is declined. For example, calculation of present values is given below: FV= $1000 I = 9.0% (the new YTM) N = 10 (number of years) PMT= $90 P/Y = 1 Then, the PV is $968.61 that means the new price of bond of $968.61 that shows that if the market interest rates go from 8% to 9% than the price of bond decreases and less than the par value of bond (Choudhry, 2002). References Brigham, E.F. & Houston, J.F. (2009). Fundamentals of Financial Management. USA: Cengage Learning. Choudhry, M. (2002). Capital Market Instruments: Analysis and Valuation. UK: FT Press. Dow Jones & Company, Inc. (2014). Barron's: Bonds, Rates & Credit Markets Overview. Retrieved from: http://online.barrons.com/mdc/public/page/9_3010.html?refresh =on Yield (%) 3-Month 6-Month 1-Year 3-Year 5-Year
- 12. 10-Year 30-Year 2.300000000000001E-2 5.6000000000000022E-2 9.1000000000000025E-2 0.67200000000000171 1.4969999999999974 2.6509999999999998 3.6040000000000001