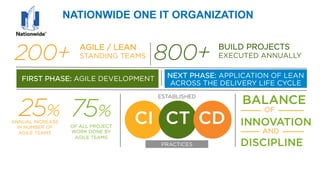
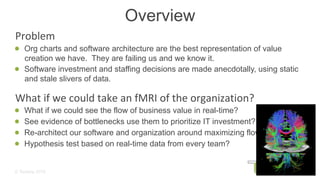
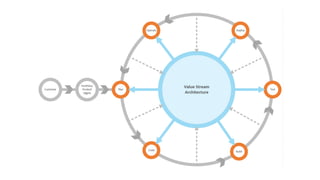
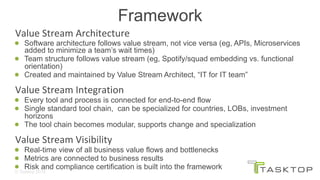
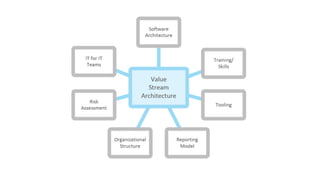
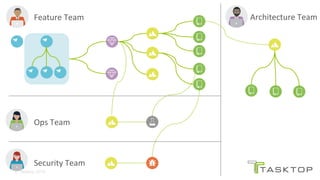
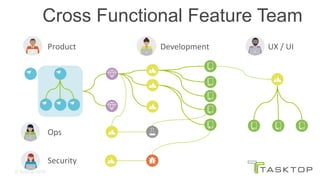
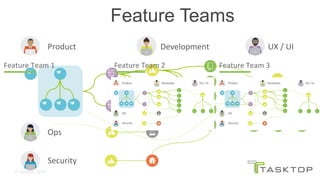
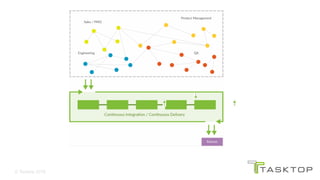
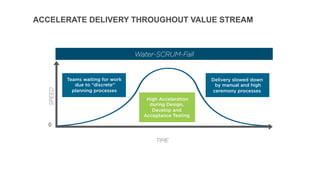
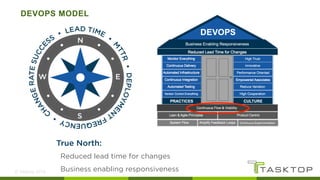
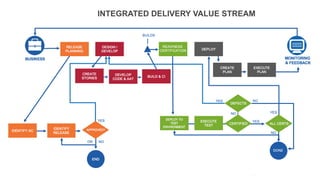
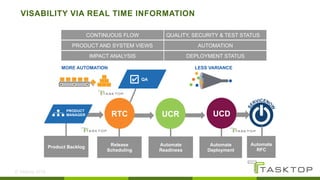
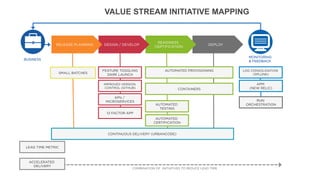
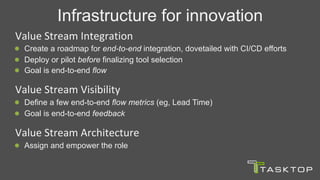
© Tasktop 2016
Value Stream Architecture
ersten (TaskTop CEO) Carmen DeArdo (Nationwide Technology Director)
© Tasktop 2016
of	the	
Fortune	
100	43	of	the	top	25	
world	banks	11	
of	the	top	10	
US	insurers	4	
of	the	top	6	
health	plans	6
© Tasktop 2016
We are a strong mutual
company built to serve
our members.#68 ON THE
FORTUNE
500 LIST
© Tasktop 2016
NATIONWIDE ONE IT ORGANIZATION
200+ AGILE / LEAN
STANDING TEAMS 800+ BUILD PROJECTS
EXECUTED ANNUALLY
ANNUAL INCREASE
IN NUMBER OF
AGILE TEAMS
75%
OF ALL PROJECT
WORK DONE BY
AGILE TEAMS
CI CT CD
ESTABLISHED
PRACTICES
NEXT PHASE: APPLICATION OF LEAN
ACROSS THE DELIVERY LIFE CYCLE
OF
AND
BALANCE
INNOVATION
DISCIPLINE
FIRST PHASE: AGILE DEVELOPMENT
25%
© Tasktop 2016
  Problem	
Org charts and software architecture are the best representation of value
creation we have. They are failing us and we know it.
Software investment and staffing decisions are made anecdotally, using static
and stale slivers of data.
  What	if	we	could	take	an	fMRI	of	the	organization?	
What if we could see the flow of business value in real-time?
See evidence of bottlenecks use them to prioritize IT investment?
Re-architect our software and organization around maximizing flow?
Hypothesis test based on real-time data from every team?
Overview
What if we could take an fMRI of the
organization?
© Tasktop 2017
Innovation	&	disruption
© Tasktop 2016
© Tasktop 2016
  Types	of	disruption	
Infrastructure model: product is now a connected car
Operating model: Tesla’s disruption of dealerships
Business model: Autonomous fleets
  What	it	means	
Software innovation will determine which organizations decline, which thrive
We need to provide our organizations with an infrastructure for innovation
  Easy	for	a	startup	
Tech startups are engines for software innovation
But things change at scale scale…
Types of disruption
Fragmented Value StreamBusinessValue
Best-of-breed tool chain
RevenueResults
We need a new layer of infrastructure
for the software Value Stream
© Tasktop 2016
© Tasktop 2016
  Value	Stream	Architecture	
Software architecture follows value stream, not vice versa (eg, APIs, Microservices
added to minimize a team’s wait times)
Team structure follows value stream (eg, Spotify/squad embedding vs. functional
orientation)
Created and maintained by Value Stream Architect, “IT for IT team”
  Value	Stream	Integration	
Every tool and process is connected for end-to-end flow
Single standard tool chain, can be specialized for countries, LOBs, investment
horizons
The tool chain becomes modular, supports change and specialization
  Value	Stream	Visibility	
Real-time view of all business value flows and bottlenecks
Metrics are connected to business results
Risk and compliance certification is built into the framework
Framework
© Tasktop 2016
© Tasktop 2016
Feature	Team	 Architecture	Team	
Security	Team	
Ops	Team
© Tasktop 2016
Product	 UX	/	UI	
Security	
Ops	
Cross Functional Feature Team
Development
© Tasktop 2016
Feature Teams
Product	 UX	/	UI	
Security	
Ops	
Development	
Feature	Team	1	 Feature	Team	2	 Feature	Team	3
© Tasktop 2016
© Tasktop 2017
  We need to think about software development differently
  Linear and batch-oriented models are over-simplified and
wrong
Not a linear manufacturing process
Agile	2011	 SXSW	2012	 ALM	Forum	2015
New York
Vancouver
Greenland
Paris
Moscow
Beijing
Sydney
Cairo
Rio
New York
Vancouver
Greenland
Paris
Moscow
Beijing
Sydney
Cairo
Rio
  Flow	units	
Features added, defects fixed, vulnerabilities fixed
  Optimizing	for	linear	flow	
Optimize for repeatability
Remove all creative and non-deterministic steps
De-couple planning and design from production
  This	model	doesn’t	work	for	software	
Waterfall and RUP were an attempt to make software linear
Overly narrow DevOps transformations running into the same issue
What flows in a software value stream?
© Tasktop 2016
  Creates	visibility	
Designs and implements end-to-end flow, working with functional heads and LOB
leaders
Provides visualization of all value streams and identifies constraints
Connects value stream metrics to business metrics
Head or key part of IT for IT team
  Influences	
Supports the DevOps transformation by driving change and future state of value
stream
Drives value stream improvement work across team backlogs
  Mentors	and	trains		
Continually identify training and skill deficiency bottlenecks
Work with IT leaders to close knowledge/skill gaps
Value Stream Architect
© Tasktop 2016
Flow Units
Work Items	 Aka	 Pulled by	 Description	
Feature Story	 Requirements,
User Stories	
User/Customers	 New business value added to the
application, visible to the customer	
Defect Story	 Bug	 User/Customers	 Fixes for quality problems that
affect customer experience	
Security Story	 Vulnerability	 Security Officers/
Auditors	
Fixes for weaknesses, flaws and
vectors for exploits	
Tech Debt Story	 	
	
Software Architects,
Teams	
Improvement to the software
architecture, invisible to the
customer	
Value Stream Story	 	
	
Value Stream
Architects	
Improvement to the value stream
architecture, invisible to the
customer
© Tasktop 2016
Flow Measures
Flow Measures	 Description	 Example	
Backlog Size	 Number of artifacts in the queue at a
particular stage of the value stream	
The number of Security Stories on an
Agile team’s backlog.	
Lead Time	 Time from request to delivered artifact
running in production	
Hours from customer requesting a
feature to using the requested feature.	
Cycle Time	 Time from work start to completion	 Days from developer accepting a
Feature Story to merging the finished
implementation to master. 	
Process time	 Time an artifact is actively worked on	 Cumulative days a Feature Story is
actively worked on. 	
Wait time	 Time from work request to work start	 Time zone delay in hours for an offshore
team to start work on a Feature Story. 	
Utilization	 Sum of process times of lead time (%)	 Low utilization for a Dev team with an
external dependency
© Tasktop 2016
Flow Metrics
Flow Metrics	 Type	 Description	
End-to-end Lead
Time	
Velocity	 Time from customer request to improvement running in production 	
Cost per Work Item	 Cost	 Work items shipped per FTE.	
Mean Time To
Repair (MTTR)	
Responsiven
ess	
Round-trip time from support ticket, through Defect Story creation,
diagnosis, fix through to delivery. 	
Productivity	 Throughput	 Number of Work Items delivered per team per release.	
New Business
Value Ratio	
Value	 Proportion of Artifacts of type Feature Story delivered per release.
© Tasktop 2016
SPEED
TIME
High Acceleration
during Design,
Develop and
Acceptance Testing
0
Teams waiting for work
due to “discrete”
planning processes
Delivery slowed down
by manual and high
ceremony processes
Water-SCRUM-Fall	
ACCELERATE DELIVERY THROUGHOUT VALUE STREAM
27
© Tasktop 2016
DEVOPS MODEL
True North:
  Reduced lead time for changes
  Business enabling responsiveness 28
© Tasktop 2016
INTEGRATED DELIVERY VALUE STREAM
29
© Tasktop 2016
VISABILITY VIA REAL TIME INFORMATION
30
Release
Scheduling
Automate
Readiness
Automate
Deployment
PRODUCT
MANAGER
Product Backlog
QA✔
CONTINUOUS FLOW
PRODUCT AND SYSTEM VIEWS
IMPACT ANALYSIS
QUALITY, SECURITY & TEST STATUS
AUTOMATION
DEPLOYMENT STATUS
MORE AUTOMATION LESS VARIANCE
RTC UCR UCD
Automate
RFC
© Tasktop 2016
MEASURING LEAD TIME
31
STORY
BUSINESS
BUSINESS
INITIATIVE A
SYSTEM RELEASE
AC AC
SCM CI
IT / ST /
PT / UAT
CODE
STATION
TEST RESULTS / PT /
SECURITY
READY FOR
PRODUCTION
WORK
INTAKE
RELEASE
PLANNING
DESIGN /
DEVELOP
QUALITY
CERTIFIED
DEPLOY
INITIATIVE BUILDS
FEEDBACK
BUSINESS VALUE
DEPLOY
FEEDBACK
BUSINESS VALUE
BUSINESS
TASKTOP
INITIATIVE
BACKLOG WIP DONE
MULTIPLE
DEPLOYS
QUALITY
CERTIFIED
READY FOR
PRODUCTION
LEAD TIME
PPM
RTC
URBANCODE
RELEASE
URBANCODE
DEPLOY
VALUE STREAM
PROCESS STREAM
TOOL STREAM
DEPLOY
© Tasktop 2016
MEASURING LEAD TIME
32
STORY
BUSINESS
BUSINESS
INITIATIVE A
SYSTEM RELEASE
AC AC
SCM CI
IT / ST /
PT / UAT
CODE
STATION
TEST RESULTS / PT /
SECURITY
READY FOR
PRODUCTION
WORK
INTAKE
RELEASE
PLANNING
DESIGN /
DEVELOP
QUALITY
CERTIFIED
DEPLOY
INITIATIVE BUILDS
FEEDBACK
BUSINESS VALUE
DEPLOY
FEEDBACK
BUSINESS VALUE
BUSINESS
TASKTOP
INITIATIVE
BACKLOG WIP DONE
MULTIPLE
DEPLOYS
QUALITY
CERTIFIED
READY FOR
PRODUCTION
CLARITY
RTC
URBANCODE
RELEASE
URBANCODE
DEPLOY
VALUE STREAM
PROCESS STREAM
TOOL STREAM
DEPLOY
6/1 6/10 6/24 6/26 6/24-6/26 6/30 7/5 7/15
LEAD TIME (45 DAYS)
© Tasktop 2016 33
DELIVERY PIPELINE
MONITORING
& FEEDBACK
VERSION
CONTROL
PULL REQUESTS
INTEGRATION
SYSTEM
REGRESSION
PERFORMANCE
ZERO DOWN TIME
DEPLOYMENTS
DEPLOY
INTO TEST
STATIC ANALYSIS
SECURITY SCANS
AUTOMATED UNIT
& ACCEPTANCE
TESTS
DEPLOY
INTO PROD
AUTOMATED
CERTIFICATIO
N
AUTO
PROVISION
SOURCE
CODE
BUILD
DESIGN /
DEVELOP
FEATURE
TOGGLING
TRUNK-BASED
DEVELOPMENT
UAT
™
TOOLS	
BUSINESS
VALUE
DEFECTS
TECHICAL DEBT
DARK LAUNCHING
DELIVERY PIPELINE
© Tasktop 2016
VALUE STREAM INITIATIVE MAPPING
34
BUSINESS
MONITORING
& FEEDBACK
LEAD TIME METRIC
COMBINATION OF INITIATIVES TO REDUCE LEAD TIME
ACCELERATED
DELIVERY
DEPLOY
READINESS
CERTIFICATION
DESIGN / DEVELOPRELEASE PLANNING
CONTINUOUS DELIVERY (URBANCODE)
FEATURE TOGGLING
DARK LAUNCH
IMPROVED VERSION
CONTROL (GITHUB)
APIs /
MICROSERVICES
12 FACTOR APP
AUTOMATED PROVISIONING
CONTAINERS
AUTOMATED
TESTING
AUTOMATED
CERTIFICATION
RUN
ORCHESTRATION
SMALL BATCHES
LOG CONSOLIDATION
(SPLUNK)
APM
(NEW RELIC)
© Tasktop 2016
All revolutions require a new
infrastructure
Value Stream Networks
are the infrastructure for digital
transformation
© Tasktop 2016
Value Stream Visibility
© Tasktop 2016
Pitfalls of wrong model
Cyclomatic complexity v. lead time
Repeatability v. design thinking
No modeling of latency, throughput
Inability to see the bottleneck
© Tasktop 2016
...the most important question…
Where is the bottleneck?
© Tasktop 2016
VALUE STREAM INITIATIVE MAPPING
39
BUSINESS
MONITORING
& FEEDBACK
LEAD TIME METRIC
COMBINATION OF INITIATIVES TO REDUCE LEAD TIME
ACCELERATED
DELIVERY
DEPLOY
READINESS
CERTIFICATION
DESIGN / DEVELOPRELEASE PLANNING
CONTINUOUS DELIVERY (URBANCODE)
FEATURE TOGGLING
DARK LAUNCH
IMPROVED VERSION
CONTROL (GITHUB)
APIs /
MICROSERVICES
12 FACTOR APP
AUTOMATED PROVISIONING
CONTAINERS
AUTOMATED
TESTING
AUTOMATED
CERTIFICATION
RUN
ORCHESTRATION
SMALL BATCHES
LOG CONSOLIDATION
(SPLUNK)
APM
(NEW RELIC)
  Value	Stream	Integration	
Create a roadmap for end-to-end integration, dovetailed with CI/CD efforts
Deploy or pilot before finalizing tool selection
Goal is end-to-end flow
  Value	Stream	Visibility	
Define a few end-to-end flow metrics (eg, Lead Time)
Goal is end-to-end feedback
  Value	Stream	Architecture		
Assign and empower the role
Infrastructure for innovation
© Tasktop 2016
Here’s the help we are looking for
© Tasktop 2016© Tasktop 2016
Infrastructure for Innovation
Dr. @mik_kersten @carmendeardo

The Case for Value Stream Architecture

  • 1.
    © Tasktop 2016 ValueStream Architecture ersten (TaskTop CEO) Carmen DeArdo (Nationwide Technology Director)
  • 2.
  • 3.
    © Tasktop 2016 Weare a strong mutual company built to serve our members.#68 ON THE FORTUNE 500 LIST
  • 4.
    © Tasktop 2016 NATIONWIDEONE IT ORGANIZATION 200+ AGILE / LEAN STANDING TEAMS 800+ BUILD PROJECTS EXECUTED ANNUALLY ANNUAL INCREASE IN NUMBER OF AGILE TEAMS 75% OF ALL PROJECT WORK DONE BY AGILE TEAMS CI CT CD ESTABLISHED PRACTICES NEXT PHASE: APPLICATION OF LEAN ACROSS THE DELIVERY LIFE CYCLE OF AND BALANCE INNOVATION DISCIPLINE FIRST PHASE: AGILE DEVELOPMENT 25%
  • 5.
    © Tasktop 2016  Problem Org charts and software architecture are the best representation of value creation we have. They are failing us and we know it. Software investment and staffing decisions are made anecdotally, using static and stale slivers of data.   What if we could take an fMRI of the organization? What if we could see the flow of business value in real-time? See evidence of bottlenecks use them to prioritize IT investment? Re-architect our software and organization around maximizing flow? Hypothesis test based on real-time data from every team? Overview
  • 6.
    What if wecould take an fMRI of the organization?
  • 7.
  • 8.
  • 9.
    © Tasktop 2016  Types of disruption Infrastructure model: product is now a connected car Operating model: Tesla’s disruption of dealerships Business model: Autonomous fleets   What it means Software innovation will determine which organizations decline, which thrive We need to provide our organizations with an infrastructure for innovation   Easy for a startup Tech startups are engines for software innovation But things change at scale scale… Types of disruption
  • 10.
  • 11.
    We need anew layer of infrastructure for the software Value Stream
  • 12.
  • 13.
    © Tasktop 2016  Value Stream Architecture Software architecture follows value stream, not vice versa (eg, APIs, Microservices added to minimize a team’s wait times) Team structure follows value stream (eg, Spotify/squad embedding vs. functional orientation) Created and maintained by Value Stream Architect, “IT for IT team”   Value Stream Integration Every tool and process is connected for end-to-end flow Single standard tool chain, can be specialized for countries, LOBs, investment horizons The tool chain becomes modular, supports change and specialization   Value Stream Visibility Real-time view of all business value flows and bottlenecks Metrics are connected to business results Risk and compliance certification is built into the framework Framework
  • 14.
  • 15.
    © Tasktop 2016 Feature Team Architecture Team Security Team Ops Team
  • 16.
    © Tasktop 2016 Product UX / UI Security Ops Cross Functional Feature Team Development
  • 17.
    © Tasktop 2016 FeatureTeams Product UX / UI Security Ops Development Feature Team 1 Feature Team 2 Feature Team 3
  • 18.
  • 19.
    © Tasktop 2017  We need to think about software development differently   Linear and batch-oriented models are over-simplified and wrong Not a linear manufacturing process Agile 2011 SXSW 2012 ALM Forum 2015
  • 20.
  • 21.
  • 22.
      Flow units Features added,defects fixed, vulnerabilities fixed   Optimizing for linear flow Optimize for repeatability Remove all creative and non-deterministic steps De-couple planning and design from production   This model doesn’t work for software Waterfall and RUP were an attempt to make software linear Overly narrow DevOps transformations running into the same issue What flows in a software value stream?
  • 23.
    © Tasktop 2016  Creates visibility Designs and implements end-to-end flow, working with functional heads and LOB leaders Provides visualization of all value streams and identifies constraints Connects value stream metrics to business metrics Head or key part of IT for IT team   Influences Supports the DevOps transformation by driving change and future state of value stream Drives value stream improvement work across team backlogs   Mentors and trains Continually identify training and skill deficiency bottlenecks Work with IT leaders to close knowledge/skill gaps Value Stream Architect
  • 24.
    © Tasktop 2016 FlowUnits Work Items Aka Pulled by Description Feature Story Requirements, User Stories User/Customers New business value added to the application, visible to the customer Defect Story Bug User/Customers Fixes for quality problems that affect customer experience Security Story Vulnerability Security Officers/ Auditors Fixes for weaknesses, flaws and vectors for exploits Tech Debt Story Software Architects, Teams Improvement to the software architecture, invisible to the customer Value Stream Story Value Stream Architects Improvement to the value stream architecture, invisible to the customer
  • 25.
    © Tasktop 2016 FlowMeasures Flow Measures Description Example Backlog Size Number of artifacts in the queue at a particular stage of the value stream The number of Security Stories on an Agile team’s backlog. Lead Time Time from request to delivered artifact running in production Hours from customer requesting a feature to using the requested feature. Cycle Time Time from work start to completion Days from developer accepting a Feature Story to merging the finished implementation to master. Process time Time an artifact is actively worked on Cumulative days a Feature Story is actively worked on. Wait time Time from work request to work start Time zone delay in hours for an offshore team to start work on a Feature Story. Utilization Sum of process times of lead time (%) Low utilization for a Dev team with an external dependency
  • 26.
    © Tasktop 2016 FlowMetrics Flow Metrics Type Description End-to-end Lead Time Velocity Time from customer request to improvement running in production Cost per Work Item Cost Work items shipped per FTE. Mean Time To Repair (MTTR) Responsiven ess Round-trip time from support ticket, through Defect Story creation, diagnosis, fix through to delivery. Productivity Throughput Number of Work Items delivered per team per release. New Business Value Ratio Value Proportion of Artifacts of type Feature Story delivered per release.
  • 27.
    © Tasktop 2016 SPEED TIME HighAcceleration during Design, Develop and Acceptance Testing 0 Teams waiting for work due to “discrete” planning processes Delivery slowed down by manual and high ceremony processes Water-SCRUM-Fall ACCELERATE DELIVERY THROUGHOUT VALUE STREAM 27
  • 28.
    © Tasktop 2016 DEVOPSMODEL True North:   Reduced lead time for changes   Business enabling responsiveness 28
  • 29.
    © Tasktop 2016 INTEGRATEDDELIVERY VALUE STREAM 29
  • 30.
    © Tasktop 2016 VISABILITYVIA REAL TIME INFORMATION 30 Release Scheduling Automate Readiness Automate Deployment PRODUCT MANAGER Product Backlog QA✔ CONTINUOUS FLOW PRODUCT AND SYSTEM VIEWS IMPACT ANALYSIS QUALITY, SECURITY & TEST STATUS AUTOMATION DEPLOYMENT STATUS MORE AUTOMATION LESS VARIANCE RTC UCR UCD Automate RFC
  • 31.
    © Tasktop 2016 MEASURINGLEAD TIME 31 STORY BUSINESS BUSINESS INITIATIVE A SYSTEM RELEASE AC AC SCM CI IT / ST / PT / UAT CODE STATION TEST RESULTS / PT / SECURITY READY FOR PRODUCTION WORK INTAKE RELEASE PLANNING DESIGN / DEVELOP QUALITY CERTIFIED DEPLOY INITIATIVE BUILDS FEEDBACK BUSINESS VALUE DEPLOY FEEDBACK BUSINESS VALUE BUSINESS TASKTOP INITIATIVE BACKLOG WIP DONE MULTIPLE DEPLOYS QUALITY CERTIFIED READY FOR PRODUCTION LEAD TIME PPM RTC URBANCODE RELEASE URBANCODE DEPLOY VALUE STREAM PROCESS STREAM TOOL STREAM DEPLOY
  • 32.
    © Tasktop 2016 MEASURINGLEAD TIME 32 STORY BUSINESS BUSINESS INITIATIVE A SYSTEM RELEASE AC AC SCM CI IT / ST / PT / UAT CODE STATION TEST RESULTS / PT / SECURITY READY FOR PRODUCTION WORK INTAKE RELEASE PLANNING DESIGN / DEVELOP QUALITY CERTIFIED DEPLOY INITIATIVE BUILDS FEEDBACK BUSINESS VALUE DEPLOY FEEDBACK BUSINESS VALUE BUSINESS TASKTOP INITIATIVE BACKLOG WIP DONE MULTIPLE DEPLOYS QUALITY CERTIFIED READY FOR PRODUCTION CLARITY RTC URBANCODE RELEASE URBANCODE DEPLOY VALUE STREAM PROCESS STREAM TOOL STREAM DEPLOY 6/1 6/10 6/24 6/26 6/24-6/26 6/30 7/5 7/15 LEAD TIME (45 DAYS)
  • 33.
    © Tasktop 201633 DELIVERY PIPELINE MONITORING & FEEDBACK VERSION CONTROL PULL REQUESTS INTEGRATION SYSTEM REGRESSION PERFORMANCE ZERO DOWN TIME DEPLOYMENTS DEPLOY INTO TEST STATIC ANALYSIS SECURITY SCANS AUTOMATED UNIT & ACCEPTANCE TESTS DEPLOY INTO PROD AUTOMATED CERTIFICATIO N AUTO PROVISION SOURCE CODE BUILD DESIGN / DEVELOP FEATURE TOGGLING TRUNK-BASED DEVELOPMENT UAT ™ TOOLS BUSINESS VALUE DEFECTS TECHICAL DEBT DARK LAUNCHING DELIVERY PIPELINE
  • 34.
    © Tasktop 2016 VALUESTREAM INITIATIVE MAPPING 34 BUSINESS MONITORING & FEEDBACK LEAD TIME METRIC COMBINATION OF INITIATIVES TO REDUCE LEAD TIME ACCELERATED DELIVERY DEPLOY READINESS CERTIFICATION DESIGN / DEVELOPRELEASE PLANNING CONTINUOUS DELIVERY (URBANCODE) FEATURE TOGGLING DARK LAUNCH IMPROVED VERSION CONTROL (GITHUB) APIs / MICROSERVICES 12 FACTOR APP AUTOMATED PROVISIONING CONTAINERS AUTOMATED TESTING AUTOMATED CERTIFICATION RUN ORCHESTRATION SMALL BATCHES LOG CONSOLIDATION (SPLUNK) APM (NEW RELIC)
  • 35.
    © Tasktop 2016 Allrevolutions require a new infrastructure Value Stream Networks are the infrastructure for digital transformation
  • 36.
    © Tasktop 2016 ValueStream Visibility
  • 37.
    © Tasktop 2016 Pitfallsof wrong model Cyclomatic complexity v. lead time Repeatability v. design thinking No modeling of latency, throughput Inability to see the bottleneck
  • 38.
    © Tasktop 2016 ...themost important question… Where is the bottleneck?
  • 39.
    © Tasktop 2016 VALUESTREAM INITIATIVE MAPPING 39 BUSINESS MONITORING & FEEDBACK LEAD TIME METRIC COMBINATION OF INITIATIVES TO REDUCE LEAD TIME ACCELERATED DELIVERY DEPLOY READINESS CERTIFICATION DESIGN / DEVELOPRELEASE PLANNING CONTINUOUS DELIVERY (URBANCODE) FEATURE TOGGLING DARK LAUNCH IMPROVED VERSION CONTROL (GITHUB) APIs / MICROSERVICES 12 FACTOR APP AUTOMATED PROVISIONING CONTAINERS AUTOMATED TESTING AUTOMATED CERTIFICATION RUN ORCHESTRATION SMALL BATCHES LOG CONSOLIDATION (SPLUNK) APM (NEW RELIC)
  • 40.
      Value Stream Integration Create aroadmap for end-to-end integration, dovetailed with CI/CD efforts Deploy or pilot before finalizing tool selection Goal is end-to-end flow   Value Stream Visibility Define a few end-to-end flow metrics (eg, Lead Time) Goal is end-to-end feedback   Value Stream Architecture Assign and empower the role Infrastructure for innovation
  • 41.
    © Tasktop 2016 Here’sthe help we are looking for
  • 42.
    © Tasktop 2016©Tasktop 2016 Infrastructure for Innovation Dr. @mik_kersten @carmendeardo