Microscopic modeling of passenger transport demand based on time use diaries
•
0 likes•43 views

This document discusses a microscopic activity-based model called TAPAS for modeling passenger transport demand using time use diaries. TAPAS was developed at the Institute for Transport Research (IVF) in the German Aerospace Center (DLR) to model current and future traffic demand and analyze the effects of potential measures and scenarios. The summary discusses how TAPAS works, the data it requires, and possibilities for expanding it to model new activity patterns and future changes in transport behavior.

Recommended
Recommended
More Related Content
Similar to Microscopic modeling of passenger transport demand based on time use diaries
Similar to Microscopic modeling of passenger transport demand based on time use diaries (20)
Recently uploaded
Recently uploaded (20)
Microscopic modeling of passenger transport demand based on time use diaries
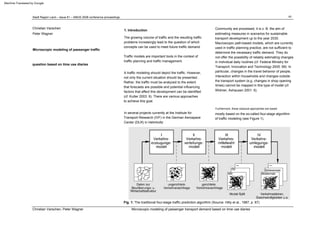
- 1. In several projects currently at the Institute for Transport Research (IVF) in the German Aerospace Center (DLR) in Helmholtz Furthermore, these classical approaches are based Community are processed, it is z. B. the aim of estimating measures in scenarios for sustainable transport development up to the year 2030. Macroscopic path-based models, which are currently used in traffic planning practice, are not sufficient to determine the necessary traffic demand. They do not offer the possibility of reliably estimating changes in individual daily routines (cf. Federal Ministry for Transport, Innovation and Technology 2005: 99). In particular, changes in the travel behavior of people, interaction within households and changes outside the transport system (e.g. changes in shop opening times) cannot be mapped in this type of model (cf. Widmer, Axhausen 2001: 6). mostly based on the so-called four-stage algorithm of traffic modeling (see Figure 1). 1. Introduction Fig. 1: The traditional four-stage traffic prediction algorithm (Source: Hilty et al., 1987, p. 67) Microscopic modeling of passenger transport demand based on time use diaries The growing volume of traffic and the resulting traffic problems increasingly lead to the question of which concepts can be used to meet future traffic demand. Christian Varschen, Peter Wagner Traffic models are important tools in the context of traffic planning and traffic management. A traffic modeling should depict the traffic. However, not only the current situation should be presented. Rather, the traffic must be analyzed to the extent that forecasts are possible and potential influencing factors that affect this development can be identified (cf. Kutter 2003: 9). There are various approaches to achieve this goal. Stadt Region Land – Issue 81 – AMUS 2006 conference proceedings 63 Microscopic modeling of passenger traffic Christian Varschen question based on time use diaries Peter Wagner Machine Translated by Google
- 2. each person in the synthetic population determines which activities they pursue in the period under consideration. The data from the time budget surveys of the Federal Statistical Office are used for this (further information from the Federal Statistical Office 2003). This is a representative survey in cooperation with the Ministry of Family Affairs. The previous version of the model worked with the data from the survey 2.1 Procedure and data basis of TAPAS 2. The TAPAS model activities taking into account the current spatial position and the spatial attributes of potential opportunities, the current status of the transport network, institutional conditions and the characteristics of individuals and households (cf. Arentze et al. 1997: II-J/3). Christian Varschen, Peter Wagner For the projects at the DLR-IVF, a model must on the one hand be able to depict future traffic, on the other hand it must be capable of scenarios or sensitive to measures, ie it must be able to react to the bundle of measures that used as a basis in the various scenarios. The TAPAS ( Travel and Activity Patterns Simulation) transport demand model developed at DLR-IVF is used for this purpose. It has a modular structure and forms the traffic in a defined space - e.g. B. a city or a district - from. So far it was used for the city of Cologne. A more detailed description of the model and comments on the Cologne application can be found in the literature (Hertkorn 2004). This model stands between the categories presented because – as will be explained – observed behavior in relation to the activities is used. But since z. For example, if people's search area is restricted, it is also assumed here that people are not fully informed. In the following, an overview of how TAPAS works and the data required for it will be given before a procedure for adding new activity categories is presented in a second step. In addition to forecasting future traffic, the application of TAPAS provides valuable insights into the responsiveness of certain population groups to innovative drives or vehicles. For this model, it is necessary to include a range of data in order to enable a realistic depiction of individuals. Vehicles and fuels or mobility concepts are expected. This includes spatial and structural data, time use data and information about the use of transport. In the schematic representation of the model (Figure 2), the originally flowing data are marked with light gray oval boxes. The activity-based traffic demand models can be kate 64 gorize. One possibility is differentiation according to the action models used to depict the decision-making behavior of road users (cf. Federal Ministry for Transport, Innovation and Technology 2005: 99f). A distinction must then be made between utility maximization models that are based on the homo oe conomicus and models that back the decisions with certain heuristics in order to enable people to find suboptimal solutions according to their level of information (cf. Timmermans 2001, 28ff.). Whereas with the first models mostly an activity Stadt Region Land – Issue 81 – AMUS 2006 conference proceedings First, a synthetic population for the study area is generated in the model. In order to compensate for these weaknesses and deficits, a microscopic activity-based approach is pursued in the projects mentioned for the small- scale consideration. Activity-based models correspond to the current state of research (cf. Federal Ministry for Transport, Innovation and Technology 2005: 100). The basic idea of this approach is that the chronological sequence of journeys is the result of the sequence of people's activities (Hertkorn 2004: 2). This raises the central questions of what activities people do, when, where, for how long and with whom, as well as what means of transport, if one is used. Added to this is the Pla For this purpose, on the basis of existing population data, it is determined for each traffic cell how many people live there, how many households they are distributed over and what socio-demographic characteristics they have. After that, for Microscopic modeling of passenger transport demand based on time use diaries set is assigned from observed sets, in the second category the activities and locomotion are sequentially expanded into activity programs. Machine Translated by Google
- 3. Which opportunity is specifically chosen to carry out an activity is determined in the model based on users who logged three days' activities, but which no longer had to be consecutive. Furthermore, in 1991/1992 231 assets were collected, but in 2001/2002 every ten minutes. In the second study, the Per On the basis of the ziodemographic and socioeconomic characteristics that were collected in the time budget study, a probability distribution is obtained with which a group of people chooses a specific activity pattern. Concrete activity programs are then assigned to the agents of the synthetic population according to this probability distribution. activity codes, in the study from 2001/2002, however, 281. In the old study, va from 1991/1992, in which 7,200 households took part. Each person in the household has Every five minutes, she notes which activities she has carried out on two consecutive days. Activities relating to unpaid work are differentiated in great detail, so the focus of the new study is in the area of further education and professional qualifications; the activities are broken down accordingly. The activity chains module is therefore being revised with regard to the calculation of transport demand for the base year. Using a combination of sequence and cluster analyses, this data is classified into groups of similar activity patterns. About an additional clustering of people about their so Fig. 2: Flowchart of the TAPAS model (source: own illustration) Christian Varschen, Peter Wagner After determining the distribution of people and Microscopic modeling of passenger transport demand based on time use diaries Stadt Region Land – Issue 81 – AMUS 2006 conference proceedings 65 Households on the traffic cells and on the Mon The data of the second federal German time budget study has been available since autumn 2005, in which 12,600 people took part between 2001 and 2002 dell activity chains to be simulated, it is determined for each activity of a person at which location it takes place. To do this, the model requires corresponding data on the spatial location of potential opportunities (places where activities can be pursued) and their capacity. In addition, a travel time matrix for the area under consideration is required in this module. 5,400 households participated. This led to changes in the design, which were made at the suggestion of EUROSTAT in order to enable a comparison with time budget studies in other European countries. So in 1991/1992 the activities were held every five minutes Machine Translated by Google
- 4. 66 After the locations and means of transport have been selected, the travel times required are assigned with the help of the travel time matrix. This can lead to inconsistencies in the daily routine. For example, a planned visit to the theater after work could result in increased travel times in the evening Fig. 3: Successive choice of mode of transport in TAPAS Stadt Region Land – Issue 81 – AMUS 2006 conference proceedings (Quelle: Hertkorn, 2004, S.89) commuter traffic are endangered since the start of an event is relatively fixed. In order to ensure a certain variability in daily routines, the episodes of a daily schedule are weighted. This weight represents the cost of shifting the start and end times of an activity within a daily schedule. This makes it possible to adjust episodes and travel times to one another using a balancing procedure. If the balance is unsuccessful, either new destinations and modes of transport are chosen until a balance is possible, or if a maximum number of new attempts is reached, a new scheme is used. The means of transport themselves are selected using a CHAID decision tree (Chi-Squared Automatic Interaction Detection), which is based on a subset of the data from the Germany-wide survey “Mobility in Germany 2002” (cf. infas, DIW 2004, infas, DIW 2003). . Microscopic modeling of passenger transport demand based on time use diaries based on the model of intervening opportunities , which assumes that a certain alternative will be rejected with a certain probability. The possible opportunities for this are currently sorted according to their travel time and assigned an attractiveness weight based on ancillary conditions (e.g. occupancy). As a result, potential means of transport must already be considered at this point. In order to arrive at meaningful daily plans, the episodes of a daily routine are also hierarchized. Reference point and thus episodes that have the highest hierarchical level are those that take place at home (see Figure 3). The locations for episodes of the next hierarchical level (e.g. work) are then selected, as well as the corresponding means of transport to get there. The result of this module of destination and mode of transport selection are consistent daily plans of the synthetic population. The source-destination relationships for each person and each activity that causes a journey are therefore in these daily plans. They form the transfer value for a traffic flow simulation to be carried out externally. With the help of this simulation, corresponding indicators can then be used, e.g. B. distances or edge loads are determined. (FEEDBACK) This process is repeated until a person's daily schedule is completely full. This procedure has two decisive advantages: On the one hand, an individual means of transport is used for a complete tour. Since the number of cars in the synthetic population is related to the household, account is also taken of the fact that several people cannot use a car for different purposes at the same time. Christian Varschen, Peter Wagner Machine Translated by Google
- 5. Corresponding adjustments now make sense in two ways. New behaviors due to shifts in the scope and duration of activities can be derived relatively well. For this purpose, changes in the use of time in the last 10 years are analyzed using a comparative data set from the 1991/1992 time use survey of the Federal Statistical Office and then interpolated into the future. technologies happened: With the ubiquitous on the online behavior of people, whereby the four parameters can be determined It is therefore necessary to extend this module in order to be able to simulate future and other behaviors. Several approaches are possible for this. However, this assumption for the total population would be unrealistic. Thus, with a high probability z. B. the traffic behavior of older people Usability of hardware and software have for 2.3 Conclusion The overall behavior of the population will change in the future due to changes in the population structure. Assuming that time use stays the same in certain population groups, no adjustment would be necessary, since the individual in the model – as mentioned above – selects activity patterns using a probability matrix. If there were a change in the structure of the population, a change would automatically take place via this matrix part of the employment activities during travel has increased significantly in importance. The traffic demand model presented was developed to depict an actual state and to take appropriate measures, e.g. g. in the infrastructure sector. The results achieved here were very satisfactory compared to other simulations and surveys (Hertkorn 2004, 110ff.). It therefore seems generally appropriate to calculate future traffic demand. To do this, however, all TAPAS modules must be revised and adapted to the conditions expected in 2030. For example, demographic aging must be taken into account in the synthetic population, and when assigning activity chains, the assumed change in time budgets – as described – must be extrapolated into the future, or new activity categories must be added. People are changing because those who are currently younger are more likely to have a driver's license than those who are currently older. However, this also makes it more likely that this population group will use cars more in the future. However, completely new activity patterns can also develop, as has been the case in recent years due to the ordinance In this model, the development for the actual state is based on observed behavior. As described above, this model uses an activity- based approach based on the analysis of time-use data. In order to be able to map completely new activity patterns, an additional extension is necessary. To do this, the four parameters that describe each activity in TAPAS must be estimated: proportion and extent of use of the activity (new to TAPAS) and the variability of the activity over time in terms of start time and duration. i.e. Each module is backed with representative, current data to ensure the most realistic possible Christian Varschen, Peter Wagner Therefore, the activity patterns available are limited to those contained in the time-use data, which is a severe constraint for forecasting. The corresponding data required for this is generated from surveys. For example, the activity "Use of the Internet" can be generated from your own surveys. Microscopic modeling of passenger transport demand based on time use diaries Stadt Region Land – Issue 81 – AMUS 2006 conference proceedings This activity can only be partially determined from the time use survey. Activities relating to qualification and online shopping are well presented there. It is not possible to determine the extent or proportion of information obtained via the Internet, since this was then only included in generally designated computer use activities. However, these do not necessarily have to take place on the Internet. A survey was now project-related 67 to. All parameters can be calculated directly from this empirical (time use) data, the first two parameters are mean values while the last two are derived from the statistical one 2.2 Expansion of activity categories Variation of the surveys result. In order to be able to estimate all parameters, however, real time use data are necessary, since otherwise the temporal variability of the starting point could not be determined. gen. availability of information and communication Machine Translated by Google
- 6. Modeling for traffic planning. Theoretical, empirical and practical framework conditions. ECTL Working Paper 21, Hamburg. http://www.vsl.tu-harburg.de/ vsl_2/Archiv/wp/wp21.pdf (07/2006) infas, DIW (2004) eitspapiere/1_EMVEM_bericht.pdf and http://www.isv.tugraz.at/veroeffentlichungen/arb 68 change, or new patterns of activity emerge. You can also use destination dialling Widmer P.; Axhausen, K.W., (2001) Christian Varschen, Peter Wagner Possibilities exist, for example, with the activity patterns. By a certain measure takes place a change between the Mus Mobility in Germany 2002 - Continuous survey of traffic behavior. Project no. Federal Ministry of Transport, Innovation and Technology (2005) [ed.] Timmermans, HJP (2001) time use survey. Statistics from A to Z. http:// www.destatis.de/presse/deutsch/abisz/zei questions. The close link with empirical data also increases a high level of confidence Data Needs, Data Collection and Data Quality Requirements of Activity-Based Transport Models. Presented at the International Confer ence on Transport Survey Quality and Innova tion, 24-30 May 1997, Grainau, Germany. http://gulliver.trb.org/ publications/circulars/ec00 Hilty, LM ua (1998) Cologne. http://elib.dlr.de/21014/01/fb_2004- 29_v2.pdf (07/2006) Arentze, T.; Hofmann, F.; Kalfs, N.; Timmermans, H. (1997) In order to make the model scenario-capable and measure-sensitive, it is necessary to include parameters that calculate the influence of measures on traffic behavior. dar Federal Statistical Office (2003) Nevertheless, the further development of the model, the estimation of passenger transport demand with special consideration of specific scientific and political On the other hand, the data requirements of the model represent a limit of what is feasible Hertkorn, G (2004) Stadt Region Land – Issue 81 – AMUS 2006 conference proceedings reliability of forecasts. Appropriate modifications are made so that people who react to measures by choosing other goals for carrying out their activities can be mapped. It is also necessary to show the choice of means of transport and the degree of motorization of the households. Principles of Household Activity Scheduling Behavior. In: Kutter, E., Timmermans, HJP, Jones, PM (eds.): Expertise for the Mobiplan project, research working paper F11, Institute for Urban Planning, RWTH Aachen University. http://www.isb.rwth-aachen.de/ publikationen/F11-Expertisen_Mobiplan.pdf (07/2006) Intelligent infrastructure. Final report EMVEM - Evaluation methods of traffic telematics measures Basic study. Graz University of Technology. http:// www.isv.tugraz.at/veroeffentlichungen/arb 70.0681/2001, Urban traffic research program of the Federal Ministry of Transport, Building and Housing. final report. Kutter, E. (2003) Microscopic modeling of passenger transport demand based on time use diaries 8/workshop_j.pdf (07/2006) infas, DIW (2003) Instruments for the ecological assessment and design of traffic and logistics systems Final report of the research project MOBILE. University of Hamburg and FAW Ulm. http://mobile-www.informatik.uni- hamburg.de/ MOBILE/Abschlussbericht/ Aufbau.html (07/2006) tbudgeterhebung.htm The only limitation that this model currently has is the small-scale representation. In the case of the complex model system, this limitation is due on the one hand to the computing power. A representation of Germany with 82 million individuals would currently be unrealistic. literature to create image. When adapting the model for calculating future transport demand, forecasts – e.g. B. in relation to population development - used. Microscopic modeling of time-dependent traffic demand and traffic flow patterns. German Aerospace Center, Research Report 2004-29. To ensure meaningful microscopic modelling, very small- scale population and structural data would be necessary, with structural data in particular posing a problem. Activity-oriented passenger transport models (preliminary study). Work report on traffic and spatial planning, 70, Institute for traffic planning, transport technology, road and railway construction (IVT), ETH Zurich. https://www.ivt.ethz.ch/vpl/publications/ reports/index/edit/ab70.pdf (07/2006) Mobility in Germany: Results report. Project no. 70.0736/2003, Federal Ministry of Transport, Building and Housing. keitspapiere/1_EMVEM_Anlagenband.pdf (07/2006) Machine Translated by Google
- 7. Dr. Peter Wagner German Aerospace Center in the Helmholtz Association (DLR) Christian Varschen, Peter Wagner Christian Varschen, MA Rutherfordstr. 2, 12489 Berlin Peter.Wagner@dlr.de 69 German Aerospace Center in the Helmholtz Association (DLR) Rutherfordstr. 2, 12489 Berlin Christian.Varschen@dlr.de Stadt Region Land – Issue 81 – AMUS 2006 conference proceedings Microscopic modeling of passenger transport demand based on time use diaries Machine Translated by Google
- 8. Stadt Region Land – Issue 81 – AMUS 2006 conference proceedings 70 Machine Translated by Google