Download to read offline
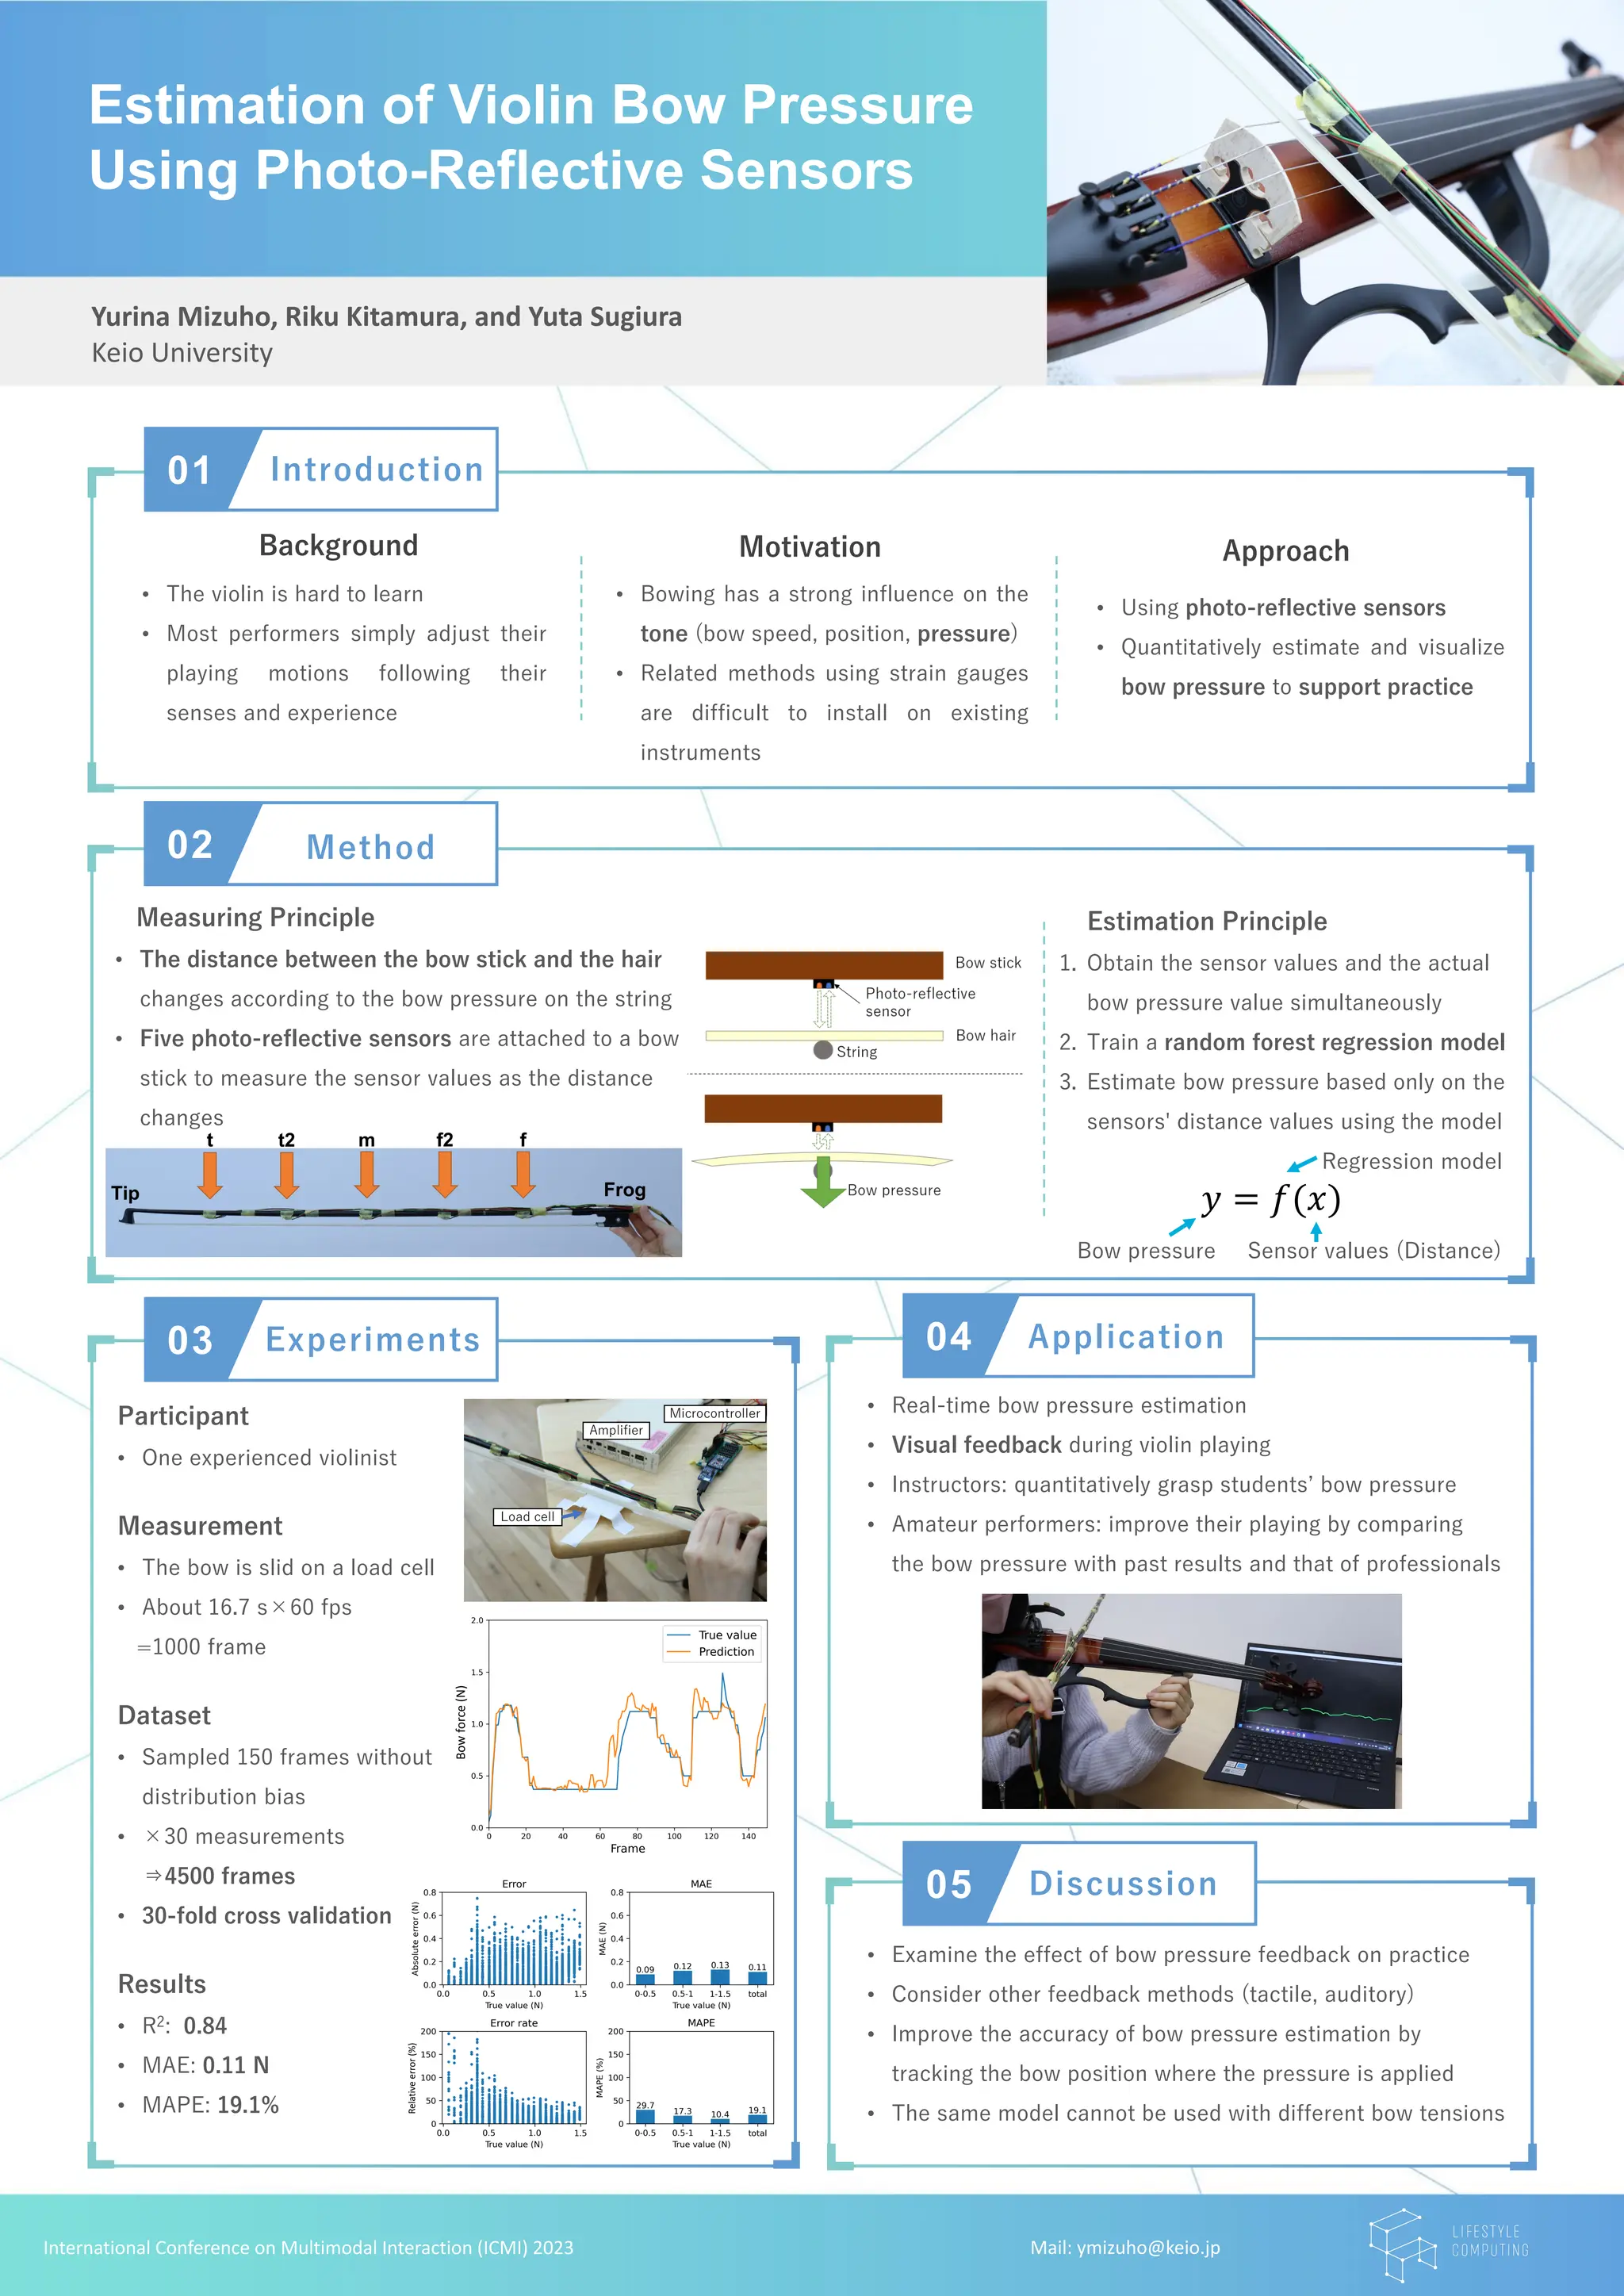

Estimation of Violin Bow Pressure Using Photo-Reflective Sensors presents a method for quantitatively estimating bow pressure during violin playing using photo-reflective sensors attached to the bow. Five sensors measure the distance between the bow stick and hair, which changes with applied pressure. A random forest regression model is trained on sensor distance values and actual pressure measurements to estimate pressure based solely on sensor values. In experiments, the model estimated bow pressure with an R2 of 0.84, MAE of 0.11N, and MAPE of 19.1% when tested on data from an experienced violinist. The goal is to provide visual feedback to support practice by quantifying bow pressure.

![[FIT2025 トップコンファレンスセッション]EarHover: ヒアラブルデバイスにおける音漏れ信号を用いた空中ジェスチャ認識](https://cdn.slidesharecdn.com/ss_thumbnails/fit2025-presentationv2-251006033725-c7651715-thumbnail.jpg?width=640&height=640&fit=bounds)


