Self-Service BI synergies, Tableau Software supplements versus replaces the Microsoft BI Stack. Fast rapid analytics and visualizations, ease of use, any data...
Presented @ DevTeach Conference in Vancouver, BC December 4, 2013
Who am I?
Myname is Stéphane Fréchette
I’m a Database & Business Intelligence Professional and Founder | CEO of
and also a SQL Server MVP. I have a passion for architecting, designing and building
solutions that matter.
Self proclaimed Open Data Hacker/Advocate I founded Gatineau Ouverte a citizen led
initiative which aims to promote open access to civic data of the city of Gatineau.
Twitter: @sfrechette
Blog: stephanefrechette.com
Email: stephanefrechette@ukubu.com
3.
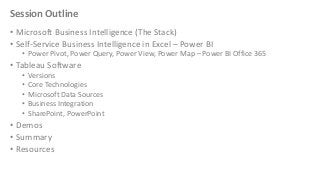
Session Outline
• MicrosoftBusiness Intelligence (The Stack)
• Self-Service Business Intelligence in Excel – Power BI
• Power Pivot, Power Query, Power View, Power Map – Power BI Office 365
• Tableau Software
•
•
•
•
•
Versions
Core Technologies
Microsoft Data Sources
Business Integration
SharePoint, PowerPoint
• Demos
• Summary
• Resources
4.
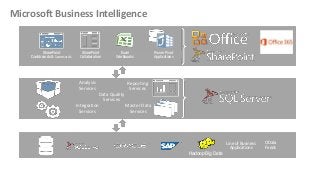
Microsoft Business Intelligence
SharePoint
Dashboards& Scorecards
SharePoint
Collaboration
Analysis
Services
Excel
Workbooks
Power Pivot
Applications
Reporting
Services
Data Quality
Services
Integration
Master Data
Services
Services
Hadoop Big Data
Line of Business
Applications
OData
Feeds
5.
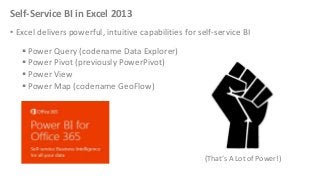
Self-Service BI inExcel 2013
• Excel delivers powerful, intuitive capabilities for self-service BI
Power Query (codename Data Explorer)
Power Pivot (previously PowerPivot)
Power View
Power Map (codename GeoFlow)
(That’s A Lot of Power!)
6.
Power Query
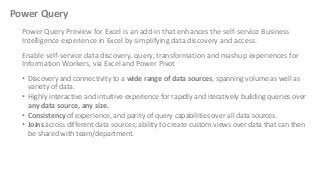
Power QueryPreview for Excel is an add-in that enhances the self-service Business
Intelligence experience in Excel by simplifying data discovery and access.
Enable self-service data discovery, query, transformation and mashup experiences for
Information Workers, via Excel and Power Pivot
• Discovery and connectivity to a wide range of data sources, spanning volume as well as
variety of data.
• Highly interactive and intuitive experience for rapidly and iteratively building queries over
any data source, any size.
• Consistency of experience, and parity of query capabilities over all data sources.
• Joins across different data sources; ability to create custom views over data that can then
be shared with team/department.
7.
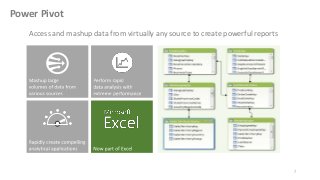
Power Pivot
Access andmashup data from virtually any source to create powerful reports
7
8.
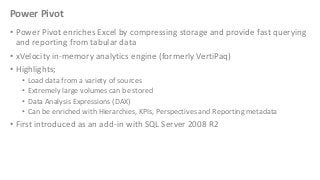
Power Pivot
• PowerPivot enriches Excel by compressing storage and provide fast querying
and reporting from tabular data
• xVelocity in-memory analytics engine (formerly VertiPaq)
• Highlights;
•
•
•
•
Load data from a variety of sources
Extremely large volumes can be stored
Data Analysis Expressions (DAX)
Can be enriched with Hierarchies, KPIs, Perspectives and Reporting metadata
• First introduced as an add-in with SQL Server 2008 R2
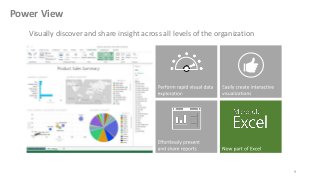
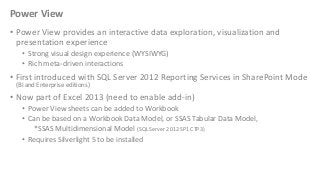
Power View
• PowerView provides an interactive data exploration, visualization and
presentation experience
• Strong visual design experience (WYSIWYG)
• Rich meta-driven interactions
• First introduced with SQL Server 2012 Reporting Services in SharePoint Mode
(BI and Enterprise editions)
• Now part of Excel 2013 (need to enable add-in)
• Power View sheets can be added to Workbook
• Can be based on a Workbook Data Model, or SSAS Tabular Data Model,
*SSAS Multidimensional Model (SQL Server 2012 SP1 CTP3)
• Requires Silverlight 5 to be installed
11.
Power View –Key New Features
• Power View sheets can connect to different data models in one workbook
• Modify the internal Data Model without leaving the Power View sheet
• Power View in Excel Services, Excel Web App and Office 365
• SharePoint Server
•
•
•
•
•
•
Pie charts
Maps
Key Performance Indicators (KPIs)
Hierarchies
Drill up and drill down
Hyperlinks
12.
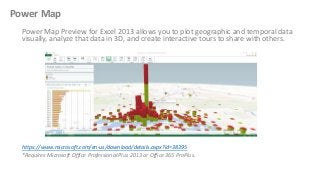
Power Map
Power MapPreview for Excel 2013 allows you to plot geographic and temporal data
visually, analyze that data in 3D, and create interactive tours to share with others.
https://www.microsoft.com/en-us/download/details.aspx?id=38395
*Requires Microsoft Office Professional Plus 2013 or Office 365 ProPlus.
13.
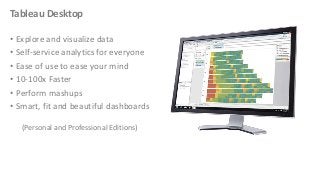
Tableau Desktop
• Exploreand visualize data
• Self-service analytics for everyone
• Ease of use to ease your mind
• 10-100x Faster
• Perform mashups
• Smart, fit and beautiful dashboards
(Personal and Professional Editions)
14.
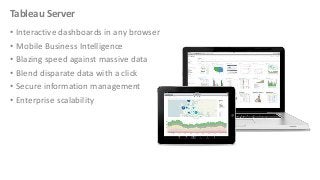
Tableau Server
• Interactivedashboards in any browser
• Mobile Business Intelligence
• Blazing speed against massive data
• Blend disparate data with a click
• Secure information management
• Enterprise scalability
15.
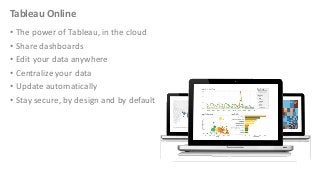
Tableau Online
• Thepower of Tableau, in the cloud
• Share dashboards
• Edit your data anywhere
• Centralize your data
• Update automatically
• Stay secure, by design and by default
16.
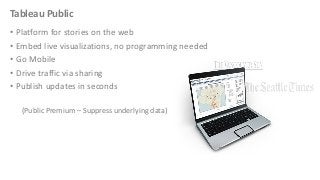
Tableau Public
• Platformfor stories on the web
• Embed live visualizations, no programming needed
• Go Mobile
• Drive traffic via sharing
• Publish updates in seconds
(Public Premium – Suppress underlying data)
17.
Core Technologies
• VizQL– Natively visual-and therefore faster
• Allowing simple drag and drop functions to create sophisticated visualizations
• In-memory Data Engine
• Breakthrough in-memory data engine
• Column storage, architecture aware
• Fast performance with massive data
• Live Query Engine
• Attaches directly to corporate data stores
• Compatible with data of all formats and sizes
18.
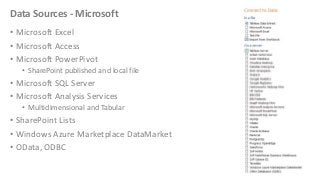
Data Sources -Microsoft
• Microsoft Excel
• Microsoft Access
• Microsoft PowerPivot
• SharePoint published and local file
• Microsoft SQL Server
• Microsoft Analysis Services
• Multidimensional and Tabular
• SharePoint Lists
• Windows Azure Marketplace DataMarket
• OData, ODBC
19.
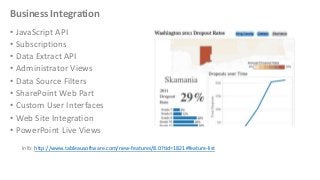
Business Integration
• JavaScriptAPI
• Subscriptions
• Data Extract API
• Administrator Views
• Data Source Filters
• SharePoint Web Part
• Custom User Interfaces
• Web Site Integration
• PowerPoint Live Views
Info: http://www.tableausoftware.com/new-features/8.0?tid=1821#feature-list
20.
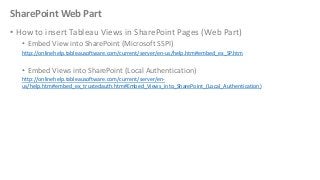
SharePoint Web Part
•How to insert Tableau Views in SharePoint Pages (Web Part)
• Embed View into SharePoint (Microsoft SSPI)
http://onlinehelp.tableausoftware.com/current/server/en-us/help.htm#embed_ex_SP.htm
• Embed Views into SharePoint (Local Authentication)
http://onlinehelp.tableausoftware.com/current/server/enus/help.htm#embed_ex_trustedauth.htm#Embed_Views_into_SharePoint_(Local_Authentication)
21.
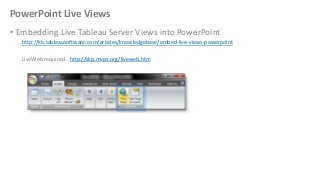
PowerPoint Live Views
•Embedding Live Tableau Server Views into PowerPoint
http://kb.tableausoftware.com/articles/knowledgebase/embed-live-views-powerpoint
LiveWeb required - http://skp.mvps.org/liveweb.htm
Summary
Microsoft
• Self-service BIin Excel, Power BI provides the tools you need to find data, shape
and filter it how you want, model it, and visualize it.
• All users can transform data into insight… with the tools they already know
Tableau
•
•
•
•
True Best of Class Visual Analytics and Dashboards
Mobile BI for a wide variety of mobile device types
Strong Application Integration, APIs and SharePoint Web Part
Supplements, complements instead of replacing Microsoft…
Try them yourself today!
24.
Resources
• Examples –Connecting to Data Sources
http://onlinehelp.tableausoftware.com/current/pro/online/en-us/help.html#exampleconnections_overview.html
• Custom SQL and Parameters
http://onlinehelp.tableausoftware.com/v8.0/public/online/en-us/customsql.html
• Tableau Dashboard Actions
http://kb.tableausoftware.com/articles/knowledgebase/combining-sheet-links-and-dashboards
• Embedding Tableau Views
http://onlinehelp.tableausoftware.com/current/server/en-us/embed.htm
• Training & Tutorials
http://www.tableausoftware.com/learn/training


![Vibe Coding vs. Spec-Driven Development [Free Meetup]](https://cdn.slidesharecdn.com/ss_thumbnails/vibecodingvsspecdrivendevelopment-251209105622-43f455e7-thumbnail.jpg?width=640&height=640&fit=bounds)


