Successfully reported this slideshow.
Your SlideShare is downloading. ×

ONS Economic Forum - 8 September 2022

Ad
Ad
Ad
Ad
Ad
Ad
Ad
Ad
Ad
Ad
Ad
Loading in …3
×

Check these out next

1 of 61 Ad

ONS Economic Forum - 8 September 2022

Download to read offline
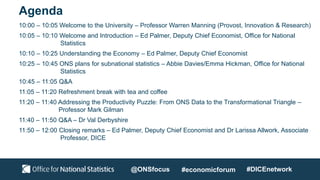
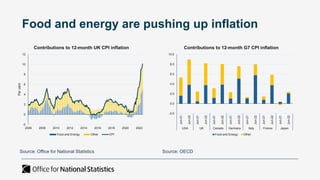
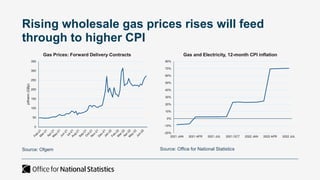
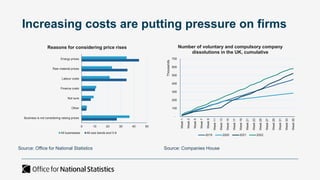
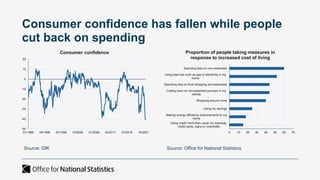
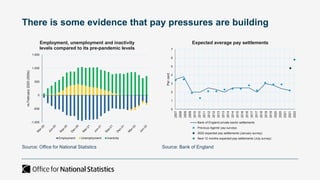
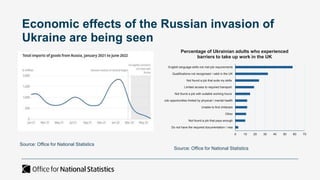
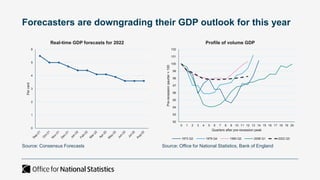
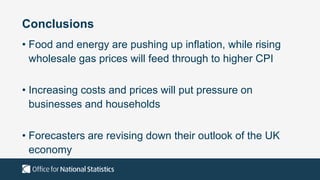
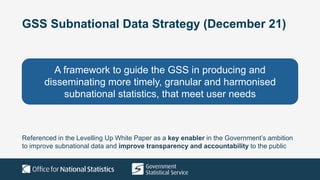
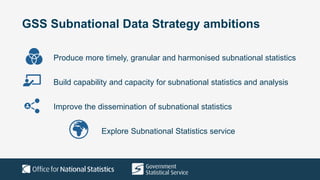
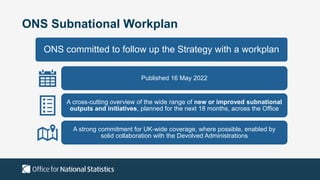
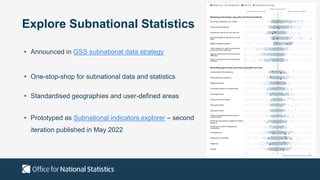
These are the slides presented at the Economic Forum on 8 September 2022.

The ONS Regional Economic Forum will present the current state of the UK economy and present data and analysis for your area at a local level.

Presentations include:

Understanding the UK Economy.

Showcase exciting developments supporting the levelling up agenda and work on sub-national data.

Addressing the productivity puzzle: from ONS data to the Transformational Triangle.

Advertisement
Advertisement

More Related Content

Similar to ONS Economic Forum - 8 September 2022 (20)

More from Office for National Statistics (16)

Advertisement

Recently uploaded (20)

ONS Economic Forum - 8 September 2022

  1. 1. Working in collaboration with Economic Forum 8 September 2022
  2. 2. Provost, Innovation & Research @ONSfocus #economicforum Welcome to the University of Derby Professor Warren Manning #DICEnetwork
  3. 3. Deputy Chief Economist Economic and Microdata Insights Office for National Statistics @ONSfocus #economicforum Welcome and Introduction Ed Palmer #DICEnetwork
  4. 4. Agenda 10:00 – 10:05 Welcome to the University – Professor Warren Manning (Provost, Innovation & Research) 10:05 – 10:10 Welcome and Introduction – Ed Palmer, Deputy Chief Economist, Office for National Statistics 10:10 – 10:25 Understanding the Economy – Ed Palmer, Deputy Chief Economist 10:25 – 10:45 ONS plans for subnational statistics – Abbie Davies/Emma Hickman, Office for National Statistics 10:45 – 11:05 Q&A 11:05 – 11:20 Refreshment break with tea and coffee 11:20 – 11:40 Addressing the Productivity Puzzle: From ONS Data to the Transformational Triangle – Professor Mark Gilman 11:40 – 11:50 Q&A – Dr Val Derbyshire 11:50 – 12:00 Closing remarks – Ed Palmer, Deputy Chief Economist and Dr Larissa Allwork, Associate Professor, DICE @ONSfocus #economicforum #DICEnetwork
  5. 5. Deputy Chief Economist Economic and Microdata Insights Office for National Statistics State of the Economy September 2022 Ed Palmer @ONSfocus #economicforum #DICEnetwork
  6. 6. Food and energy are pushing up inflation Source: Office for National Statistics Source: OECD -2 0 2 4 6 8 10 12 2006 2008 2010 2012 2014 2016 2018 2020 2022 Per cent Contributions to 12-month UK CPI inflation Food and Energy Other CPI -2.0 0.0 2.0 4.0 6.0 8.0 10.0 Jun-21 Jun-22 Jun-21 Jun-22 Jun-21 Jun-22 Jun-21 Jun-22 Jun-21 Jun-22 Jun-21 Jun-22 Jun-21 Jun-22 USA UK Canada Germany Italy France Japan Contributions to 12-month G7 CPI inflation Food and Energy Other
  7. 7. Rising wholesale gas prices rises will feed through to higher CPI 0 50 100 150 200 250 300 350 p/therm (GBp) Gas Prices: Forward Delivery Contracts -20% -10% 0% 10% 20% 30% 40% 50% 60% 70% 80% 2021 JAN 2021 APR 2021 JUL 2021 OCT 2022 JAN 2022 APR 2022 JUL Gas and Electricity, 12-month CPI inflation Source: Ofgem Source: Office for National Statistics
  8. 8. Increasing costs are putting pressure on firms Source: Companies House Source: Office for National Statistics 0 10 20 30 40 50 Business is not considering raising prices Other Not sure Finance costs Labour costs Raw material prices Energy prices Reasons for considering price rises All businesses All size bands excl 0-9 - 100 200 300 400 500 600 700 Week 1 Week 3 Week 5 Week 7 Week 9 Week 11 Week 13 Week 15 Week 17 Week 19 Week 21 Week 23 Week 25 Week 27 Week 29 Week 31 Week 33 Week 35 Thousands Number of voluntary and compulsory company dissolutions in the UK, cumulative 2019 2020 2021 2022
  9. 9. Consumer confidence has fallen while people cut back on spending Source: Office for National Statistics Source: GfK -50 -40 -30 -20 -10 0 10 20 01/1985 04/1990 07/1995 10/2000 01/2006 04/2011 07/2016 10/2021 Consumer confidence 0 10 20 30 40 50 60 70 Using credit more than usual, for example, credit cards, loans or overdrafts Making energy efficiency improvements to my home Using my savings Shopping around more Cutting back on non-essential journeys in my vehicle Spending less on food shopping and essentials Using less fuel such as gas or electricity in my home Spending less on non-essentials Proportion of people taking measures in response to increased cost of living
  10. 10. There is some evidence that pay pressures are building -1,000 -500 0 500 1,000 1,500 vs February 2020 (000s) Employment, unemployment and inactivity levels compared to its pre-pandemic levels Employment Unemployment Inactivity Source: Office for National Statistics 0 1 2 3 4 5 6 7 2007 2008 2009 2009 2010 2010 2011 2012 2012 2013 2013 2014 2014 2015 2016 2016 2017 2017 2018 2019 2019 2020 2020 2021 2021 2022 Per cent Expected average pay settlements Bank of England private sector settlements Previous Agents' pay surveys 2022 expected pay settlements (January survey) Next 12 months expected pay settlements (July survey) Source: Bank of England
  11. 11. Economic effects of the Russian invasion of Ukraine are being seen Source: Office for National Statistics Source: Office for National Statistics 0 10 20 30 40 50 60 70 Do not have the required documentation / visa Not found a job that pays enough Other Unable to find childcare Job opportunities limited by physical / mental health Not found a job with suitable working hours Limited access to required transport Not found a job that suits my skills Qualifications not recognised / valid in the UK English language skills not met job requirements Percentage of Ukrainian adults who experienced barriers to take up work in the UK
  12. 12. Forecasters are downgrading their GDP outlook for this year 0 1 2 3 4 5 6 Per cent Real-time GDP forecasts for 2022 92 93 94 95 96 97 98 99 100 101 102 0 1 2 3 4 5 6 7 8 9 10 11 12 13 14 15 16 17 18 19 20 Pre-recession qaurter = 100 Quarters after pre-recession peak Profile of volume GDP 1973 Q2 1979 Q4 1990 Q2 2008 Q1 2022 Q3 Source: Office for National Statistics, Bank of England Source: Consensus Forecasts
  13. 13. Conclusions • Food and energy are pushing up inflation, while rising wholesale gas prices will feed through to higher CPI • Increasing costs and prices will put pressure on businesses and households • Forecasters are revising down their outlook of the UK economy
  14. 14. ONS Plans for Subnational Statistics Deputy Director Subnational Statistics and Analysis Division Abbie Davies Lead Analyst, ONS Local Office for National Statistics Emma Hickman @ONSfocus #economicforum #DICEnetwork
  15. 15. Contents • Strategy and workplan • Timely, granular subnational statistics and insight • Improved dissemination • Economic trends in the East Midlands
  16. 16. Strategy and workplan
  17. 17. GSS Subnational Data Strategy (December 21) A framework to guide the GSS in producing and disseminating more timely, granular and harmonised subnational statistics, that meet user needs Referenced in the Levelling Up White Paper as a key enabler in the Government’s ambition to improve subnational data and improve transparency and accountability to the public
  18. 18. GSS Subnational Data Strategy ambitions Produce more timely, granular and harmonised subnational statistics Build capability and capacity for subnational statistics and analysis Improve the dissemination of subnational statistics Explore Subnational Statistics service
  19. 19. ONS Subnational Workplan ONS committed to follow up the Strategy with a workplan Published 16 May 2022 A cross-cutting overview of the wide range of new or improved subnational outputs and initiatives, planned for the next 18 months, across the Office A strong commitment for UK-wide coverage, where possible, enabled by solid collaboration with the Devolved Administrations
  20. 20. Timely, granular subnational statistics and insight
  21. 21. Model-based early estimates of regional GVA • Started publishing model-based quarterly estimates of regional GVA from October 2021 onwards • Early indication of quarterly GDP, published 5 months in advance Source
  22. 22. Productivity in towns and travel to work areas • Experimental labour productivity data for TTWAs and towns made available for the first time in December 2021 • Complements existing annual subregional productivity release Source
  23. 23. Disaggregating annual subnational GVA to lower levels of geography • As part of the ONS strategy to provide more granular data to our users • Experimental statistics using granular geographies as building blocks to derive GVA for flexible geographies • Improve our understanding of the local economy • Provisional publication for second version Autumn 2022 Source
  24. 24. Improved Dissemination 21 September 2022
  25. 25. Explore Subnational Statistics • Announced in GSS subnational data strategy • One-stop-shop for subnational data and statistics • Standardised geographies and user-defined areas • Prototyped as Subnational indicators explorer – second iteration published in May 2022
  26. 26. ONS Local • Commitment outlined in the white paper • A statistical advisory service for local leaders, with dedicated analysts based in hubs across the UK, ensuring they have access to data, statistics and analysis to support decision making • Analysts based in each region, drawing on support and resource from across the office to act as a window onto wider ONS developments and capability • First iteration of service to be launched this Winter
  27. 27. Service offer Analytical Teams will provide resource to scope and support analytical projects to provide statistical insights that support decision making Strategic Using our unique position within central government to understand, identify, and align priorities for both local and central decision makers, alongside capturing user needs Data Connecting local users to key government datasets, whilst also looking for opportunities where local data can add value to central decision making Network Establishing local partnerships with a range of external stakeholders to bring together regional expertise, share knowledge, and draw on research capability
  28. 28. Economic trends in the East Midlands
  29. 29. • East Midlands showed 28% growth in GVA in 2020 compared to 1998, below the UK average of 40% • Within the region, Leicester showed the highest level of growth in GVA, whilst Derby showed the least GVA 90 100 110 120 130 140 150 160 170 180 1998 1999 2000 2001 2002 2003 2004 2005 2006 2007 2008 2009 2010 2011 2012 2013 2014 2015 2016 2017 2018 2019 2020 Growth of GVA, split by ITL3 regions Derby East Derbyshire South and West Derbyshire Nottingham North Nottinghamshire South Nottinghamshire Leicester Leicestershire CC and Rutland West Northamptonshire Source
  30. 30. Productivity and industry structure • Productivity in the east of the region is similar to the UK average, with some LADs in the west showing higher than average levels • This is part of a belt of high productivity stretching from the South West towards Birmingham • Employment in Medium Technology Manufacturing follows a similar pattern Spatial distribution of industries across TTWAs using location quotients, 2019 Source Source
  31. 31. Real-time Economic Indicators • The number of job adverts in the East Midlands dropped in line with the UK average at the beginning of the pandemic, but increased more quickly over Summer 2020 and throughout 2021 • In July 2022, East Midlands job adverts were roughly in line with the UK average • This could be driven by strong growth in the Transport and Storage sector Source
  32. 32. GDHI Region GDHI per head, 2019 East Midlands £18,635 West Northamptonshire £22,227 South Nottinghamshire £20,432 Leicestershire CC and Rutland £20,162 South and West Derbyshire £20,158 North Northamptonshire £19,666 Lincolnshire £18,783 North Nottinghamshire £18,225 East Derbyshire £17,405 Derby £16,793 Leicester £13,802 Nottingham £13,381 • GDHI per head in the East Midlands is comparative to nearby regions, although slightly lower than the UK average • There is significant variation in this measure across the region Source
  33. 33. GDHI
  34. 34. Housing affordability Using annual data on house prices and annual earning to calculate affordability ratios for national and subnational geographies: • At a local level, house prices grew faster than earnings in 91% of local authority districts, leading to a reduction in housing affordability in these areas. • Average house prices in Derby were 5.08 times average earnings • Interactive tools available to explore and compare data. Derby Source
  35. 35. Thank you for listening
  36. 36. Q&A
  37. 37. Break
  38. 38. University of Derby Addressing the Productivity Puzzle: From ONS Data to the Transformational Triangle Professor Mark Gilman @ONSfocus #economicforum #DICEnetwork
  39. 39. OUR MOTIVATION To understand the reasons behind the low productivity puzzle that prevails in the UK since the 2008 Global Financial Crisis and its link to SME growth processes  How has the SME sector in the West Midlands been developing over the last 20 years? (Our report 1 - “The SME Drag Effect in the West Midlands Economy”,)  What drives or hinders the SME growth? (Our report 2 - “Understanding the SME Drag Effect in the West Midlands Economy – Findings of PSP Growth Diagnostic (Survey)”)  What can be done to stimulate SME growth, particularly after the Covid- 19 pandemic? (Our report 3)
  40. 40. THE WEST MIDLANDS ECONOMY: SME ‘DRAG EFFECT’ • The SME sector has been experiencing mixed fortunes • An increasing share of employment but declining share of turnover the last decade. • A deepening productivity problem in micro and small enterprises in the West Midlands (enterprises with 1 to 49 employees) • More births but even more deaths particularly in 2018, leading to an overall shrinkage of SMEs in the West Midlands in 2019 • The West Midlands share of HGFs is still below the UK average and fluctuating from year to year without ensuring a steady impact on productivity, as would be expected from HGFs. Company size 2010 2011 2012 2013 2014 2015 2016 2017 2018 2019 SMEs in the private sector None 71.3 70.5 72.4 73.8 74.8 73.4 73.9 74.5 73.7 75.5 1-49 27.9 28.6 26.8 25.3 24.5 25.8 25.3 24.8 25.6 23.8 50-249 0.7 0.7 0.7 0.7 0.6 0.7 0.7 0.6 0.6 0.6 Total (0-249) 99.9 99.8 99.9 99.8 99.9 99.9 99.9 99.9 99.9 99.9 Employment None 14.8 13.7 15.1 15.3 16.2 15.2 15.4 16.3 15.7 16.7 1-49 33.0 31.7 31.4 30.6 30.4 30.7 30.4 30.9 30.7 29.7 50-249 12.2 12.7 12.4 12.4 12.1 12.2 12.3 11.9 11.8 11.8 Total (0-249) 60.0 58.1 58.9 58.3 58.7 58.1 58.1 59.1 58.2 58.2 Turnover None 7.4 6.9 7.1 6.4 6.6 5.5 6.0 6.9 6.5 6.8 1-49 30.7 29.3 29.6 27.7 26.1 22.5 23.8 26.4 27.7 24.6 50-249 14.9 15.3 14.6 14.0 12.7 11.6 12.1 13.1 12.3 12.5 Total (0-249) 53.0 51.5 51.3 48.1 45.4 39.6 41.9 46.4 46.5 43.9 Private sector SMEs, employment and turnover in the West Midlands, by their size, 2010 -2019, % Source: ONS, Business Population Estimates, 2019
  41. 41. PSP DIAGNOSTIC: To determine YOUR strengths and weaknesses & guide YOU in developing your company strategies for growth CHARACTERISTI CS EXTERNAL RELATIONS PERFORMANCE & PLANNING ADDED VALUE KNOWLEDGE & RESOURCE MANAGEMENT Characteristics Markets & Competitio n Supply Chain Growth Manageme nt & Strategy Performanc e Measureme nt Innovatio n CSR Technolo gy HR Manageme nt Training & Developme nt Financ e & Fundin g IAG Age Market distribution Collaboratio ns Growth trend (3 years) Manageme nt Performanc e measures Product innovatio n CSR Project s Technolo gy utilisation Investment planning Dedicated budget Financ e source s Membersh ips Sector Export locations Collaborativ e partner Growth expectatio ns Strategic Plan Process innovatio n Investme nt planning HR responsibil ity Training days Advice sought Ownership International sales method Customer type Strategic issues Obstacle s HR practices Training provider Advice source Management Length international trading Supplier type Strategy ownership Employee pay Specific skill developme nt Networks involveme nt Experience Market conditions Employee engageme nt Benefit of involveme nt Size No of competitors Working
  42. 42. UNDERSTANDING THE ‘DRAG EFFECT’ Performance and Planning (I) GROWTH How SMEs performed over the three years • SMEs are more likely to experience rapid or steady growth in sales revenues than profits or employment. • SMEs seeking growth in profits are more likely to experience rapid or steady decline. A misconception of growth  Narrowing down ‘firm’ growth to ‘market’ growth An over-emphasis on costs and sales can detract from addressing wider growth issues such as productivity and efficiency! How SMEs perceive future growth factors • Ability to identify ‘future’ growth factors and barriers, but not the ‘past’ promoters and barriers. • Difficulty to learn from past strengths and weaknesses and reflect them on their future performance. A lack of motivation or ability to analyse past performance can misguide future growth aspirations! 10% 12% 17% 20% 27% 33% 63% 46% 41% 4% 10% 5% Employment Profit Sales Revenue Grown rapidly on average by more than 20% per annum Grown steadily on average by 5-20% per annum Remained the same varying by +/-5% per annum Reduced steadily on average by 5-20% per annum Reduced sharply on average by more than 20% per annum
  43. 43. STRATEGIC TRANSFORMATION MINDSET TRANSFORMATION DIGITAL TRANSFORMATION Growing your business for the future TRANSFORMATION TRIANGLE
  44. 44. MINDSET TRANSFORMATION Do you effectively apply management and leadership skills into practice? Do you understand what strategy entails? To what extent do you attach importance to technology use in your business? How important for your business to collect and utilise information and advice for improved performance What does ‘growth’ mean for your organisation?
  45. 45. MINDSET TRANSFORMATION Inclusiveness Developing strategy and sharing it with managers and employees Approach to HR Change in organisation al culture to create motivated and engaged workforce Resilience Failures as learning opportunities , e.g. successive ventures The way you observe growth barriers Challenges as opportunities Openness to radical changes Awareness of challenges MINDSET TRANSFORMATION Changing the mindset of not only the managers but also the employees
  46. 46. Networking Strategy Innovation Strategy Human Resource Strategy Market Strategy Corporate Social Responsibility Strategy STRATEGIC TRANSFORMATION Business Strategy Comprehensive Growth Strategy Not only inclusive but also an integrated approach to strategic areas within the boundaries of the firm.
  47. 47. Long term perspective to Strategy and Planning with a focus on internal capability development STRATEGIC TRANSFORMATION Is your management of finance and investments efficient? Do you make use of performance measures to develop appropriate and efficacious strategies for the relevant business operations? How good are you in transforming the abstract notion of innovation (what innovation really is) into concrete products and services (how it is managed)? How do you strengthen your Human Resources? Have you thought of empowering your employees by investing in their training and development? What kind of plans do you have in place for creating effective competitive advantage? Have you considered or operationalised an expansion into international markets? Have you successfully convert your ‘supply chain’ to a ‘value chain’ to effectively cooperate with your suppliers and customers?
  48. 48. CHARACTERISTICS OF A COMPREHENSIVE SME STRATEGY THAT BRINGS ABOUT GROWTH BUSINESS STRATEGY Written strategy Staff inclusion in strategy planning Wider coverage of business areas than market development Communication of strategy within the SME A mix of financial sources to fund investments and arising opportunities Data collection on wider areas than accounting MARKET STRATEGY Quality and differentiation strategy (niche products and personalization of services) Competition (as a means for growth, not the target itself) New markets Internationalisation to wider markets Value chain HUMAN RESOURCE STRATEGY Long term view on HR as a source of competitive advantage: -value HR practices; -commit dedicated resources; -strategic investment to HR Formal pay system Balanced average working hours (no excessive overtime) A variety of forms of communication with employees NETWORKING STRATEGY Long-term view to networking: Purposeful collaboration (not the number of but the content of collaborations) Aim at accessing different sources of knowledge Horizontal collaborations with Higher Education Institutes Holistic approach to market collaborations: Suppliers AND customers together INNOVATION STRATEGY Emphasis on knowledge and innovation management Lack of qualified personnel differentiating obstacle to innovation Increased use of technologies Purposeful use of technology (integrating technology into wider firm operations as well as infrastructural) Digitalisation of Value Chain operations More service innovations than product, and process innovations in supporting activities than manuf and logistics CSR STRATEGY Actual implementation of influential CSR initiatives STRATEGIC TRANSFORMATION
  49. 49. DIGITAL TRANSFORMATION Integrating business operations digitally (e.g. Value Chain operations) Training and engagement of all employees Data analysis – ability to measure wider indicators Data collection on a broader range of performance measures Technology adoption for efficiency improvement DIGITAL TRANSFORMATION
  50. 50. Mindset Transformation Employees Inclusiveness Approaches to HR Resilience Challenges as opportunities Openness to change Understanding Human Capitals role in building competitive advantage (leaders & management) Empowering employees: Purpose, Mastery & Autonomy Creating competitive advantage Key components of? Understanding the roles of management and leadership. Understanding growth – what does it really entail (For individuals, organisations and economy)? Understanding your role in building competitive advantage (employees) Engaging employees Managing knowledge Your job description on a page: transitioning to a new role The art of delegation: leaders and employees utilising information and advice for improved performance Resistance, power and control Role of information and consultation Building effective culture Embracing crisis and change Environmental scanning Understanding how to build effective Business/university interactions
  51. 51. Strategy Transformation Business Innovation HR Market Network CSR Written strategy Understanding how to build strategy and become more strategic Emphasis on knowledge and innovation management HR as a source of competitive advantage: HPWS Quality and differentiation strategy (niche products and personalization of services) Porter? Long-term view to networking: effectively cooperating with their suppliers and customers, Actual implementation of influential CSR initiatives Understanding Corporate Social Responsibility Staff inclusion in strategy planning Lack of qualified personnel differentiating obstacle to innovation Value adding HR practices; - dedicated resources; -strategic investment to HR Competition (as a means for growth, not the target itself) Purposeful collaboration (not the number of but the content of collaborations) Community – Develop local talent, support voluntary and philanthropic work Wider coverage of business areas than market development Increased use of technologies Formal pay system New markets Aim at accessing different sources of knowledge Workforce – Good recruitment and development, work-life balance, trust, etc. Communication of strategy - Internal & external Purposeful use of technology (integrating technology into wider firm operations as well as infrastructural) Recruitment and selection Internationalisation to wider markets operationalising expansion into international markets, Horizontal collaborations with Higher Education Institutes Marketplace – right products, service, delivery, etc. Understanding Financial Capital. Understanding the importance of efficient management of finance and investments, A mix of financial sources to fund investments Digitalisation of Value Chain operations Balanced average working hours (no excessive overtime) Value chain Understanding relational characteristics and developing the value chain. converting their supply chain to value chain, Holistic approach to market collaborations: Suppliers AND customers together Environment – Resources, waste, green, etc. Understanding Performance measurement and management. introducing a variety of performance measures, and making appropriate use of them Product, service and process innovations in supporting activities (and logistics ) Involvement & communication Understanding markets and competition Stakeholder engagement Human Rights – Fair wages, non-discriminatory practices, clean water, etc Product/service segmentation What is Innovation Value proposition Customer
  52. 52. Digital transformation Efficiency Integration of operational processes Development Data Collection Data Analysis Technology for efficiency improvements (productivity) Value Chain integration Skills and capabilities Broader integrated measures Ability to measure wider indicators comprehending the importance of technology use for their business and integrating the right technologies for their business into their operations Value proposition: product offering, market segmentation, revenue model Customer relationship management Innovation Problem solving Infrastructure management Value architecture: sensing, creation, distribution, capture Continuous improvement
  53. 53. THANK YOU ANY QUESTIONS?
  54. 54. Q&A
  55. 55. Deputy Chief Economist Economic and Microdata Insights Office for National Statistics Dr Larissa Allwork Associate Professor DICE Closing remarks Ed Palmer @ONSfocus #economicforum #DICEnetwork
  56. 56. Sustainable Development Goals (SDGs) You can set-up your own site to report SDG-related data using Open SDG • Open source • Free to reuse • Collaborative Open SDG The global community working in partnership for SDG reporting • Fully Customisable • Data Visualisation • Machine readable data • UK – sdgdata.gov.uk • Bristol • Liverpool • Blackpool (early stages) SustainableDevelopment@ons.gov.uk email the team: @ONSfocus #economicforum #DICEnetwork
  57. 57. Forthcoming ONS economic analysis 13 September 2022 – Labour Market Theme day 14 September 2022 – Prices Theme day 20 September 2022 – “Green jobs”, current and upcoming work 27 September 2022 – Labour demand indicators by profession in the UK 30 September 2022 – Quarterly National Accounts All information on upcoming analysis can be found via the ONS website @ONSfocus #economicforum #DICEnetwork
  58. 58. Dates for your diary 12 September 2022 – ONS Economic Forum 7 October 2022 – ESCoE - Modelling an Evolving Economy Workshop Further details on the above events will be published at ons.gov.uk/economicevents @ONSfocus #economicforum #DICEnetwork
  59. 59. Feedback For us to continue to improve and shape future Economic Forums and events, we would appreciate if you took some time to fill in our short survey. You can access the survey via the QR code below: @ONSfocus #economicforum #DICEnetwork
  60. 60. Thank you for attending the Economic Forum You can keep up to date on all up coming events via ons.gov.uk/economicevents If you would like to ask a question or provide any feedback, please do so via economic.engagement@ons.gov.uk
  61. 61. DICE To find out more about DICE, please see this webpage: https://www.derby.ac.uk/research/how- research-is-managed/derby-impact-collaboration- engagement-network/ To Tweet about today’s event: #DICEnetwork and #economicforum

×