
Recommended
Recommended
More Related Content
Similar to 2 wks3 wksGenerateQuoteSQOCustomerContact Cust.docx
Similar to 2 wks3 wksGenerateQuoteSQOCustomerContact Cust.docx (20)
More from standfordabbot
More from standfordabbot (20)
Recently uploaded
Recently uploaded (20)
2 wks3 wksGenerateQuoteSQOCustomerContact Cust.docx
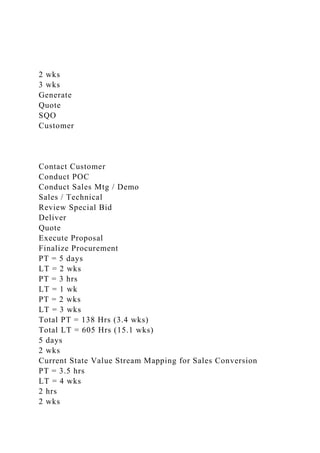
- 1. 2 wks 3 wks Generate Quote SQO Customer Contact Customer Conduct POC Conduct Sales Mtg / Demo Sales / Technical Review Special Bid Deliver Quote Execute Proposal Finalize Procurement PT = 5 days LT = 2 wks PT = 3 hrs LT = 1 wk PT = 2 wks LT = 3 wks Total PT = 138 Hrs (3.4 wks) Total LT = 605 Hrs (15.1 wks) 5 days 2 wks Current State Value Stream Mapping for Sales Conversion PT = 3.5 hrs LT = 4 wks 2 hrs 2 wks
- 2. 3.5 hrs 4 wks 1 2 3 4 5 6a 7 8 9 PT = 2 hrs LT = 2 wks Sales Technical Pricers Review Standard Bid PT = 20 min LT = 1 hr 6b Pricers Sales PT = 3 hrs LT = 3 hrs Sales Sales PT = 2 hrs LT = 2 hrs PT = 4 hrs LT = 3 wks Sales
- 4. 3 hrs 3 hrs 4 hrs 3 wks Current State Metrics for Sales Conversion Overview of the Process The Sales Conversion Process begins with contact with the customer and includes the activities to understand their requirements, present a solution (both in concept and to prove out), provide pricing proposals through to procuring the software and executing a PO. The Sales Process has not been traditionally included when mapping operations within an organization; thus, there are no defined metrics for the steps of the process. The PT and LT times shown are anecdotal and should be more formally assessed by “going to the gemba.” Challenges As a workforce, Sales reps are likely one of the hardest groups to map as many Sales Reps would argue that what they do is more art than science. Typically, Sales Reps have not been required to account for their time to any detail. This makes the Sales Process challenging in that there have not been any true time studies to use a foundation. The Sales Process needs to be studied at the process level, not at an individual customer level. There are categories of waste within the areas of waiting, extra processing, correction, etc. Much of the process is manual, and likely to continue to be manual, which means you are relying on human action which is prone to error, distraction, etc. This is further support to study in detail. Variability is a third challenge. The variability across reps (personalities and skills), customers, industries, and geographic
- 5. locations makes it harder to determine what is value add and what is wasteful which will be critical in establishing a process on a large, repeatable scale. There is also variability in the execution of the process (what steps are taken, in what order, etc.) which causes variability in the process times. Bottlenecks Within Sales, the customer is heavily involved. There is a lot of external wait time spent waiting for the customer to respond, be available, etc. As an example, the Meeting noted is on average 2 hours; however, the elapsed time is 2 weeks. This time is waiting for the customer to respond and to find available time on their calendar that matches your own. Another example is the procurement process. At this point, the Sales Rep is waiting for the customer to complete their own procurement process. These are not controllable within the Sales Process and therefore contributes to the longer lead times. The primary internal bottleneck has to do with the quote/proposal generation which is a very manual process. The Sales Rep creates the quote, submits it to a Pricer and then the Pricer reviews it to make sure that it meets specifications. If there is inaccurate or missing information, he will return the quote to be fixed. If not, he will process it and the quote will be generated and sent to the rep for customer delivery. For a pricer, the review can be as little as 10 minutes to days of back and forth with the Rep. There is variability in the types of bids being reviewed as well as volume due to time (end of month, end of quarter, etc.). It is not uncommon to have over 10 bids in their queue at a time and frequently working 3-5 bids at the same time. This is an area that contributes to the long delays but also is an area that could benefit from analysis to determine value add vs. wasteful steps. Current State Highlights image1.png
- 6. image2.jpg image3.png Individual Case Study Codification Assignment Instructions: I. The case study for this codification exercise, Dynamic Divestures: A Codification Exercise on the Reporting of Discontinue Operations, is posted on Canvas II. 15 pages (not including title and reference pages) and single space. Include pages numbers. III. To complete this assignment: 1. Consider the facts presented for each company within the case 2. Consult the FASB Accounting Standards Codification (ASC) for guidance on answering the questions listed below 3. Include FASB ASC citations where relevant 4. Your answers to each questions should be in the format of an essay answer. In other words, merely stating a FASB ASC section or writing you answers as bullet points is not sufficient. 5. The total possible points for this assignment is 200 points. Below is the total points for each question is listed. The specific rubric for each question is posted on Canvas. Also, a maximum of 29 points is for writing style, organization, spelling, and grammar. IV. Questions to be answered in this assignment: 1. (9 Points): Why report discontinued operations? 2. (9 Points): a. What is a component of an entity? b. What are a group of components of an entity? 3. (27 Points): For each of the entities below, is the sale or
- 7. disposition of business reporting a strategy shift? a. (9 Points): ZD Consulting Services b. (9 Points: Hope Industries c. (9 Points): AM Mining Operations 4. (9 Points): Is AM Mining Operations held for sale or use? 5. (9 Points): Is AM Mining Operations part of discontinuing operations even though not sold? 6. (9 Points): How are discontinuing operations to be reported on an income statement? 7. (9 Points): How are discontinuing operations reported on a balance sheet? 8. (9 Points): What should notes to discontinuing operations contain? 9. (9 Points): How should gain or loss on sale of PPE be computed? 10. (36 Points): a. How should impairment losses on PPE held for use be computed? b. What does not make sense? 11. (9 Points): When test for impairment loss assets held for use? 12. (9 Points): How do you compute impairment losses assets held for sale? 13. (9 Points): How should gains or losses on sale of assets not part of discontinued operations be reported? 14. (9 Points): How should impairment losses on assets that are not part of discontinuing operations be reported on the income statement? If held and used? 1 MAN 4504 Operational Decision Making
- 8. Insert Date Insert Name Florida State College at Jacksonville Value Stream Mapping and Analysis: 1 Current State Value Stream Map Title: : Customer Insert LT Insert PT Insert LT Insert PT Insert LT Insert PT Insert LT Insert PT Insert LT Insert PT Insert LT Insert PTTotal LT* = Total PT* = * Total LT and PT are calculated by summing the LT and PT values for all processes.
- 9. 2 Value Stream Current State Overview Overview of the Process Describe the process here Challenges List and briefly describe the challenges here List and briefly describe the challenges here List and briefly describe the challenges here Bottlenecks List and briefly describe the bottlenecks here List and briefly describe the bottlenecks here List and briefly describe the bottlenecks here References Martin, K. & Osterling, M. (2014). Value Stream Mapping.
- 10. 3 image3.png