SlideShare a Scribd company logo
1 of 11
2016/11/052016/11/05
© Shingo Nagamatsu
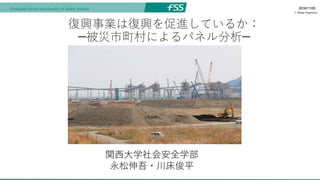
復興事業は復興を促進しているか:
−被災市町村によるパネル分析−
関西大学社会安全学部
永松伸吾・川床俊平
2016/11/052016/11/05
© Shingo Nagamatsu
研究の目的
• 2011年東日本大震災からの復興過程では、将来の被害の軽減の
ために、防潮堤の建設、高台移転、嵩上げなどの復興事業が過
去にない規模で実施された。
• しかしながら、人口減少は震災前のトレンドをさらに加速させ
ている。 (Matanle 2013) それはなぜか?
• 復興事業のパラドクス: より大規模な復興事業を実施すればす
るほど、人口が被災地から流出する。
1. 事業完了までに要する時間が長くなり待てない。
2. 被災者の自己負担が大きくなり、負担できない。
2016/11/052016/11/05
© Shingo Nagamatsu
災害と人口移動に関する先行研究
• 社会関係資本が強い地域ほど人口回復が早い (Aldrich 2012)
• コミュニティによる「クラブ財」の供給がコミュニティの人口
回復を早めた (Chamlee-Wright and Storr 2009)
• ハリケーンカトリーナで被災したニューオリンズから出て行っ
た人々は、残った人々よりも社会的に脆弱な階層が多かった
(Fussell 2015, Fussell, Sastry, and Vanlandingham 2010, Groen and
Polivka 2010).
• ニューオリンズが人口を回復出来なかった理由を簡単な部分均
衡モデルによって説明。住宅価格の上昇が主な原因(Vigdor
2008)
• 政府による復興事業が人口回復に与えた影響に関する既存研究
は見当たらない。→本稿の貢献
2016/11/052016/11/05
© Shingo Nagamatsu
人口移動と被害規模および復興事業規模の関係
2012.10.1 2013.10.1 2014.10.1 2015.10.1
y = -0.0809x + 0.079
R² = 0.4371
-8
-6
-4
-2
0
2
4
0 20 40 60
純転入者率(%)
面的整備事業規模(%)
y = -0.0639x + 0.1564
R² = 0.3493
-8
-3
2
7
0 20 40 60
純転入者率(%)
面的整備事業規模(%)
2016/11/052016/11/05
© Shingo Nagamatsu
面的事業規模の決定要因
面的事業規模は死者・行方不明者数割合によってより説明できる。
→人的被害の大きいコミュニティほど、面的整備に対する合意が得やすかった。
2016/11/052016/11/05
© Shingo Nagamatsu
モデル
𝑀𝑖𝑔𝑟𝑎𝑡𝑖𝑜𝑛𝑖,𝑡
= 𝛼0 + 𝛼1 𝑆𝑐𝑎𝑙𝑒𝑖,𝑡 + 𝛼2 𝐷𝑎𝑚𝑎𝑔𝑒𝑖,𝑡 + 𝛼3 𝐷𝑎𝑚𝑎𝑔𝑒𝑖,𝑡 𝐷𝑢𝑚𝑚𝑦2011 + 𝛽𝑋𝑖,𝑡 + 𝛾𝑇𝑟𝑒𝑛𝑑𝑖
+ 𝑢𝑖𝑡
Migration : 転入率、転出率、純転入率(転入率―転出率).
Scale : 面的整備事業規模.
Damage : 物理的被害規模(半壊以上家屋率、浸水家屋率).
Dummy2011 :2011年について1を取る震災ダミー変数.
X : 物理的被害以外のコントロール変数.
Trend : 震災前の転入転出トレンド変数.
u : 誤差項.
添字 i 及び t : それぞれ市町村と年次を表す. (i=1,..,28, t=2009,…,2015)
α, β, 及び γ : 推計パラメータ.
2016/11/052016/11/05
© Shingo Nagamatsu
データの概要 純転入率、転入率、転出率:各都道府県の10月1日時点の推
計人口における転入数、転出数より計算
面的整備事業規模: 面的整備事業(防災集団移転事業,土地
区画整備事業,漁業集落防災機能強化事業)によって
供給される民間宅地戸数および公営住宅戸数の合計/
2010年末時点の世帯数×100
半壊以上住宅率: 全壊および半壊家屋数の合計/2010年末
の世帯数で除した値×100
住宅浸水率: 津波による浸水家屋数/ 2010年末世帯数×100
2011年ダミー: 2011年に1を取るダミー変数.
納税義務者一人当たり年間平均所得: 課税所得/納税義務者
数
世帯当たり人員数: 推計人口/ 世帯数
新設住宅着工率:国土交通省「住宅着工統計」による新設
着工住宅数/2010年末世帯数×100
65才以上人口割合 (%):65才以上人口/総人口(住民基本台
帳人口による)
主要都市からの距離: 中核市以上の大都市(盛岡、仙台、郡
山、いわき)のいずれかからの最短距離
純転入率トレンド、転入率トレンド、転出率トレンド:
2009年から2010年までの各変数の平均値.
変数 平均 中央値 最大値 最小値 標準偏差 N
純転入率 (%) -0.90 -0.54 1.98 -10.67 1.77 196
転入率 (%) 3.93 2.78 89.84 0.39 6.54 196
転出率 (%) 4.93 3.50 109.52 2.10 7.93 196
面的整備事業規模 (%) 5.82 0.25 44.13 0.00 10.13 196
半壊以上住宅率 (%) 23.45 18.84 82.43 0.00 23.85 196
住宅浸水率 (%) 32.07 27.14 116.16 0.00 31.49 196
2011年ダミー 0.14 0.00 1.00 0.00 0.35 196
納税義務者数当たり年間平均所得(百万円) 2.58 2.53 3.37 2.08 0.26 196
世帯当たり人員数 2.60 2.60 3.26 2.00 0.27 196
新設住宅着工率 (%) 2.48 1.63 12.76 0.00 2.32 196
65以上人口率 (%) 28.39 29.26 39.80 17.51 5.14 196
主要都市からの距離 (km) 50.57 61.65 93.70 0.00 29.55 196
純転入率トレンド -0.42 -0.45 1.70 -1.29 0.50 196
転入率トレンド 5.80 3.38 46.10 2.04 8.19 196
転出率トレンド 6.60 3.54 56.11 2.36 9.91 196
2016/11/052016/11/05
© Shingo Nagamatsu
被説明変数
被害変数
期間
市町村数
観測数
推計手法
定数項 3.8585 (2.599) 0.3843 (1.088) 2.2940 (3.396) -0.2424 (1.401)
面的整備事業規模 -0.0467 (0.017) *** -0.0486 (0.009) *** -0.0661 (0.018) *** -0.0516 (0.011) ***
被害変数 -0.0123 (0.008) -0.0014 (0.004) 0.0028 (0.007) 0.0013 (0.003)
被害変数*2011年ダミー -0.0821 (0.011) *** -0.0756 (0.005) *** -0.0638 (0.008) *** -0.0528 (0.003) ***
納税義務者数当たり年間平均所得 -0.4383 (0.52) 0.0790 (0.261) -0.2360 (0.654) 0.2495 (0.297)
世帯当たり人員数 -0.5205 (0.392) -0.1911 (0.15) -0.2004 (0.51) -0.1382 (0.172)
新設住宅着工率 0.1548 (0.055) *** 0.1343 (0.03) *** 0.0957 (0.082) 0.1066 (0.033) ***
65以上人口率 -0.0497 (0.032) -0.0124 (0.012) -0.0583 (0.037) -0.0115 (0.015)
主要都市からの距離 0.0009 (0.004) 0.0024 (0.001) * 0.0086 (0.005) * 0.0030 (0.002)
トレンド変数 0.8107 (0.14) *** 0.8073 (0.097) *** 0.8723 (0.174) *** 0.7466 (0.119) ***
決定係数
修正済み決定係数
F値 *** *** *** ***
Breusch-Pagan 統計値 *** ***
注: 括弧内の数値はクロスセクションで重み付けされた標準誤差を示す.
*, **, *** はそれぞれ 10%, 5%,および 1% で統計的に有意であることを示す.
18.005 13.699
0.669 0.764 0.546 0.758
44.739 71.188 27.097 68.882
OLS
クロスセクション重み
付け GLS
OLS
クロスセクション重み
付け GLS
0.684 0.775 0.567 0.769
28 28 28 28
196 196 196 196
半壊以上住宅率 半壊以上住宅率 住宅浸水率 住宅浸水率
2009 ~ 2015 2009 ~ 2015 2009 ~2015 2009 ~ 2015
1 2 3 4
純転入率 純転入率 純転入率 純転入率
推計1: 全サンプルによる純転入率の分析
• 被害変数の係数はいずれも有意ではない。
• 面的事業整備規模の係数はいずれも負で有意。
• ただし、これではまだ疑似相関の可能性が高い。
2016/11/052016/11/05
© Shingo Nagamatsu
被説明変数
被害変数
期間
クロスセクション数
サンプル数
定数項 3.5243 (2.677) 4.3027 (3.42) -0.9622 (1.95) -0.6077 (2.263)
面的整備事業規模 -0.0393 (0.016) ** -0.0509 (0.016) *** -0.0351 (0.017) ** -0.0353 (0.019) *
被害変数 -0.0099 (0.007) -0.0008 (0.006) 0.0114 (0.007) 0.0034 (0.005)
被害変数*2011年ダミー -0.0816 (0.008) *** -0.0614 (0.006) *** -0.0355 (0.009) *** -0.0231 (0.005) ***
納税義務者数当たり年間平均所得 -0.2515 (0.448) -0.2702 (0.595) 0.4279 (0.406) 0.3661 (0.451)
世帯当たり人員数 -0.7380 (0.394) * -0.6033 (0.525) -0.1274 (0.277) -0.1886 (0.285)
新設住宅着工率 0.1651 (0.04) *** 0.1700 (0.063) *** 0.0226 (0.051) 0.0663 (0.039) *
65以上人口率 -0.0782 (0.046) * -0.1229 (0.063) * -0.0030 (0.017) -0.0032 (0.019)
主要都市からの距離 0.0197 (0.007) *** 0.0214 (0.008) *** 0.0011 (0.002) 0.0000 (0.003)
トレンド変数 1.0250 (0.192) *** 0.8228 (0.232) *** 0.6174 (0.26) ** 0.5629 (0.295) *
決定係数
修正済み決定係数
F値 *** *** *** ***
注: 括弧内の数値はクロスセクションで重み付けされた標準誤差を示す.
括弧内はクロスセクションで重み付けされた標準誤差
*, **, *** はそれぞれ 10%, 5%,および 1% で統計的に有意であることを示す.
53.298 33.230 9.475 16.322
0.845 0.773 0.492 0.625
0.829 0.749 0.440 0.587
14 (死亡率>1%) 14(死亡率>1%) 14(死亡率=<1%) 14(死亡率=<1%)
98 98 98 98
半壊以上住宅率 住宅浸水率 半壊以上住宅率 住宅浸水率
2009 to 2015 2009 to 2015 2009 to 2015 2009 to 2015
1 2 3 4
純転入率 純転入率 純転入率 純転入率
推計2: 死亡率でサンプルを分割して推計
• この場合も、面的事業規模は負で有意。
• 但し、有意性は低死亡率のサンプルにおいて下がる。
2016/11/052016/11/05
© Shingo Nagamatsu
被説明変数
被害変数
期間
クロスセクション数
サンプル数
定数項 5.1545 (4.066) 5.4528 (3.431) -3.5817 (5.106) -2.4330 (4.544)
面的整備事業規模 0.0119 (0.016) 0.0293 (0.019) 0.0504 (0.021) ** 0.0754 (0.024) ***
被害変数 -0.0223 (0.009) ** -0.0295 (0.009) *** -0.0035 (0.012) -0.0182 (0.012)
被害変数*2011年ダミー 0.0072 (0.01) 0.0101 (0.01) 0.0850 (0.014) *** 0.0827 (0.013) ***
決定係数
修正済み決定係数
F値 *** *** *** ***
被説明変数
被害変数
期間
クロスセクション数
サンプル数
定数項 -3.6475 (1.891) * -2.4183 (1.613) -4.7357 (2.214) ** -3.1958 (2.713)
面的整備事業規模 0.0283 (0.027) 0.0370 (0.036) 0.0446 (0.029) 0.0707 (0.038) *
被害変数 -0.0227 (0.011) ** -0.0119 (0.008) -0.0423 (0.011) *** -0.0199 (0.008) **
被害変数*2011年ダミー 0.0184 (0.013) 0.0079 (0.008) 0.0492 (0.013) *** 0.0264 (0.009) ***
決定係数
修正済み決定係数
F値 *** *** *** ***
注: 括弧内の数値はクロスセクションで重み付けされた標準誤差を示す.
括弧内はクロスセクションで重み付けされた標準誤差
*, **, *** はそれぞれ 10%, 5%,および 1% で統計的に有意であることを示す.
0.647 0.635 0.533 0.479
20.758 19.773 13.291 10.927
98 98 98 98
0.680 0.669 0.576 0.528
2009 to 2015 2009 to 2015 2009 to 2015 2009 to 2015
14(死亡率=<1%) 14(死亡率=<1%) 14(死亡率=<1%) 14(死亡率=<1%)
転入率 転入率 転出率 転出率
半壊以上住宅率 住宅浸水率 半壊以上住宅率 住宅浸水率
9.032 4.819 11.161 8.569
5 6 7 8
0.480 0.330 0.533 0.467
0.427 0.262 0.485 0.413
14 (死亡率>1%) 14(死亡率>1%) 14(死亡率>1%) 14(死亡率>1%)
98 98 98 98
半壊以上住宅率 住宅浸水率 半壊以上住宅率 住宅浸水率
2009 to 2015 2009 to 2015 2009 to 2015 2009 to 2015
1 2 3 4
転入率 転入率 転出率 転出率
推計3 : 転入率、転出率の推計
被害規模→転入を抑制
面的整備規模→転出を加速
高死亡率グループ
低死亡率グループ
転入、転出に分けた分析では面的
整備規模についてそれほど明確な
影響は見られなかった。
→市町村内で人口移動が起こって
いる可能性は否定できない。
2016/11/052016/11/05
© Shingo Nagamatsu
結論と政策的含意
• 面的整備を大規模に実施した自治体ほど、人口減少を加速させてい
ることが統計的に示された。
• 大規模な復興事業は誰のためなのか?
• 効率性の観点からいうと、代替的な方法(避難対策の強化など)で
安全性を確保するアプローチの方が、早期の復興と安全性の両立が
可能になったのでは。
• 面的整備で安全性を確保しつつ、人口減少を食い止めようとすれ
ば、被災者への補助金等、さらなるインセンティブが必要かもしれ
ない。
• しかしそれは世代間公平の観点から正当化できるか?
• 復興事業の遅れは構造的問題であり簡単に解消はできない。オリン
ピックが終われば再び建設業者は減少するだろう。
• 持続可能な復興に向けて新たな仕組みを検討すべき。

More Related Content

Featured

PEPSICO Presentation to CAGNY Conference Feb 2024
PEPSICO Presentation to CAGNY Conference Feb 2024PEPSICO Presentation to CAGNY Conference Feb 2024
PEPSICO Presentation to CAGNY Conference Feb 2024Neil Kimberley
 
Content Methodology: A Best Practices Report (Webinar)
Content Methodology: A Best Practices Report (Webinar)Content Methodology: A Best Practices Report (Webinar)
Content Methodology: A Best Practices Report (Webinar)contently
 
How to Prepare For a Successful Job Search for 2024
How to Prepare For a Successful Job Search for 2024How to Prepare For a Successful Job Search for 2024
How to Prepare For a Successful Job Search for 2024Albert Qian
 
Social Media Marketing Trends 2024 // The Global Indie Insights
Social Media Marketing Trends 2024 // The Global Indie InsightsSocial Media Marketing Trends 2024 // The Global Indie Insights
Social Media Marketing Trends 2024 // The Global Indie InsightsKurio // The Social Media Age(ncy)
 
Trends In Paid Search: Navigating The Digital Landscape In 2024
Trends In Paid Search: Navigating The Digital Landscape In 2024Trends In Paid Search: Navigating The Digital Landscape In 2024
Trends In Paid Search: Navigating The Digital Landscape In 2024Search Engine Journal
 
5 Public speaking tips from TED - Visualized summary
5 Public speaking tips from TED - Visualized summary5 Public speaking tips from TED - Visualized summary
5 Public speaking tips from TED - Visualized summarySpeakerHub
 
ChatGPT and the Future of Work - Clark Boyd
ChatGPT and the Future of Work - Clark Boyd ChatGPT and the Future of Work - Clark Boyd
ChatGPT and the Future of Work - Clark Boyd Clark Boyd
 
Getting into the tech field. what next
Getting into the tech field. what next Getting into the tech field. what next
Getting into the tech field. what next Tessa Mero
 
Google's Just Not That Into You: Understanding Core Updates & Search Intent
Google's Just Not That Into You: Understanding Core Updates & Search IntentGoogle's Just Not That Into You: Understanding Core Updates & Search Intent
Google's Just Not That Into You: Understanding Core Updates & Search IntentLily Ray
 
Time Management & Productivity - Best Practices
Time Management & Productivity -  Best PracticesTime Management & Productivity -  Best Practices
Time Management & Productivity - Best PracticesVit Horky
 
The six step guide to practical project management
The six step guide to practical project managementThe six step guide to practical project management
The six step guide to practical project managementMindGenius
 
Beginners Guide to TikTok for Search - Rachel Pearson - We are Tilt __ Bright...
Beginners Guide to TikTok for Search - Rachel Pearson - We are Tilt __ Bright...Beginners Guide to TikTok for Search - Rachel Pearson - We are Tilt __ Bright...
Beginners Guide to TikTok for Search - Rachel Pearson - We are Tilt __ Bright...RachelPearson36
 
Unlocking the Power of ChatGPT and AI in Testing - A Real-World Look, present...
Unlocking the Power of ChatGPT and AI in Testing - A Real-World Look, present...Unlocking the Power of ChatGPT and AI in Testing - A Real-World Look, present...
Unlocking the Power of ChatGPT and AI in Testing - A Real-World Look, present...Applitools
 
12 Ways to Increase Your Influence at Work
12 Ways to Increase Your Influence at Work12 Ways to Increase Your Influence at Work
12 Ways to Increase Your Influence at WorkGetSmarter
 
Ride the Storm: Navigating Through Unstable Periods / Katerina Rudko (Belka G...
Ride the Storm: Navigating Through Unstable Periods / Katerina Rudko (Belka G...Ride the Storm: Navigating Through Unstable Periods / Katerina Rudko (Belka G...
Ride the Storm: Navigating Through Unstable Periods / Katerina Rudko (Belka G...DevGAMM Conference
 
Barbie - Brand Strategy Presentation
Barbie - Brand Strategy PresentationBarbie - Brand Strategy Presentation
Barbie - Brand Strategy PresentationErica Santiago
 

Featured (20)

PEPSICO Presentation to CAGNY Conference Feb 2024
PEPSICO Presentation to CAGNY Conference Feb 2024PEPSICO Presentation to CAGNY Conference Feb 2024
PEPSICO Presentation to CAGNY Conference Feb 2024
 
Content Methodology: A Best Practices Report (Webinar)
Content Methodology: A Best Practices Report (Webinar)Content Methodology: A Best Practices Report (Webinar)
Content Methodology: A Best Practices Report (Webinar)
 
How to Prepare For a Successful Job Search for 2024
How to Prepare For a Successful Job Search for 2024How to Prepare For a Successful Job Search for 2024
How to Prepare For a Successful Job Search for 2024
 
Social Media Marketing Trends 2024 // The Global Indie Insights
Social Media Marketing Trends 2024 // The Global Indie InsightsSocial Media Marketing Trends 2024 // The Global Indie Insights
Social Media Marketing Trends 2024 // The Global Indie Insights
 
Trends In Paid Search: Navigating The Digital Landscape In 2024
Trends In Paid Search: Navigating The Digital Landscape In 2024Trends In Paid Search: Navigating The Digital Landscape In 2024
Trends In Paid Search: Navigating The Digital Landscape In 2024
 
5 Public speaking tips from TED - Visualized summary
5 Public speaking tips from TED - Visualized summary5 Public speaking tips from TED - Visualized summary
5 Public speaking tips from TED - Visualized summary
 
ChatGPT and the Future of Work - Clark Boyd
ChatGPT and the Future of Work - Clark Boyd ChatGPT and the Future of Work - Clark Boyd
ChatGPT and the Future of Work - Clark Boyd
 
Getting into the tech field. what next
Getting into the tech field. what next Getting into the tech field. what next
Getting into the tech field. what next
 
Google's Just Not That Into You: Understanding Core Updates & Search Intent
Google's Just Not That Into You: Understanding Core Updates & Search IntentGoogle's Just Not That Into You: Understanding Core Updates & Search Intent
Google's Just Not That Into You: Understanding Core Updates & Search Intent
 
How to have difficult conversations
How to have difficult conversations How to have difficult conversations
How to have difficult conversations
 
Introduction to Data Science
Introduction to Data ScienceIntroduction to Data Science
Introduction to Data Science
 
Time Management & Productivity - Best Practices
Time Management & Productivity -  Best PracticesTime Management & Productivity -  Best Practices
Time Management & Productivity - Best Practices
 
The six step guide to practical project management
The six step guide to practical project managementThe six step guide to practical project management
The six step guide to practical project management
 
Beginners Guide to TikTok for Search - Rachel Pearson - We are Tilt __ Bright...
Beginners Guide to TikTok for Search - Rachel Pearson - We are Tilt __ Bright...Beginners Guide to TikTok for Search - Rachel Pearson - We are Tilt __ Bright...
Beginners Guide to TikTok for Search - Rachel Pearson - We are Tilt __ Bright...
 
Unlocking the Power of ChatGPT and AI in Testing - A Real-World Look, present...
Unlocking the Power of ChatGPT and AI in Testing - A Real-World Look, present...Unlocking the Power of ChatGPT and AI in Testing - A Real-World Look, present...
Unlocking the Power of ChatGPT and AI in Testing - A Real-World Look, present...
 
12 Ways to Increase Your Influence at Work
12 Ways to Increase Your Influence at Work12 Ways to Increase Your Influence at Work
12 Ways to Increase Your Influence at Work
 
ChatGPT webinar slides
ChatGPT webinar slidesChatGPT webinar slides
ChatGPT webinar slides
 
More than Just Lines on a Map: Best Practices for U.S Bike Routes
More than Just Lines on a Map: Best Practices for U.S Bike RoutesMore than Just Lines on a Map: Best Practices for U.S Bike Routes
More than Just Lines on a Map: Best Practices for U.S Bike Routes
 
Ride the Storm: Navigating Through Unstable Periods / Katerina Rudko (Belka G...
Ride the Storm: Navigating Through Unstable Periods / Katerina Rudko (Belka G...Ride the Storm: Navigating Through Unstable Periods / Katerina Rudko (Belka G...
Ride the Storm: Navigating Through Unstable Periods / Katerina Rudko (Belka G...
 
Barbie - Brand Strategy Presentation
Barbie - Brand Strategy PresentationBarbie - Brand Strategy Presentation
Barbie - Brand Strategy Presentation
 

復興事業は復興を促進しているか

  • 2. 2016/11/052016/11/05 © Shingo Nagamatsu 研究の目的 • 2011年東日本大震災からの復興過程では、将来の被害の軽減の ために、防潮堤の建設、高台移転、嵩上げなどの復興事業が過 去にない規模で実施された。 • しかしながら、人口減少は震災前のトレンドをさらに加速させ ている。 (Matanle 2013) それはなぜか? • 復興事業のパラドクス: より大規模な復興事業を実施すればす るほど、人口が被災地から流出する。 1. 事業完了までに要する時間が長くなり待てない。 2. 被災者の自己負担が大きくなり、負担できない。
  • 3. 2016/11/052016/11/05 © Shingo Nagamatsu 災害と人口移動に関する先行研究 • 社会関係資本が強い地域ほど人口回復が早い (Aldrich 2012) • コミュニティによる「クラブ財」の供給がコミュニティの人口 回復を早めた (Chamlee-Wright and Storr 2009) • ハリケーンカトリーナで被災したニューオリンズから出て行っ た人々は、残った人々よりも社会的に脆弱な階層が多かった (Fussell 2015, Fussell, Sastry, and Vanlandingham 2010, Groen and Polivka 2010). • ニューオリンズが人口を回復出来なかった理由を簡単な部分均 衡モデルによって説明。住宅価格の上昇が主な原因(Vigdor 2008) • 政府による復興事業が人口回復に与えた影響に関する既存研究 は見当たらない。→本稿の貢献
  • 4. 2016/11/052016/11/05 © Shingo Nagamatsu 人口移動と被害規模および復興事業規模の関係 2012.10.1 2013.10.1 2014.10.1 2015.10.1 y = -0.0809x + 0.079 R² = 0.4371 -8 -6 -4 -2 0 2 4 0 20 40 60 純転入者率(%) 面的整備事業規模(%) y = -0.0639x + 0.1564 R² = 0.3493 -8 -3 2 7 0 20 40 60 純転入者率(%) 面的整備事業規模(%)
  • 6. 2016/11/052016/11/05 © Shingo Nagamatsu モデル 𝑀𝑖𝑔𝑟𝑎𝑡𝑖𝑜𝑛𝑖,𝑡 = 𝛼0 + 𝛼1 𝑆𝑐𝑎𝑙𝑒𝑖,𝑡 + 𝛼2 𝐷𝑎𝑚𝑎𝑔𝑒𝑖,𝑡 + 𝛼3 𝐷𝑎𝑚𝑎𝑔𝑒𝑖,𝑡 𝐷𝑢𝑚𝑚𝑦2011 + 𝛽𝑋𝑖,𝑡 + 𝛾𝑇𝑟𝑒𝑛𝑑𝑖 + 𝑢𝑖𝑡 Migration : 転入率、転出率、純転入率(転入率―転出率). Scale : 面的整備事業規模. Damage : 物理的被害規模(半壊以上家屋率、浸水家屋率). Dummy2011 :2011年について1を取る震災ダミー変数. X : 物理的被害以外のコントロール変数. Trend : 震災前の転入転出トレンド変数. u : 誤差項. 添字 i 及び t : それぞれ市町村と年次を表す. (i=1,..,28, t=2009,…,2015) α, β, 及び γ : 推計パラメータ.
  • 7. 2016/11/052016/11/05 © Shingo Nagamatsu データの概要 純転入率、転入率、転出率:各都道府県の10月1日時点の推 計人口における転入数、転出数より計算 面的整備事業規模: 面的整備事業(防災集団移転事業,土地 区画整備事業,漁業集落防災機能強化事業)によって 供給される民間宅地戸数および公営住宅戸数の合計/ 2010年末時点の世帯数×100 半壊以上住宅率: 全壊および半壊家屋数の合計/2010年末 の世帯数で除した値×100 住宅浸水率: 津波による浸水家屋数/ 2010年末世帯数×100 2011年ダミー: 2011年に1を取るダミー変数. 納税義務者一人当たり年間平均所得: 課税所得/納税義務者 数 世帯当たり人員数: 推計人口/ 世帯数 新設住宅着工率:国土交通省「住宅着工統計」による新設 着工住宅数/2010年末世帯数×100 65才以上人口割合 (%):65才以上人口/総人口(住民基本台 帳人口による) 主要都市からの距離: 中核市以上の大都市(盛岡、仙台、郡 山、いわき)のいずれかからの最短距離 純転入率トレンド、転入率トレンド、転出率トレンド: 2009年から2010年までの各変数の平均値. 変数 平均 中央値 最大値 最小値 標準偏差 N 純転入率 (%) -0.90 -0.54 1.98 -10.67 1.77 196 転入率 (%) 3.93 2.78 89.84 0.39 6.54 196 転出率 (%) 4.93 3.50 109.52 2.10 7.93 196 面的整備事業規模 (%) 5.82 0.25 44.13 0.00 10.13 196 半壊以上住宅率 (%) 23.45 18.84 82.43 0.00 23.85 196 住宅浸水率 (%) 32.07 27.14 116.16 0.00 31.49 196 2011年ダミー 0.14 0.00 1.00 0.00 0.35 196 納税義務者数当たり年間平均所得(百万円) 2.58 2.53 3.37 2.08 0.26 196 世帯当たり人員数 2.60 2.60 3.26 2.00 0.27 196 新設住宅着工率 (%) 2.48 1.63 12.76 0.00 2.32 196 65以上人口率 (%) 28.39 29.26 39.80 17.51 5.14 196 主要都市からの距離 (km) 50.57 61.65 93.70 0.00 29.55 196 純転入率トレンド -0.42 -0.45 1.70 -1.29 0.50 196 転入率トレンド 5.80 3.38 46.10 2.04 8.19 196 転出率トレンド 6.60 3.54 56.11 2.36 9.91 196
  • 8. 2016/11/052016/11/05 © Shingo Nagamatsu 被説明変数 被害変数 期間 市町村数 観測数 推計手法 定数項 3.8585 (2.599) 0.3843 (1.088) 2.2940 (3.396) -0.2424 (1.401) 面的整備事業規模 -0.0467 (0.017) *** -0.0486 (0.009) *** -0.0661 (0.018) *** -0.0516 (0.011) *** 被害変数 -0.0123 (0.008) -0.0014 (0.004) 0.0028 (0.007) 0.0013 (0.003) 被害変数*2011年ダミー -0.0821 (0.011) *** -0.0756 (0.005) *** -0.0638 (0.008) *** -0.0528 (0.003) *** 納税義務者数当たり年間平均所得 -0.4383 (0.52) 0.0790 (0.261) -0.2360 (0.654) 0.2495 (0.297) 世帯当たり人員数 -0.5205 (0.392) -0.1911 (0.15) -0.2004 (0.51) -0.1382 (0.172) 新設住宅着工率 0.1548 (0.055) *** 0.1343 (0.03) *** 0.0957 (0.082) 0.1066 (0.033) *** 65以上人口率 -0.0497 (0.032) -0.0124 (0.012) -0.0583 (0.037) -0.0115 (0.015) 主要都市からの距離 0.0009 (0.004) 0.0024 (0.001) * 0.0086 (0.005) * 0.0030 (0.002) トレンド変数 0.8107 (0.14) *** 0.8073 (0.097) *** 0.8723 (0.174) *** 0.7466 (0.119) *** 決定係数 修正済み決定係数 F値 *** *** *** *** Breusch-Pagan 統計値 *** *** 注: 括弧内の数値はクロスセクションで重み付けされた標準誤差を示す. *, **, *** はそれぞれ 10%, 5%,および 1% で統計的に有意であることを示す. 18.005 13.699 0.669 0.764 0.546 0.758 44.739 71.188 27.097 68.882 OLS クロスセクション重み 付け GLS OLS クロスセクション重み 付け GLS 0.684 0.775 0.567 0.769 28 28 28 28 196 196 196 196 半壊以上住宅率 半壊以上住宅率 住宅浸水率 住宅浸水率 2009 ~ 2015 2009 ~ 2015 2009 ~2015 2009 ~ 2015 1 2 3 4 純転入率 純転入率 純転入率 純転入率 推計1: 全サンプルによる純転入率の分析 • 被害変数の係数はいずれも有意ではない。 • 面的事業整備規模の係数はいずれも負で有意。 • ただし、これではまだ疑似相関の可能性が高い。
  • 9. 2016/11/052016/11/05 © Shingo Nagamatsu 被説明変数 被害変数 期間 クロスセクション数 サンプル数 定数項 3.5243 (2.677) 4.3027 (3.42) -0.9622 (1.95) -0.6077 (2.263) 面的整備事業規模 -0.0393 (0.016) ** -0.0509 (0.016) *** -0.0351 (0.017) ** -0.0353 (0.019) * 被害変数 -0.0099 (0.007) -0.0008 (0.006) 0.0114 (0.007) 0.0034 (0.005) 被害変数*2011年ダミー -0.0816 (0.008) *** -0.0614 (0.006) *** -0.0355 (0.009) *** -0.0231 (0.005) *** 納税義務者数当たり年間平均所得 -0.2515 (0.448) -0.2702 (0.595) 0.4279 (0.406) 0.3661 (0.451) 世帯当たり人員数 -0.7380 (0.394) * -0.6033 (0.525) -0.1274 (0.277) -0.1886 (0.285) 新設住宅着工率 0.1651 (0.04) *** 0.1700 (0.063) *** 0.0226 (0.051) 0.0663 (0.039) * 65以上人口率 -0.0782 (0.046) * -0.1229 (0.063) * -0.0030 (0.017) -0.0032 (0.019) 主要都市からの距離 0.0197 (0.007) *** 0.0214 (0.008) *** 0.0011 (0.002) 0.0000 (0.003) トレンド変数 1.0250 (0.192) *** 0.8228 (0.232) *** 0.6174 (0.26) ** 0.5629 (0.295) * 決定係数 修正済み決定係数 F値 *** *** *** *** 注: 括弧内の数値はクロスセクションで重み付けされた標準誤差を示す. 括弧内はクロスセクションで重み付けされた標準誤差 *, **, *** はそれぞれ 10%, 5%,および 1% で統計的に有意であることを示す. 53.298 33.230 9.475 16.322 0.845 0.773 0.492 0.625 0.829 0.749 0.440 0.587 14 (死亡率>1%) 14(死亡率>1%) 14(死亡率=<1%) 14(死亡率=<1%) 98 98 98 98 半壊以上住宅率 住宅浸水率 半壊以上住宅率 住宅浸水率 2009 to 2015 2009 to 2015 2009 to 2015 2009 to 2015 1 2 3 4 純転入率 純転入率 純転入率 純転入率 推計2: 死亡率でサンプルを分割して推計 • この場合も、面的事業規模は負で有意。 • 但し、有意性は低死亡率のサンプルにおいて下がる。
  • 10. 2016/11/052016/11/05 © Shingo Nagamatsu 被説明変数 被害変数 期間 クロスセクション数 サンプル数 定数項 5.1545 (4.066) 5.4528 (3.431) -3.5817 (5.106) -2.4330 (4.544) 面的整備事業規模 0.0119 (0.016) 0.0293 (0.019) 0.0504 (0.021) ** 0.0754 (0.024) *** 被害変数 -0.0223 (0.009) ** -0.0295 (0.009) *** -0.0035 (0.012) -0.0182 (0.012) 被害変数*2011年ダミー 0.0072 (0.01) 0.0101 (0.01) 0.0850 (0.014) *** 0.0827 (0.013) *** 決定係数 修正済み決定係数 F値 *** *** *** *** 被説明変数 被害変数 期間 クロスセクション数 サンプル数 定数項 -3.6475 (1.891) * -2.4183 (1.613) -4.7357 (2.214) ** -3.1958 (2.713) 面的整備事業規模 0.0283 (0.027) 0.0370 (0.036) 0.0446 (0.029) 0.0707 (0.038) * 被害変数 -0.0227 (0.011) ** -0.0119 (0.008) -0.0423 (0.011) *** -0.0199 (0.008) ** 被害変数*2011年ダミー 0.0184 (0.013) 0.0079 (0.008) 0.0492 (0.013) *** 0.0264 (0.009) *** 決定係数 修正済み決定係数 F値 *** *** *** *** 注: 括弧内の数値はクロスセクションで重み付けされた標準誤差を示す. 括弧内はクロスセクションで重み付けされた標準誤差 *, **, *** はそれぞれ 10%, 5%,および 1% で統計的に有意であることを示す. 0.647 0.635 0.533 0.479 20.758 19.773 13.291 10.927 98 98 98 98 0.680 0.669 0.576 0.528 2009 to 2015 2009 to 2015 2009 to 2015 2009 to 2015 14(死亡率=<1%) 14(死亡率=<1%) 14(死亡率=<1%) 14(死亡率=<1%) 転入率 転入率 転出率 転出率 半壊以上住宅率 住宅浸水率 半壊以上住宅率 住宅浸水率 9.032 4.819 11.161 8.569 5 6 7 8 0.480 0.330 0.533 0.467 0.427 0.262 0.485 0.413 14 (死亡率>1%) 14(死亡率>1%) 14(死亡率>1%) 14(死亡率>1%) 98 98 98 98 半壊以上住宅率 住宅浸水率 半壊以上住宅率 住宅浸水率 2009 to 2015 2009 to 2015 2009 to 2015 2009 to 2015 1 2 3 4 転入率 転入率 転出率 転出率 推計3 : 転入率、転出率の推計 被害規模→転入を抑制 面的整備規模→転出を加速 高死亡率グループ 低死亡率グループ 転入、転出に分けた分析では面的 整備規模についてそれほど明確な 影響は見られなかった。 →市町村内で人口移動が起こって いる可能性は否定できない。
  • 11. 2016/11/052016/11/05 © Shingo Nagamatsu 結論と政策的含意 • 面的整備を大規模に実施した自治体ほど、人口減少を加速させてい ることが統計的に示された。 • 大規模な復興事業は誰のためなのか? • 効率性の観点からいうと、代替的な方法(避難対策の強化など)で 安全性を確保するアプローチの方が、早期の復興と安全性の両立が 可能になったのでは。 • 面的整備で安全性を確保しつつ、人口減少を食い止めようとすれ ば、被災者への補助金等、さらなるインセンティブが必要かもしれ ない。 • しかしそれは世代間公平の観点から正当化できるか? • 復興事業の遅れは構造的問題であり簡単に解消はできない。オリン ピックが終われば再び建設業者は減少するだろう。 • 持続可能な復興に向けて新たな仕組みを検討すべき。