The document describes various sampling methods for selecting samples from populations, including probability and non-probability sampling. It focuses on explaining sampling methods that can be performed using STATA software, including simple random sampling, systematic sampling, stratified sampling, cluster sampling, multistage sampling, and providing examples of the STATA code needed to perform each method.


![Probability (Random) Sampling Simple Random Sampling (SRS)
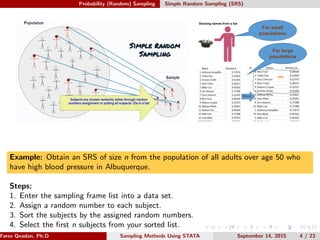
Simple Random Sampling (SRS): it’s a sampling method in which each
subject of the sampling frame has an equal chance of being selected into
the sample [1]. SRS is the most popular method of random sampling.
There are two types of SRS: with replacement and without replacement.
SRS with replacement is less common.
Advantages:
Easy to use in small populations.
With an appropriate sample size, SRS provides a highly representative
sample of the target population.
Disadvantages:
Difficult to use in large populations (expensive: time and cost).
Small segments of the target population may not be present in the
sample with sufficient number of subjects.
Fares Qeadan, Ph.D (Department of Internal Medicine Division of Epidemiology, Biostatistics, & Pre
Sampling Methods Using STATA September 14, 2015 3 / 23](https://image.slidesharecdn.com/sampling-221114161453-f2b3f5d0/85/sampling-pdf-6-320.jpg)

![Probability (Random) Sampling Systematic sampling
Systematic sampling: it’s a sampling method in which subjects are
chosen in a systematic way such that one first randomly picks the first
subject from the sampling frame and then selects each kth subject from
the list (k = N/n) [1]. If the sampling frame is randomly shuffled, then
systematic sampling is equivalent to SRS.
Advantages:
Fast and easy.
With an appropriate sample size, it provides a highly representative
sample of the target population since, by construction, the sample is
uniformly distributed over the sampling frame.
Disadvantages:
Might lead to bias if the sampling frame is arranged in a specific
pattern and the periodicity of the sampling matched the periodicity of
that pattern.
May not capture certain segments of interest from the target
population.
Fares Qeadan, Ph.D (Department of Internal Medicine Division of Epidemiology, Biostatistics, & Pre
Sampling Methods Using STATA September 14, 2015 6 / 23](https://image.slidesharecdn.com/sampling-221114161453-f2b3f5d0/85/sampling-pdf-9-320.jpg)


![Probability (Random) Sampling Stratified sampling
Stratified sampling: it’s a sampling method in which a sample is obtained by firstly
dividing the population into subpopulations (strata) based on some characteristics and
then an SRS is taken from each stratum [1]. Combining the obtained SRSs will give the
final stratified sample. Minority subgroups of interest can be ensured by stratification.
There are two types of stratified sampling: proportionate and disproportionate. In the
proportionate one, we draw a sample from each stratum in proportion to its share in the
target population. By this method, each stratum should be internally homogeneous.
Advantages:
Has the highest precision among other sampling methods.
The sample is more representative as it allows certain segments of interest, from
the target population, to be captured.
We could use other sampling methods than SRS in each stratum.
Disadvantages:
Might introduce some complexities at the analysis stage.
More time consuming and effort than other sampling methods.
Requires separate sampling frames for each stratum.
Fares Qeadan, Ph.D (Department of Internal Medicine Division of Epidemiology, Biostatistics, & Pre
Sampling Methods Using STATA September 14, 2015 9 / 23](https://image.slidesharecdn.com/sampling-221114161453-f2b3f5d0/85/sampling-pdf-12-320.jpg)


![Probability (Random) Sampling Cluster sampling
Cluster sampling: it’s a sampling method in which the target population is first divided
into naturally occurring clusters and then a random sample of clusters is obtained such
that all subjects in the randomly selected clusters are included in the sample [1].
Sometimes, we include an SRS from each selected cluster instead of including all subjects
which makes the sampling method to be called a two-stage sampling method. By this
method, clusters should be internally as heterogeneous as the target population itself.
Advantages:
Doesn’t require a sampling frame.
Time and cost efficient compared to other sampling methods.
Cluster samples have larger sample sizes.
Disadvantages:
Produces higher sampling error.
It’s the least representative of the target population among random sampling
methods.
Fares Qeadan, Ph.D (Department of Internal Medicine Division of Epidemiology, Biostatistics, & Pre
Sampling Methods Using STATA September 14, 2015 12 / 23](https://image.slidesharecdn.com/sampling-221114161453-f2b3f5d0/85/sampling-pdf-15-320.jpg)

![Probability (Random) Sampling Multistage sampling
Multistage sampling: It’s a sampling method in which we use combinations of two or
more sampling methods at least one of which involves randomness [2]. The most
common examples for multistage sampling are Stratified random sampling and cluster
sampling. For example, in the 2 stage cluster sampling, in Stage 1, we use cluster
sampling to choose clusters from a population. Then, in Stage 2, we use simple random
sampling to select a subset from each cluster for the final sample.
Advantages:
Cost and Time effective.
Sometimes, it does not require a sampling frame.
Multistage samples have larger sample sizes.
Disadvantages:
Difficult and complex design.
Partially subjective.
Induces lower accuracy due to higher sampling error.
Fares Qeadan, Ph.D (Department of Internal Medicine Division of Epidemiology, Biostatistics, & Pre
Sampling Methods Using STATA September 14, 2015 15 / 23](https://image.slidesharecdn.com/sampling-221114161453-f2b3f5d0/85/sampling-pdf-18-320.jpg)


![Non-Probability Sampling Convenience sampling
Convenience sampling: it’s a non-probability sampling method in which
subjects are conveniently available to the researcher [3]. This is the most
popular method of non-probability sampling and sometimes is called
accidental sampling.
Advantages:
Cheap and simple; requires no planning.
Helpful for pilot studies and hypotheses generation.
Disadvantages:
Unrepresentative of the target population.
Suffers from selection bias.
Remark: For other non-probability sampling methods please revisit [4].
Fares Qeadan, Ph.D (Department of Internal Medicine Division of Epidemiology, Biostatistics, & Pre
Sampling Methods Using STATA September 14, 2015 19 / 23](https://image.slidesharecdn.com/sampling-221114161453-f2b3f5d0/85/sampling-pdf-22-320.jpg)
![Sampling Bias Sampling Bias
Sampling Bias: Sampling bias refers to over-representation or
under-representation of some subgroups of the target population. There
are two types of sampling bias including random errors and systematic
errors [5].
Random Error: error is reduced with increased sample size. It’s due to
the sample size. Error is evenly distributed across the sampling frame.
Systematic Error (bias): error is not reduced with increased sample
size. It’s due the design; mainly non-randomness.
Fares Qeadan, Ph.D (Department of Internal Medicine Division of Epidemiology, Biostatistics, & Pre
Sampling Methods Using STATA September 14, 2015 20 / 23](https://image.slidesharecdn.com/sampling-221114161453-f2b3f5d0/85/sampling-pdf-23-320.jpg)
![References
References
[1]. Lohr, Sharon (2009). Sampling: design and analysis. Cengage
Learning.
[2]. Foreman, E. K. (1991). Survey sampling principles. CRC Press.
[3]. Trevino, J. J. (2012). Addiction Research Methods edited by Peter
G. Miller, John Strang, Peter M. Miller.
[4]. DePoy, E., and Gitlin, L. N. (2015). Introduction to research:
Understanding and applying multiple strategies. Elsevier Health
Sciences.
[5]. Norell, S. E. (1995). Workbook of epidemiology. Oxford University
Press.
Fares Qeadan, Ph.D (Department of Internal Medicine Division of Epidemiology, Biostatistics, & Pre
Sampling Methods Using STATA September 14, 2015 21 / 23](https://image.slidesharecdn.com/sampling-221114161453-f2b3f5d0/85/sampling-pdf-24-320.jpg)


