
Recommended
More Related Content
More from ssuser3bbeb5
More from ssuser3bbeb5 (20)
Recently uploaded
Recently uploaded (20)
3d Graph.pptx
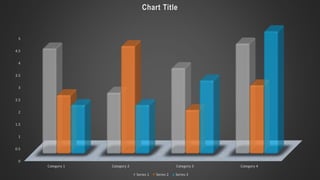
- 1. 0 0.5 1 1.5 2 2.5 3 3.5 4 4.5 5 Category 1 Category 2 Category 3 Category 4 Chart Title Series 1 Series 2 Series 3