To classify Alzheimer’s Disease from 3D structural MRI data
•Download as PPTX, PDF•
0 likes•41 views

To classify Alzheimer’s Disease from 3D structural MRI data
![Pattern Recognition Laboratory
Dataset
Dataset
Using Alzheimer’s Disease Neuroimaging Initiative(ADNI) database
• AD: 22 image, MCI: 22 image, NC: 22 image (Total: 66 image)
Data Preprocessing
References : H.-l. Suk, S.-W Lee, D. Shen, and The Alzheimer’s Disease Neuroiamging
Initiative,”PMC, Vol. 221, No. 5, 2016, pp. 2569-2587.
Training(12) Validation(5) Test(5)
Follow the paper
[H. Suk et al., 2016]
Using Medical Image
Processing Analysis
and Visualization
(MIPAV) software
(256X256X128)
AC-PC
correction Resampling
Rotate Skull stripping
N3 algorithm
(256X256X256)Raw data (256X256X128)
(256X256X256) (256X256X256) (256X256X256)
Process of Data Preprocessing](data:image/gif;base64,R0lGODlhAQABAIAAAAAAAP///yH5BAEAAAAALAAAAAABAAEAAAIBRAA7)
Recommended
Recommended
More Related Content
Similar to To classify Alzheimer’s Disease from 3D structural MRI data
Similar to To classify Alzheimer’s Disease from 3D structural MRI data (20)
More from Seoung-Ho Choi
More from Seoung-Ho Choi (20)
Recently uploaded
Recently uploaded (20)
To classify Alzheimer’s Disease from 3D structural MRI data
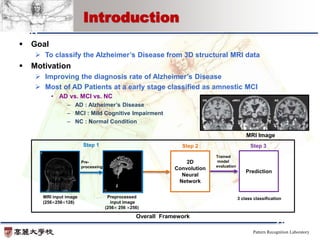
- 1. Pattern Recognition Laboratory Goal To classify the Alzheimer’s Disease from 3D structural MRI data Motivation Improving the diagnosis rate of Alzheimer’s Disease Most of AD Patients at a early stage classified as amnestic MCI • AD vs. MCI vs. NC – AD : Alzheimer’s Disease – MCI : Mild Cognitive Impairment – NC : Normal Condition Introduction Step 1 MRI input image (256×256×128) 2D Convolution Neural Network Step 2 Step 3 Trained model evaluation Pre- processing Preprocessed input image (256× 256 ×256) 3 class classification Overall Framework Prediction 2D Convolution Neural Network MRI Image
- 2. Pattern Recognition Laboratory Dataset Dataset Using Alzheimer’s Disease Neuroimaging Initiative(ADNI) database • AD: 22 image, MCI: 22 image, NC: 22 image (Total: 66 image) Data Preprocessing References : H.-l. Suk, S.-W Lee, D. Shen, and The Alzheimer’s Disease Neuroiamging Initiative,”PMC, Vol. 221, No. 5, 2016, pp. 2569-2587. Training(12) Validation(5) Test(5) Follow the paper [H. Suk et al., 2016] Using Medical Image Processing Analysis and Visualization (MIPAV) software (256X256X128) AC-PC correction Resampling Rotate Skull stripping N3 algorithm (256X256X256)Raw data (256X256X128) (256X256X256) (256X256X256) (256X256X256) Process of Data Preprocessing
- 3. Pattern Recognition Laboratory Network Model 2D Convolutional Neural Network (CNN) Architecture: AlexNet • 5 Convolutional layers, 2 Fully Connected layers Input : preprocessed MRI data (126X126X126) Parameters • Batch size : 1 • Learning Rate : 0.000004 Loss function • Cross entropy Optimization • Adam optimization 96X64X64 256X15X15 384X15X15 256X7X7 output Input image 126X126X126 Conv1 Conv2 Conv3 Conv4 Conv5 FC1 FC2 1024 1024 Softmax (11 X 11) (5 X 5) (3 X 3) (3 X 3) (3 X 3) Architecture of Network model
- 4. Pattern Recognition Laboratory Experiments Preprocessed input data Experiment Data Analysis (MRI voxel) Result(1/2) AD NC Mean Standard Deviation Variance Train AD 27.99 115.74 19424.79 MCI 30.41 114.26 13629.33 NC 24.61 96.45 10139.13 Validation AD 44.68 165.22 36942.11 MCI 52.92 159.02 27099.43 NC 56.10 170.96 30744.72 Test AD 25.40 97.14 9947.93 MCI 24.63 90.60 8266.77 NC 19.53 79.93 6406.18 MCI Feature maps
- 5. Pattern Recognition Laboratory Experiment Model Result Conclusion Classification of MCI vs. NC is better than that of AD vs. MCI Cannot use in real life because of Bad Performance • Using only 66 MRI data -> Increase the number of data • Unsure data preprocessing -> Correct the flaw of preprocessing • Inefficient feature extraction -> Find the methods of efficient feature extraction Result(2/2) Classification Positive Predictive Value (PPV) Negative Predictive Value (NPV) F1 Score AD vs. MCI vs. NC 0.5 0.53 0.37 MCI vs. NC 0.75 0.66 0.66 AD vs. MCI 0.5 0.5 0.28
Editor's Notes
- N3 algorithm to correct intensity inhomogeneity and rotation