More Related Content
Similar to 137 van beckom (20)
More from Society for Scholarly Publishing (20)
137 van beckom
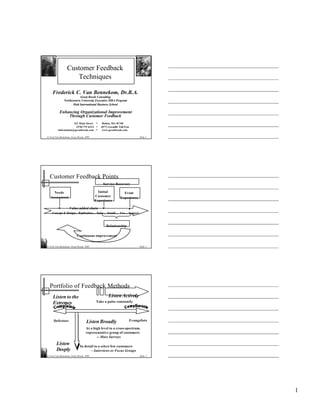
- 1. Customer Feedback
Techniques
Frederick C. Van Bennekom, Dr.B.A.
Great Brook Consulting
Northeastern University Executive MBA Program
Hult International Business School
Enhancing Organizational Improvement
Through Customer Feedback
421 Main Street F Bolton, MA 01740
(978) 779 -6312 F (877) GreatBr Toll Free
information@greatbrook.com F www.greatbrook.com
© Fred Van Bennekom, Great Brook, 2005 Slide 1
Customer Feedback Points
Service Recovery
Needs Initial Event
Assessment Customer Experience
Experience
Value added chain
Concept & Design... Replication… Sales… Install… Use… Support...
Relationship
Continuous improvement
© Fred Van Bennekom, Great Brook, 2005 Slide 2
Portfolio of Feedback Methods
Listen to the Listen Actively
Extremes Take a pulse constantly
Defectors Listen Broadly Evangelists
At a high level to a cross-spectrum,
representative group of customers
-- Mass Surveys
Listen In detail to a select few customers
Deeply – Interviews or Focus Groups
© Fred Van Bennekom, Great Brook, 2005 Slide 3
1
- 2. Portfolio of Feedback Methods
Generalizability
of Results
•Passive • Call •Active
Surveys Monitoring Surveys
•User Groups
•Interviews
•Focus Groups
• Mystery Shopping
•Unsolicited Comments
Depth of
Context
© Fred Van Bennekom, Great Brook, 2005 Slide 4
Understand Scientific
Sample is
Survey Principles randomly
Population generated from
Population
rr x
r Sample
x x Design & Administer
x
x
r Instrument to a Sample
x r
x x x r xx r r
x x x x r Analyze
x
x x x x r r Sample
x x rx x x x r
x r Data
x
r x x
x Generalize Results
x x
x r x
to the Population
x x
x x
Surveying a Sample is More
Efficient Than a Full Census
Instrument Validity + Administration Accuracy = Reliability
© Fred Van Bennekom, Great Brook, 2005 Slide 5
Fighting Bias & Error in a Survey to
Deliver Meaningful Findings
Instrument Survey Analysis &
Design Administration Reporting
– Sampling procedure – Bad model for
– Instrumentation
analysis
bias – Defining relevant
population – Error in
– Questions that
analysis
do not support – Administration
desired analysis technique bias – Weak
presentation
– Non-response bias
of the findings
– Response bias
© Fred Van Bennekom, Great Brook, 2005 Slide 6
2
- 3. How Can Surveys Be Conducted?
q Postal Mail — Hardcopy
q Telephone
q Email
q Web Forms – with an invitation!
q Point of Contact
q IVR
q Diskette
© Fred Van Bennekom, Great Brook, 2005 Slide 7
What are the Criteria for
Choosing a Survey Method?
q Response rate q Question complexity
q Speed of generating data q Administration control for
q Cost per completed survey question branching
response q Interviewer bias
q Scalability of the q Administration bias
administration q Anonymity guarantee
q Ability to clarify questions q Willingness to provide
for the respondent comments
q Feedback on the q Quality & nature of
instrument during its comments
administration
© Fred Van Bennekom, Great Brook, 2005 Slide 8
How Does Each
Survey Method Rate?
Telephone Mail Electronic
Response Rate High Low High
Speed (IVR) Fast Slow Very Fast
Cost per Completed Survey High Low Lowest
Scalability Linear Some Very High
Ability to Clarify High. None Limited
Instrument Feedback Yes Some None
Question Complexity Very Low Highest High/Low
Administration Control Interviewer Respondent Depends...
Anonymity None Yes Questionable
Comments Spontaneous Cryptic Contemplative
Interviewer Bias High Potential None None
Administration Bias Limited Non-Response Sample Bias
© Fred Van Bennekom, Great Brook, 2005 Slide 9
3
- 4. Administration Bias
Population
x
x
Sample
x x
x
x x x x r
x x r r
x x x
x x r
x x r r
x x x
x x
x x xx r r
x x rx r x r
x x x x x
x
x r r x
r x x x
x r
x x
r x
• Random selection from a biased subset of the
population is NOT a random sample!
© Fred Van Bennekom, Great Brook, 2005 Slide 10
Non-Response Bias
Population Response
Sample
rr x
Group
x r
x x
r x r
x r rr
x x x r xx r r
x x x r r
x x r
x x x x
x x rx x x x r r
x x x x
r x xx
x r x
x x
x x
The Sample was drawn randomly from
the Population, but the Response Group
is not representative of the Sample.
© Fred Van Bennekom, Great Brook, 2005 Slide 11
Thanks for Attending
© Fred Van Bennekom, Great Brook, 2005 Slide 12
4