
Recommended
More Related Content
Similar to Regression (aka Least Squares)Regression is the formal name give.docx
Similar to Regression (aka Least Squares)Regression is the formal name give.docx (20)
More from sodhi3
More from sodhi3 (20)
Recently uploaded
Recently uploaded (20)
Regression (aka Least Squares)Regression is the formal name give.docx
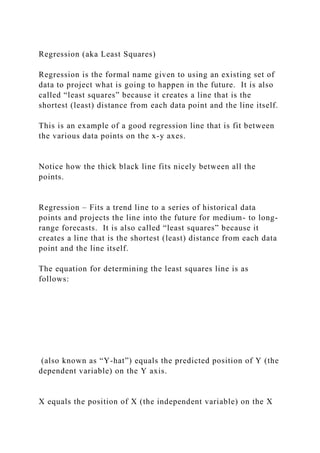
- 1. Regression (aka Least Squares) Regression is the formal name given to using an existing set of data to project what is going to happen in the future. It is also called “least squares” because it creates a line that is the shortest (least) distance from each data point and the line itself. This is an example of a good regression line that is fit between the various data points on the x-y axes. Notice how the thick black line fits nicely between all the points. Regression – Fits a trend line to a series of historical data points and projects the line into the future for medium- to long- range forecasts. It is also called “least squares” because it creates a line that is the shortest (least) distance from each data point and the line itself. The equation for determining the least squares line is as follows: (also known as “Y-hat”) equals the predicted position of Y (the dependent variable) on the Y axis. X equals the position of X (the independent variable) on the X
- 2. axis. a and b modify the height of Y based on the position of X. How to Solve a Regression Problem: 1. Build a data table including all Xs, Ys, XY, X2, and Y2. 2. Sum each column in the data table—that is, X, Y, XY, X2, and Y2. 3. Insert the summed data into the following equation for b: 4. Insert the summed data into the following equation for a: 5. Insert the solutions for a and b into the following equation: 6. Insert the value of X to solve for Y-hat. Step-by-Step for Regression Step 1: Build the grid, inserting variables for X and Y.
- 3. Cylinders City MPG n X Y 1 Audi A4 Avant 4 22 2 Audi A8 8 17 3 BMW 325 6 20 4 BMW 525 6 20 5 BMW 645 8 17 6 Dodge Charger 6 19 7 Dodge Magnum 6
- 4. 21 8 Ford Explorer 6 15 9 Ford Mustang 6 19 10 Honda Civic 4 30 11 Honda Odyssey 6 19 12 Mazda 3 4 28 13 Mercedes Benz E-Class 6 19 14 Nissan Titan 8 14 15 Nissan Xterra 6 16 16 Scion xB 4
- 5. 30 17 Toyota Tacoma 4 21 Step 2: Using the Xs and Ys, calculate XY, X2, and Y2. Cylinders City MPG X Y XY X2 Y2 1 Audi A4 Avant 4 22 88 16 484 2 Audi A8 8 17 136 64
- 6. 289 3 BMW 325 6 20 120 36 400 4 BMW 525 6 20 120 36 400 5 BMW 645 8 17 136 64 289 6 Dodge Charger 6 19 114 36 361 7 Dodge Magnum 6 21 126 36 441
- 7. 8 Ford Explorer 6 15 90 36 225 9 Ford Mustang 6 19 114 36 361 10 Honda Civic 4 30 120 16 900 11 Honda Odyssey 6 19 114 36 361 12 Mazda 3 4 28 112 16 784 13
- 8. Mercedes Benz E-Class 6 19 114 36 361 14 Nissan Titan 8 14 112 64 196 15 Nissan Xterra 6 16 96 36 256 16 Scion xB 4 30 120 16 900 17 Toyota Tacoma 4 21 84 16 441 Step 3: Find the sum of each column.
- 9. Cylinders City MPG X Y XY X2 Y2 1 Audi A4 Avant 4 22 88 16 484 2 Audi A8 8 17 136 64 289 3 BMW 325 6 20 120 36 400
- 10. 4 BMW 525 6 20 120 36 400 5 BMW 645 8 17 136 64 289 6 Dodge Charger 6 19 114 36 361 7 Dodge Magnum 6 21 126 36 441 8 Ford Explorer 6 15 90 36 225 9
- 11. Ford Mustang 6 19 114 36 361 10 Honda Civic 4 30 120 16 900 11 Honda Odyssey 6 19 114 36 361 12 Mazda 3 4 28 112 16 784 13 Mercedes Benz E-Class 6 19 114 36 361 14 Nissan Titan
- 12. 8 14 112 64 196 15 Nissan Xterra 6 16 96 36 256 16 Scion xB 4 30 120 16 900 17 Toyota Tacoma 4 21 84 16 441 Sum Sum X Sum Y Sum XY Sum X2 Sum Y2 98
- 13. 347 1916 596 7449 Step 4: Find the average of X and Y. Cylinders City MPG X Y XY X2 Y2 1 Audi A4 Avant 4 22 88 16 484 2 Audi A8 8 17 136 64 289
- 14. 3 BMW 325 6 20 120 36 400 4 BMW 525 6 20 120 36 400 5 BMW 645 8 17 136 64 289 6 Dodge Charger 6 19 114 36 361 7 Dodge Magnum 6 21 126 36 441 8
- 15. Ford Explorer 6 15 90 36 225 9 Ford Mustang 6 19 114 36 361 10 Honda Civic 4 30 120 16 900 11 Honda Odyssey 6 19 114 36 361 12 Mazda 3 4 28 112 16 784 13 Mercedes Benz E-Class
- 16. 6 19 114 36 361 14 Nissan Titan 8 14 112 64 196 15 Nissan Xterra 6 16 96 36 256 16 Scion xB 4 30 120 16 900 17 Toyota Tacoma 4 21 84 16 441 Sum Sum X
- 17. Sum Y Sum XY Sum X2 Sum Y2 98 347 1916 596 7449 Average 5.76 20.41 Step 5: Solve for b, using the information in the data grid.
- 18. Page 3 of 5
- 19. Step 6: Solve for a, using the information in the data grid. Step 7: Put a and b into the regression equation. Step 8: To solve for Y, insert X. If X = 6 (cylinders), then what does Y (MPG) equal?
- 20. For a 6-cylinder vehicle (X = 6), Y = 19.79 MPG. ^ Y å å - - = 2 2 X n X Y X n XY b X b Y a - = å =
- 26. = Y bX a Y + = ^ Sheet4SUMMARY OUTPUTRegression StatisticsMultiple R0.7721873425R Square0.5962732919Adjusted R Square0.5674356699Standard Error2.1547290184Observations16ANOVAdfSSMSFSignificanc e FRegression1969620.67692307690.0004561386Residual14654.6 428571429Total15161CoefficientsStandard Errort StatP- valueLower 95%Upper 95%Lower 95.0%Upper 95.0%Intercept29.752.264174925913.13944415660.0000000029 24.893827759734.606172240324.893827759734.6061722403X- 20.4398322191-4.54718848050.0004561386-2.9433462884- 1.0566537116-2.9433462884-1.0566537116 Sheet1CylindersCity MPGn XYXYX2Y21Ford Edge SE42080164002Toyota Sienna L618108363243Infiniti Q70L 3.7618108363244Jaguar XF 2.0T41976163615Ford F-150 XL V6618108363246Chevrolet Tahoe LS61696362567Nissan Juke425100166258BMW X142288164849Ford Escape422881648410Hyundai Santa Fe418721632411Porsche Macan6171023628912Mini Cooper Countryman4261041667613Land Rover Range Rover6171023628914Honda Accord424961657615Cadillac ATS421841644116Dodge Charger SRT Hellcat8151206422580316153242464025.019.7515321580-48 Sheet2 Sheet3 å å
- 27. - - = 2 2 X n X XY n XY b 1 2 3 4 5 6 7 8 9 10 11 A B C D n 1 Ford Edge SE 2 Toyota Sienna L 3 Infiniti Q70L 3.7 4
- 28. Jaguar XF 2.0T 5 Ford F-150 XL V6 6 Chevrolet Tahoe LS 7 Nissan Juke img738.pdf img737.pdf img736.pdf img735.pdf img734.pdf img733.pdf img726.pdf