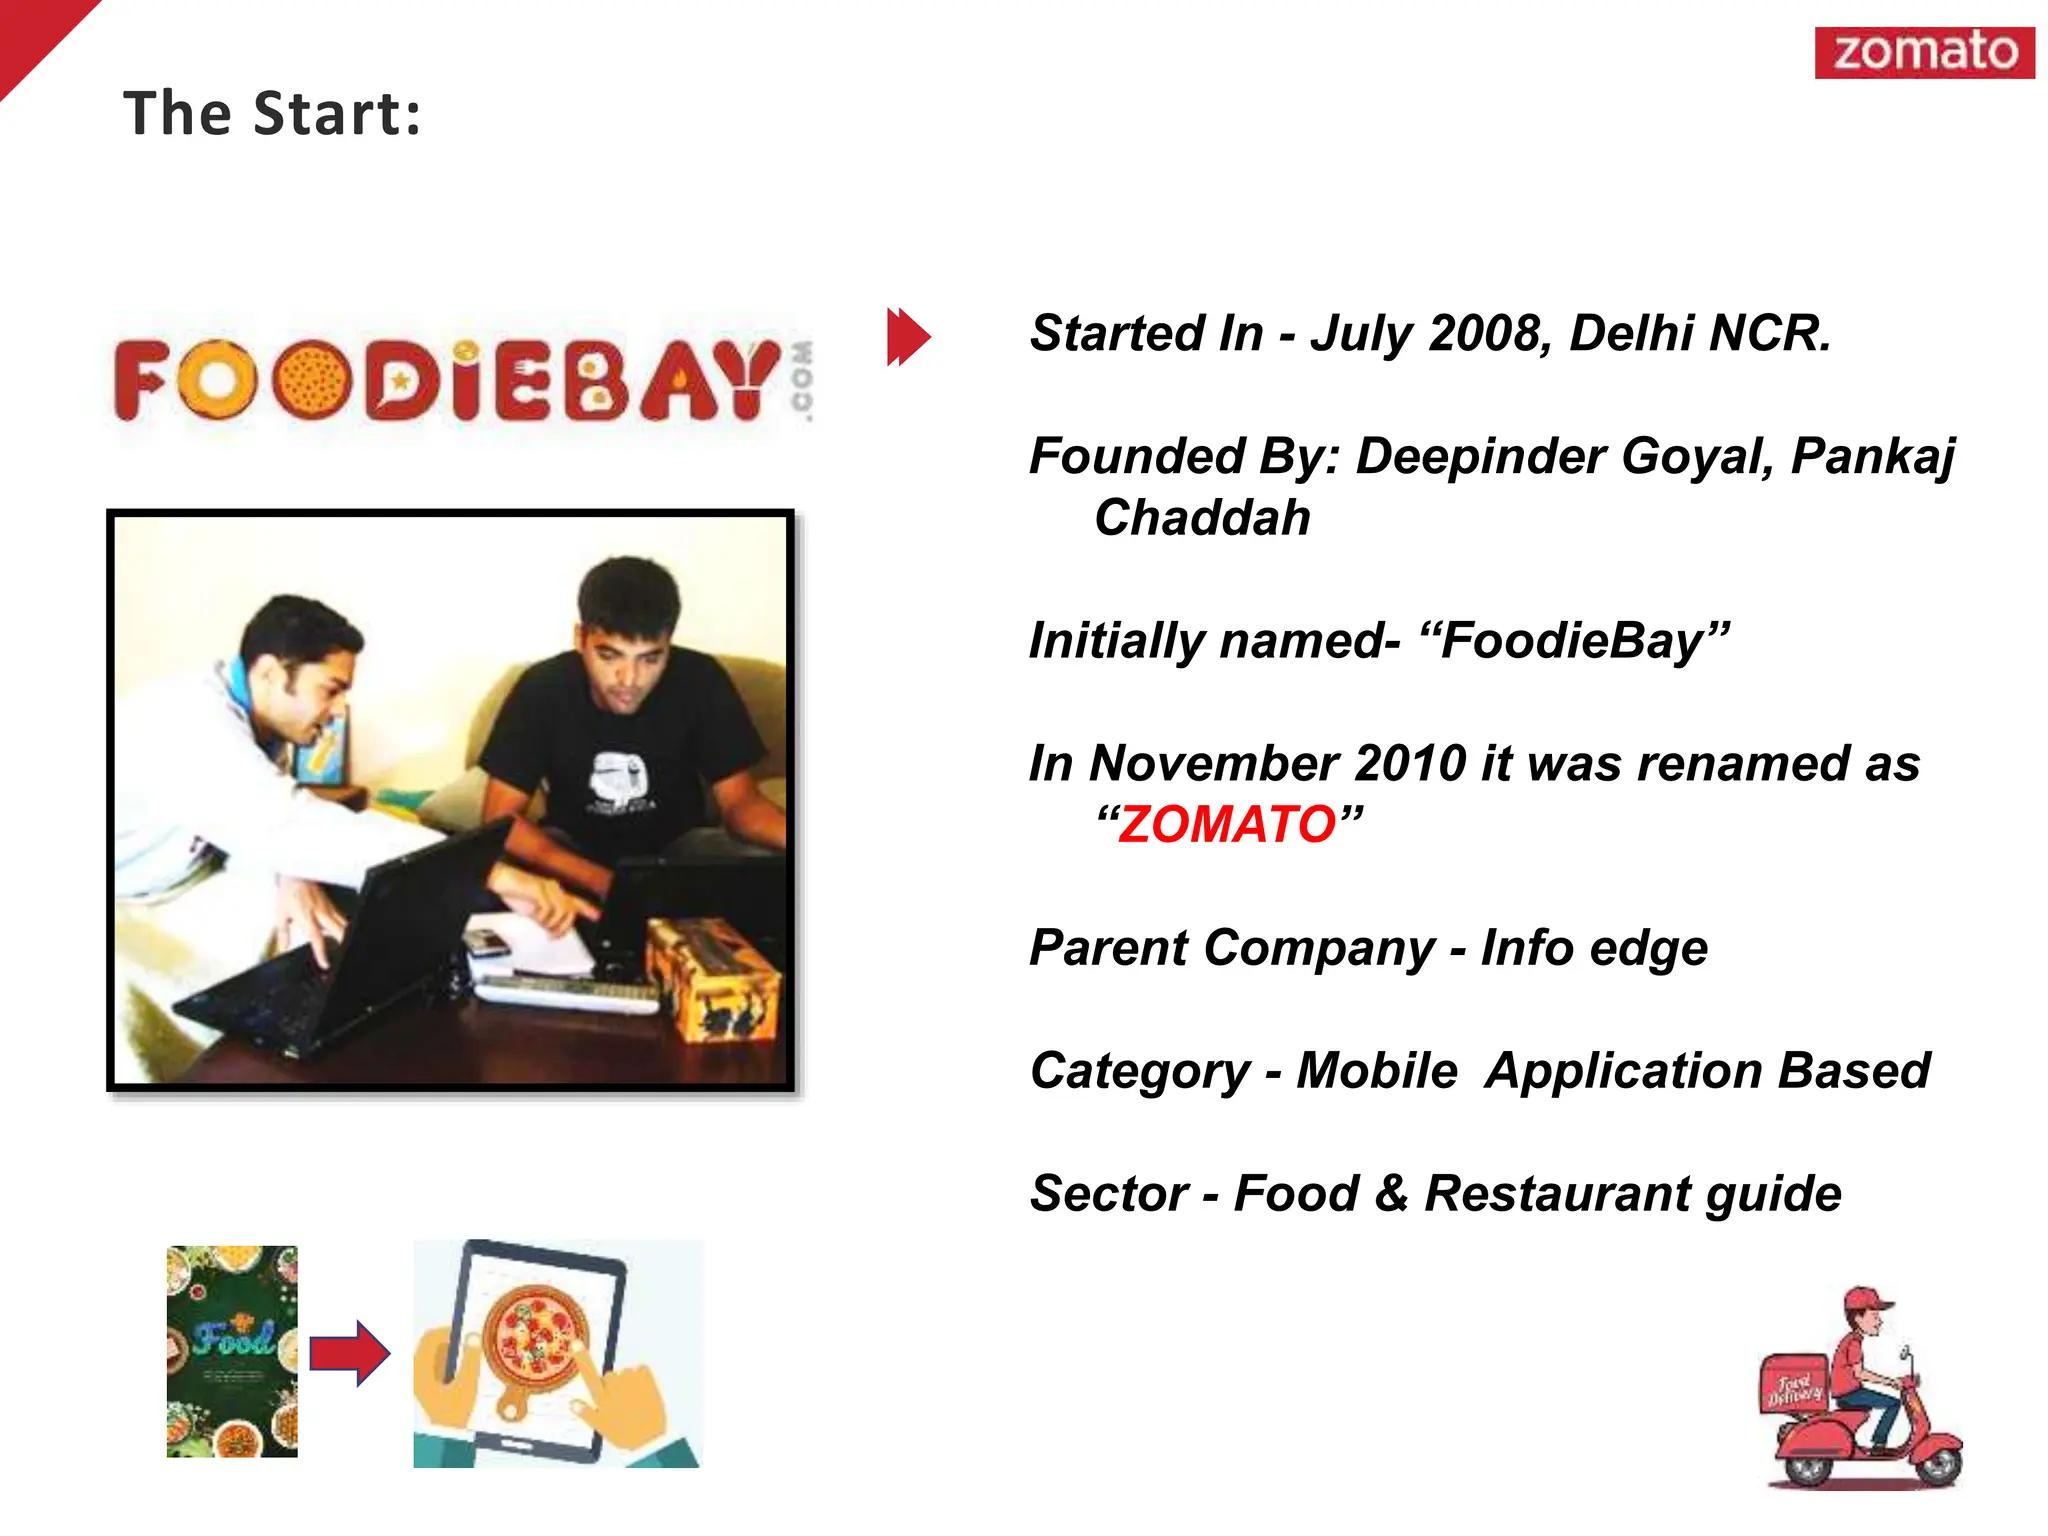
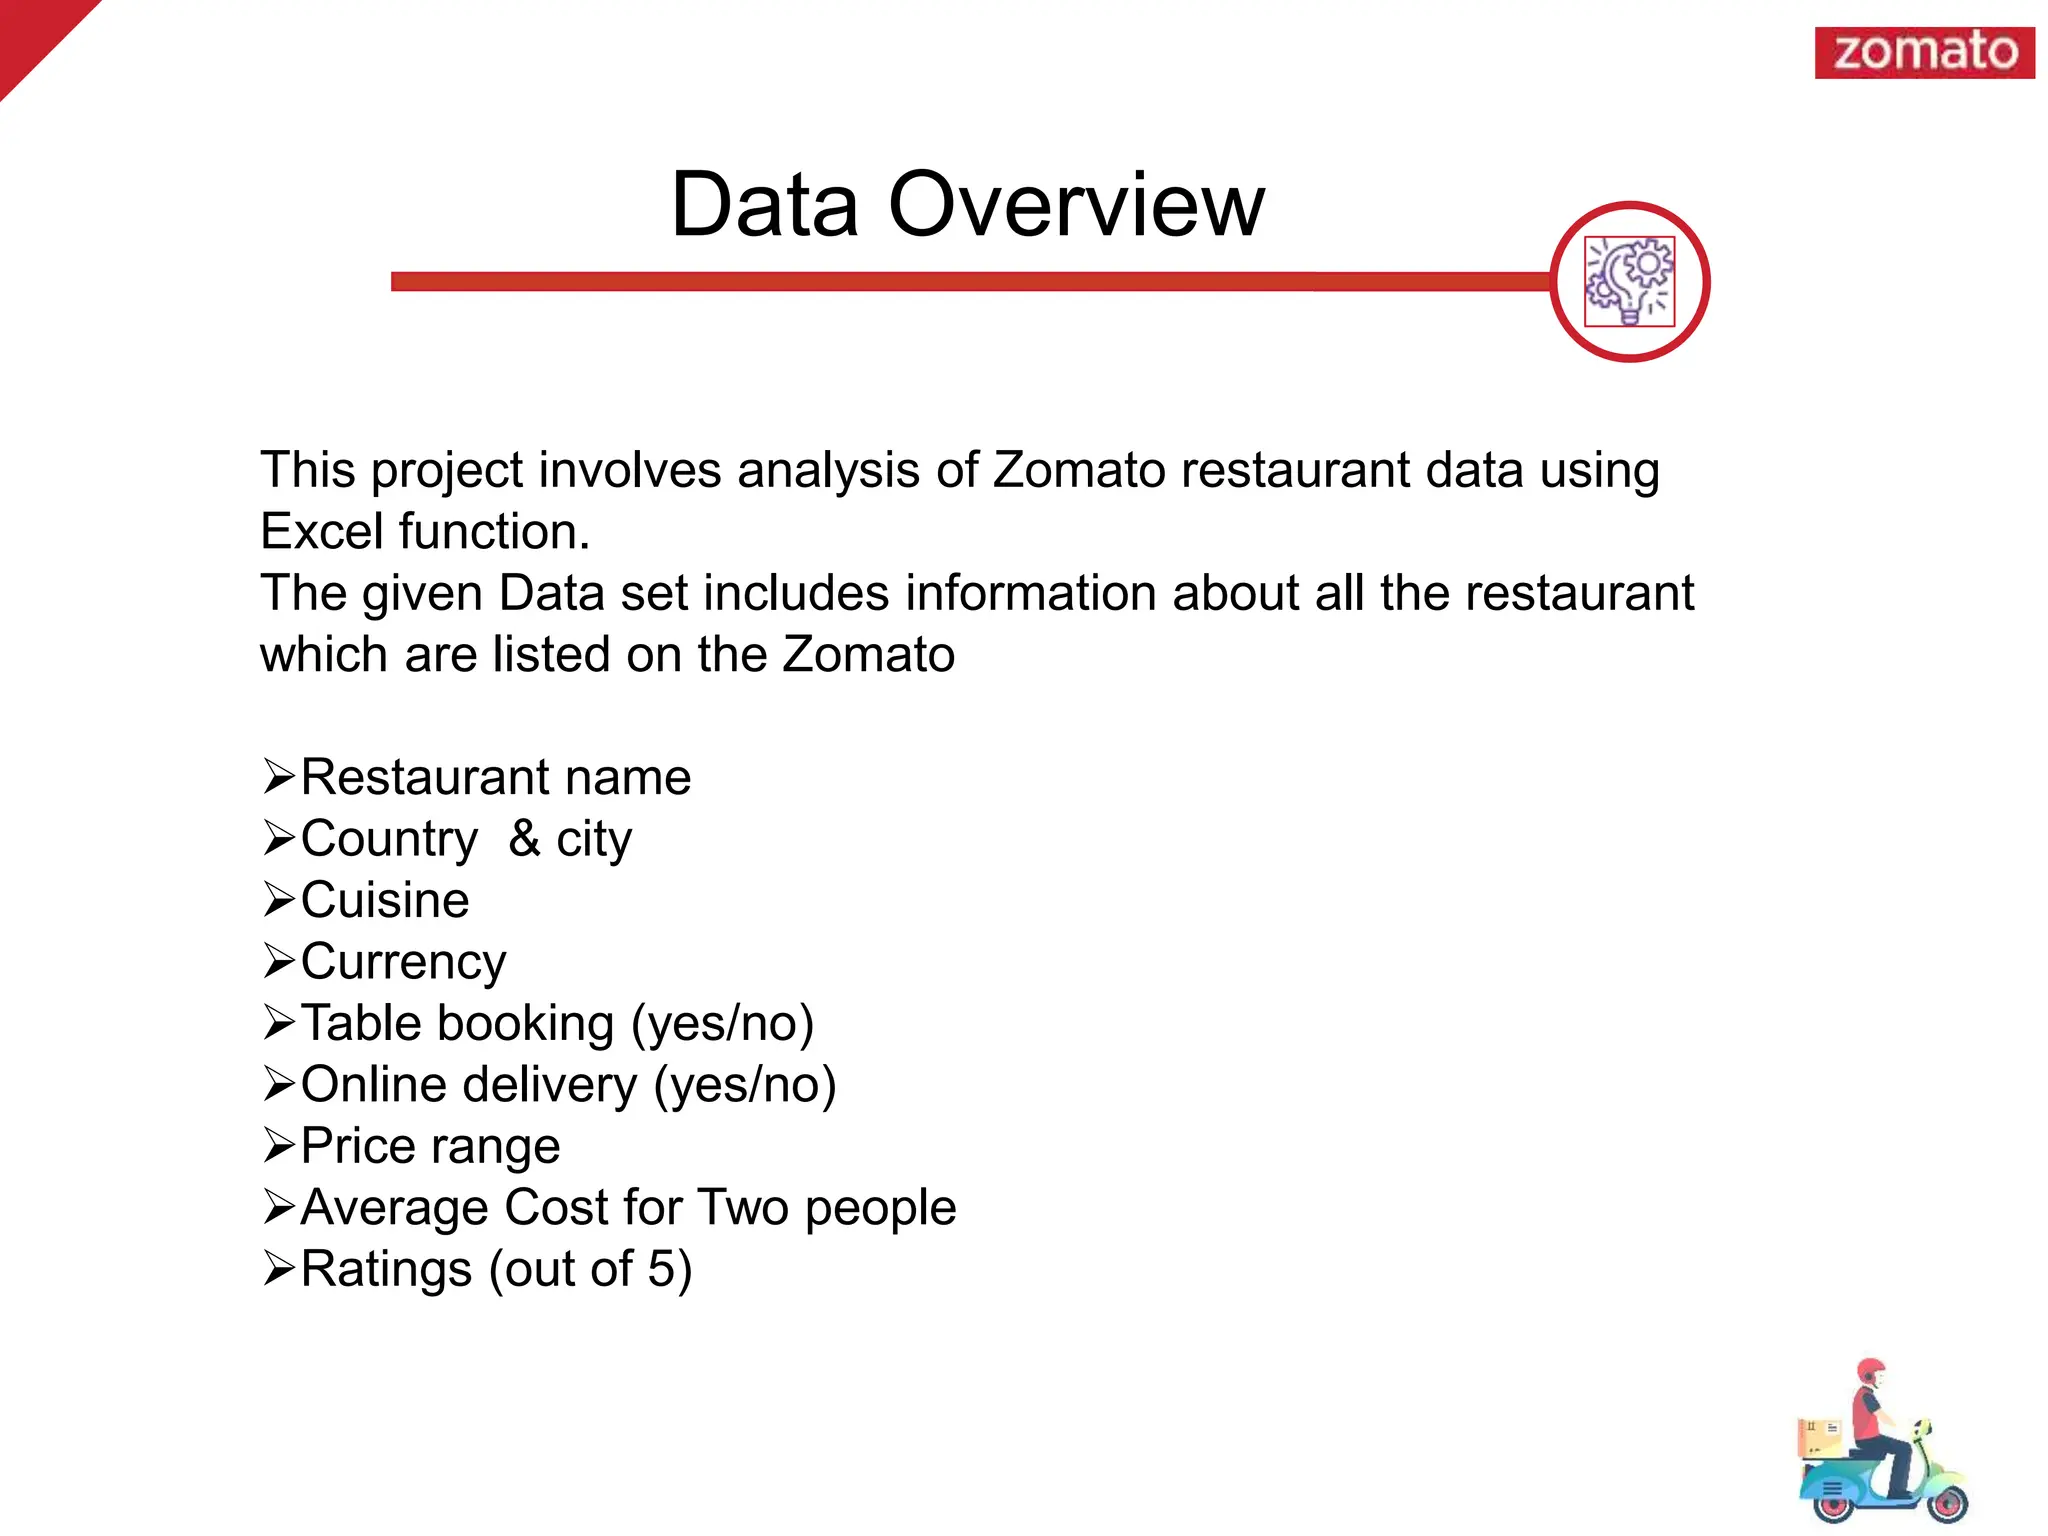
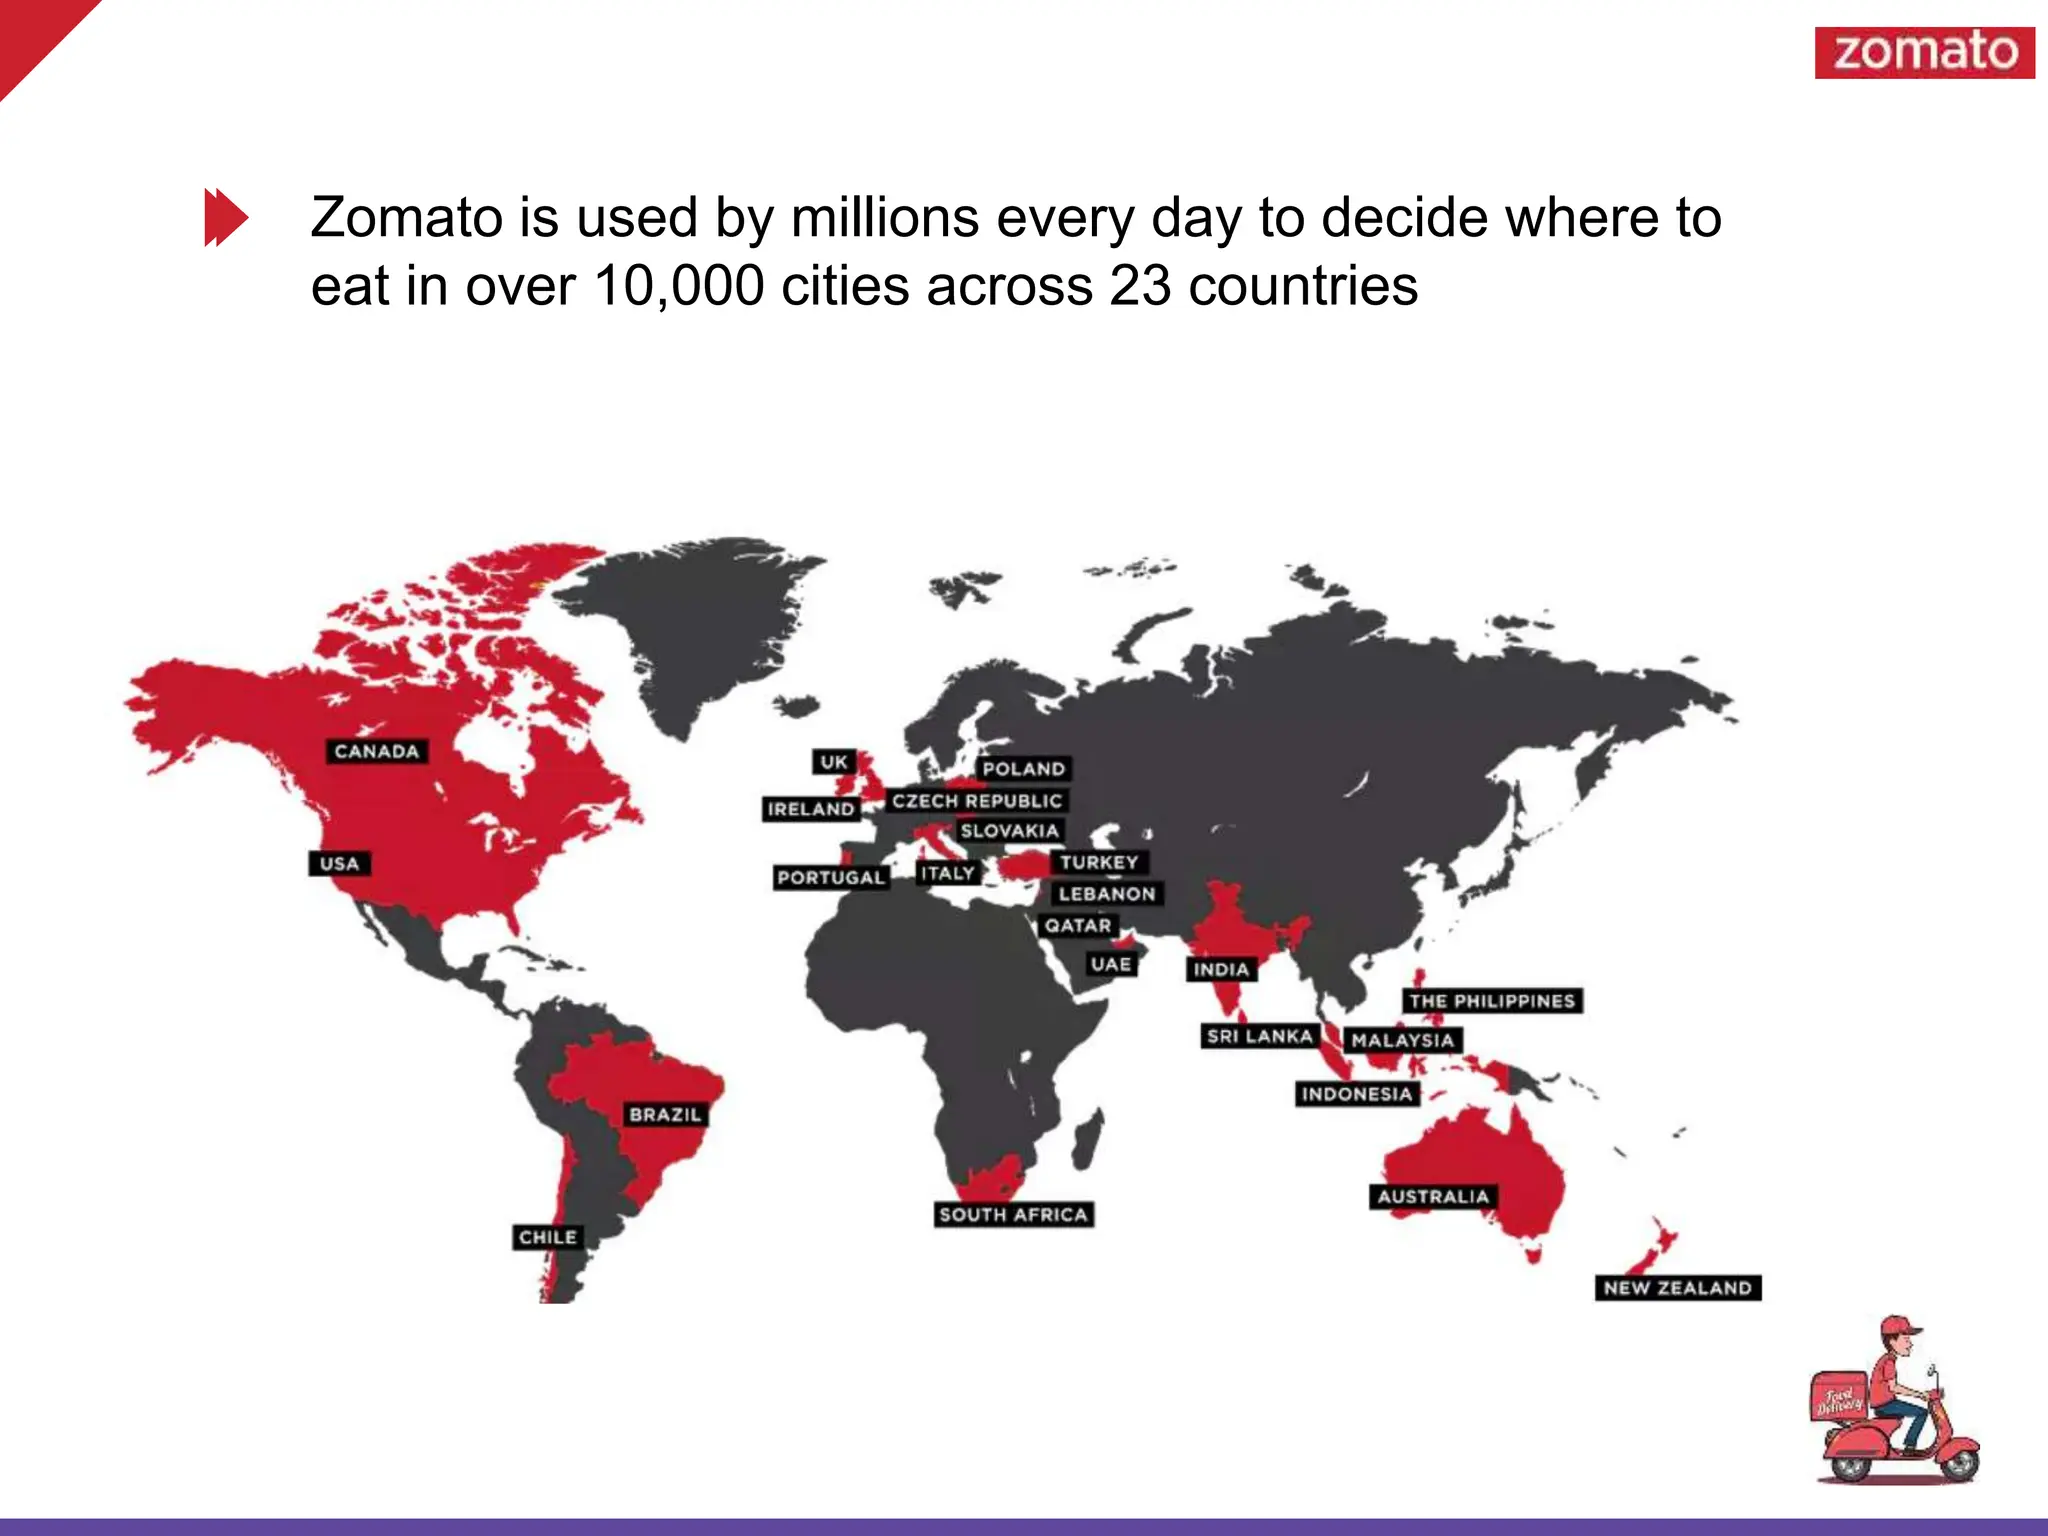
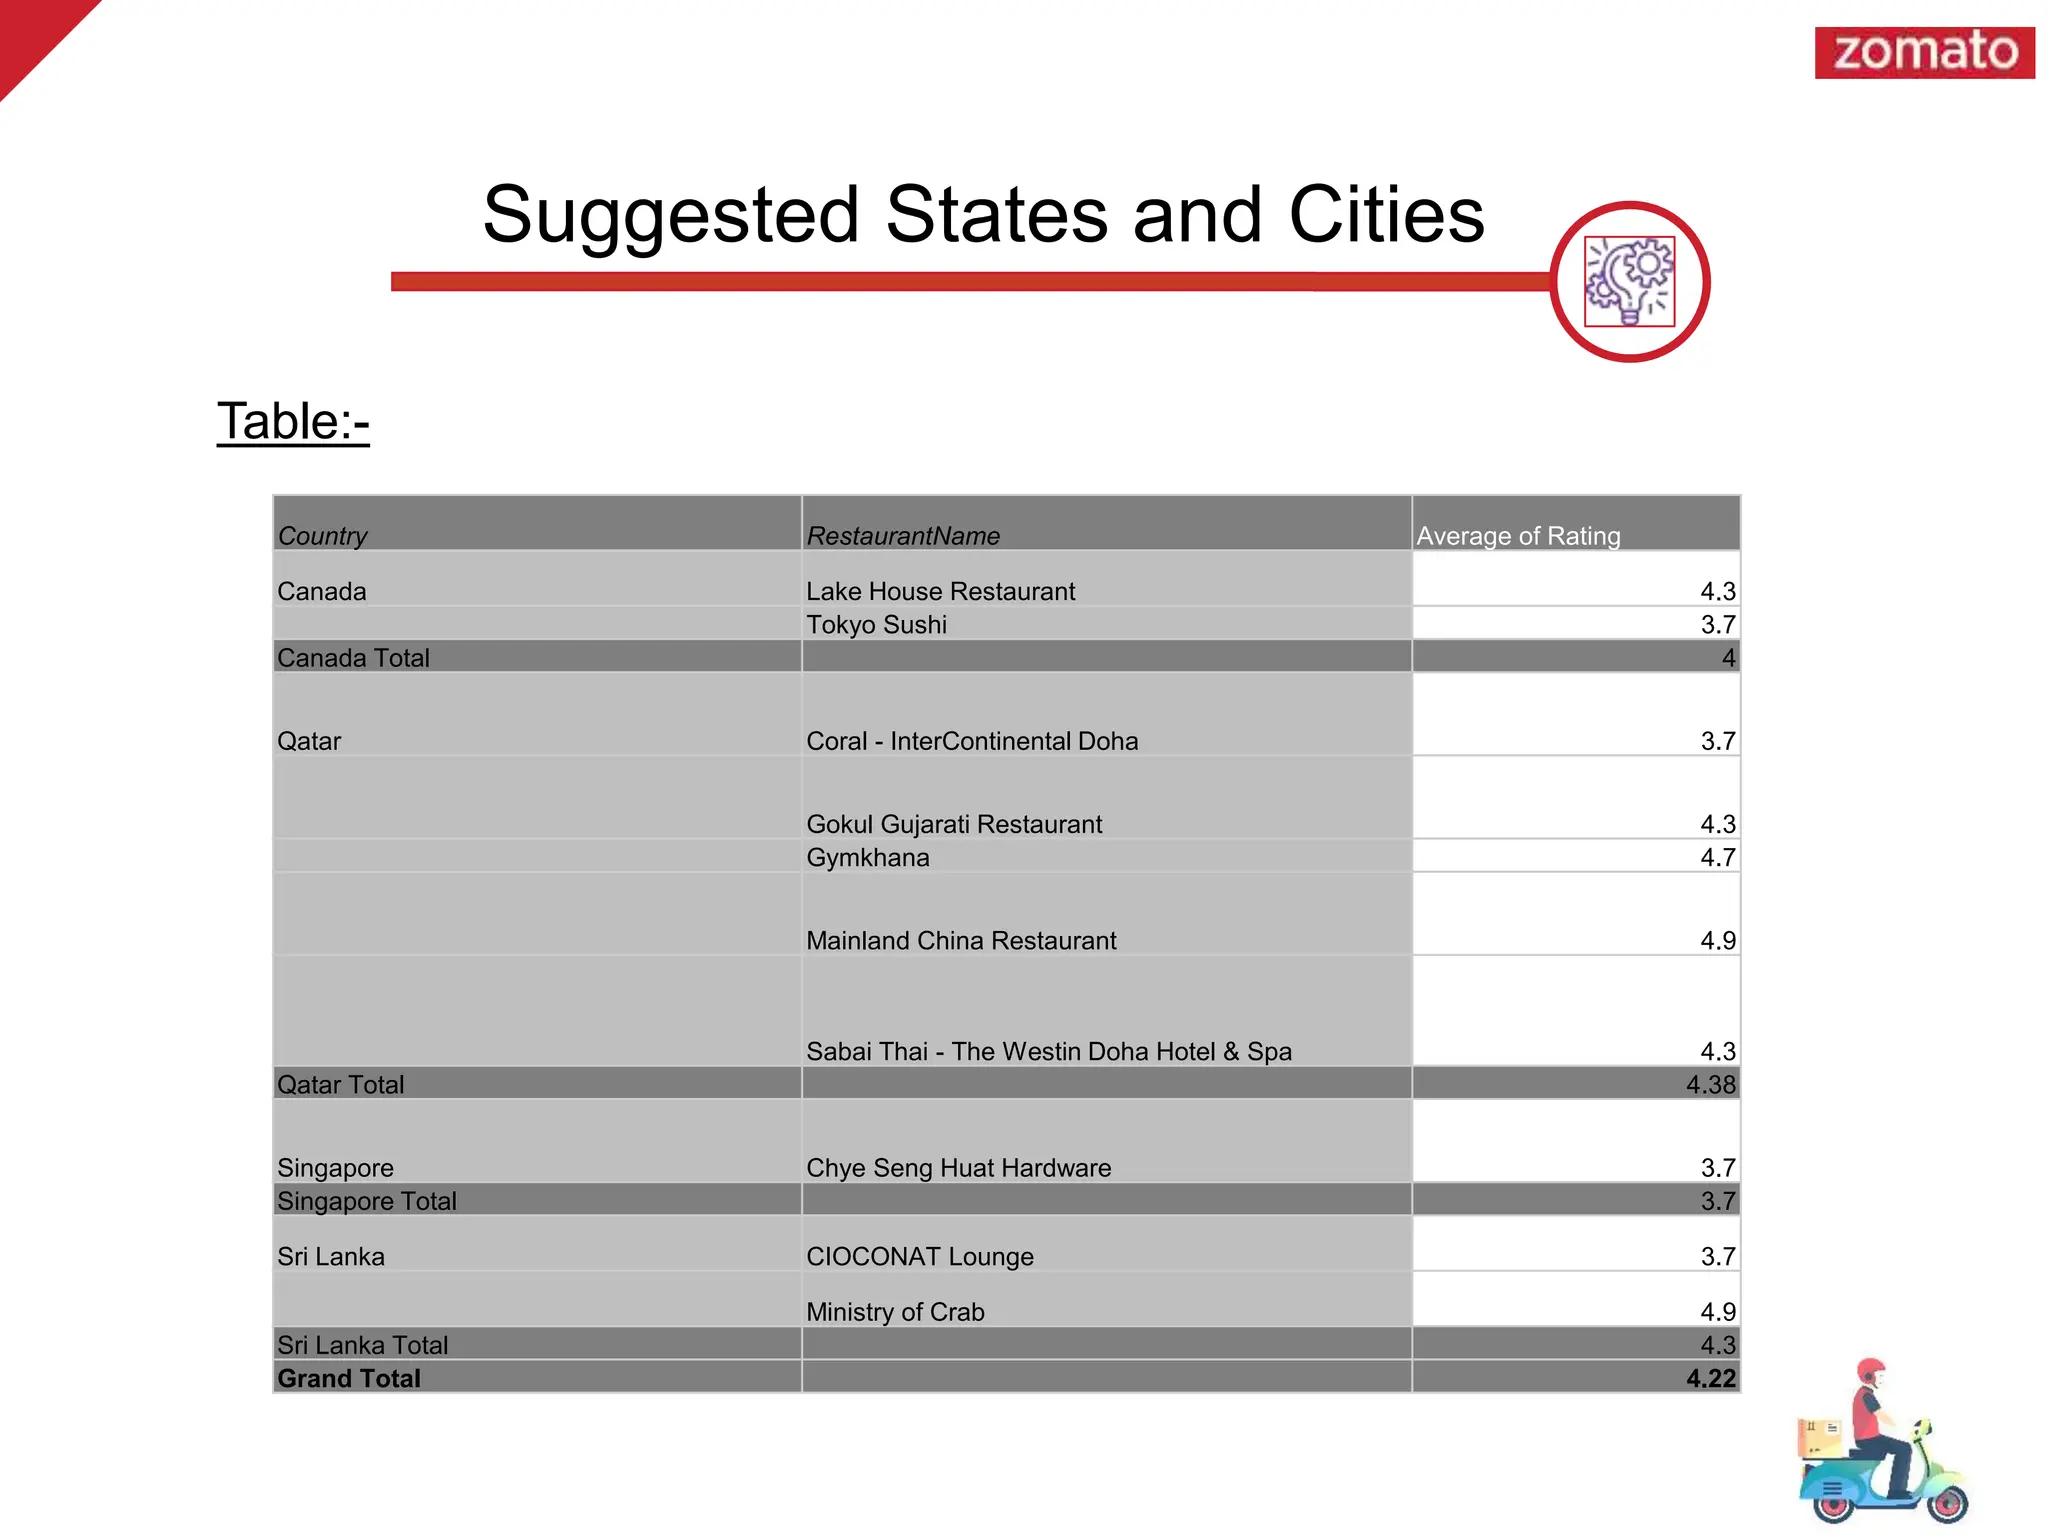
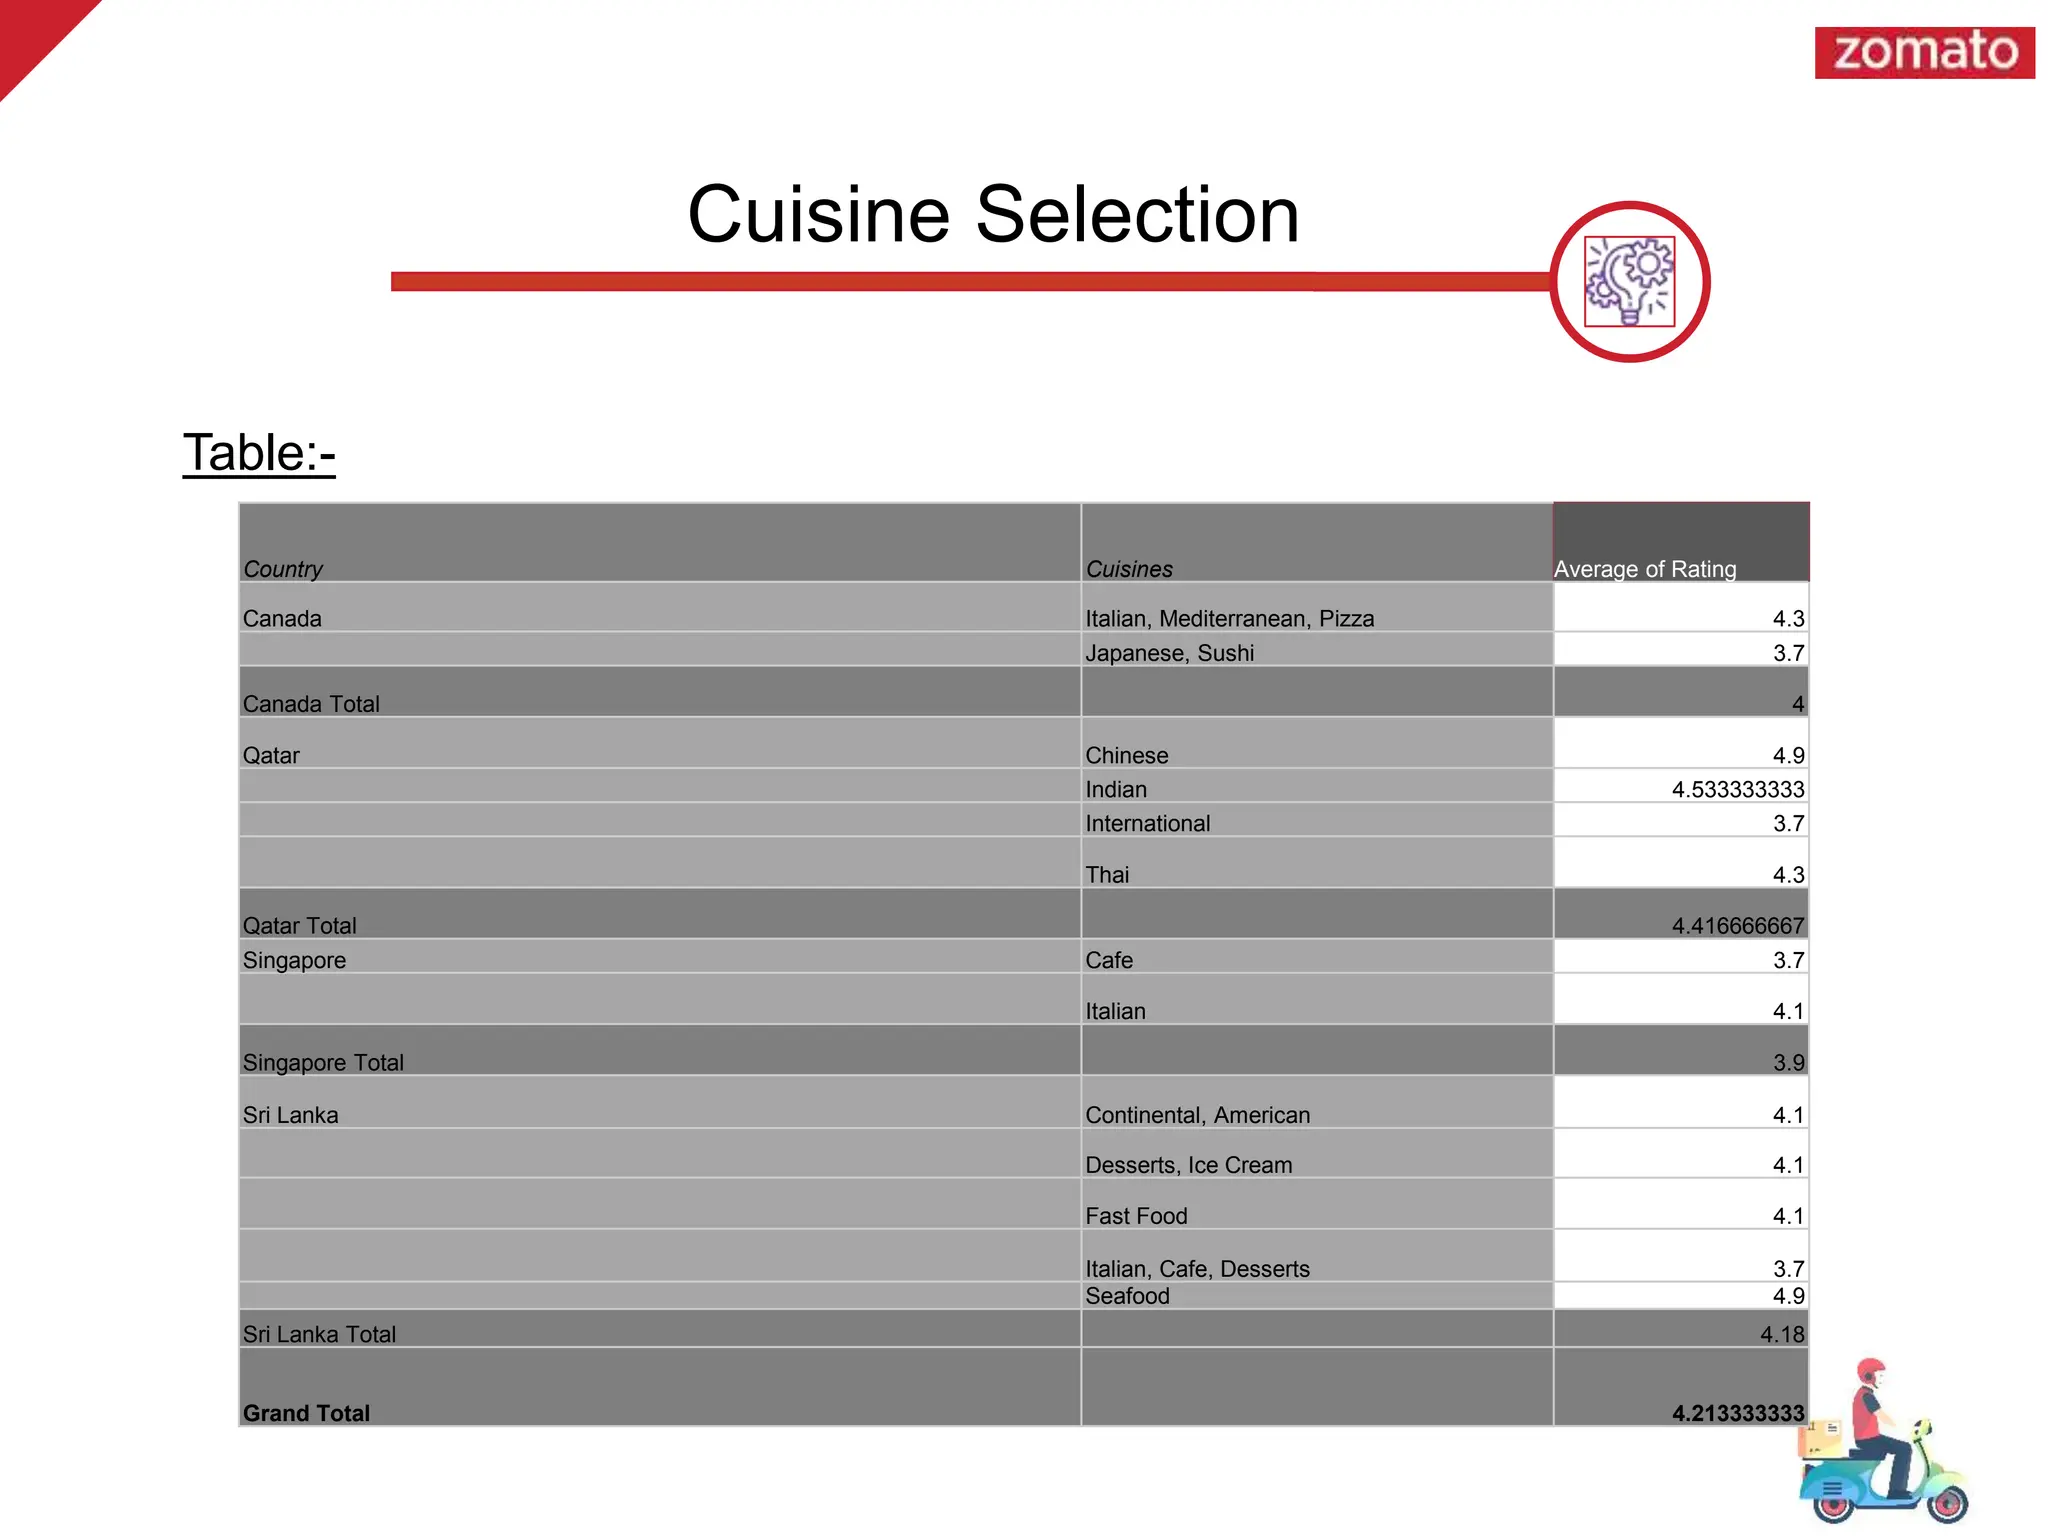
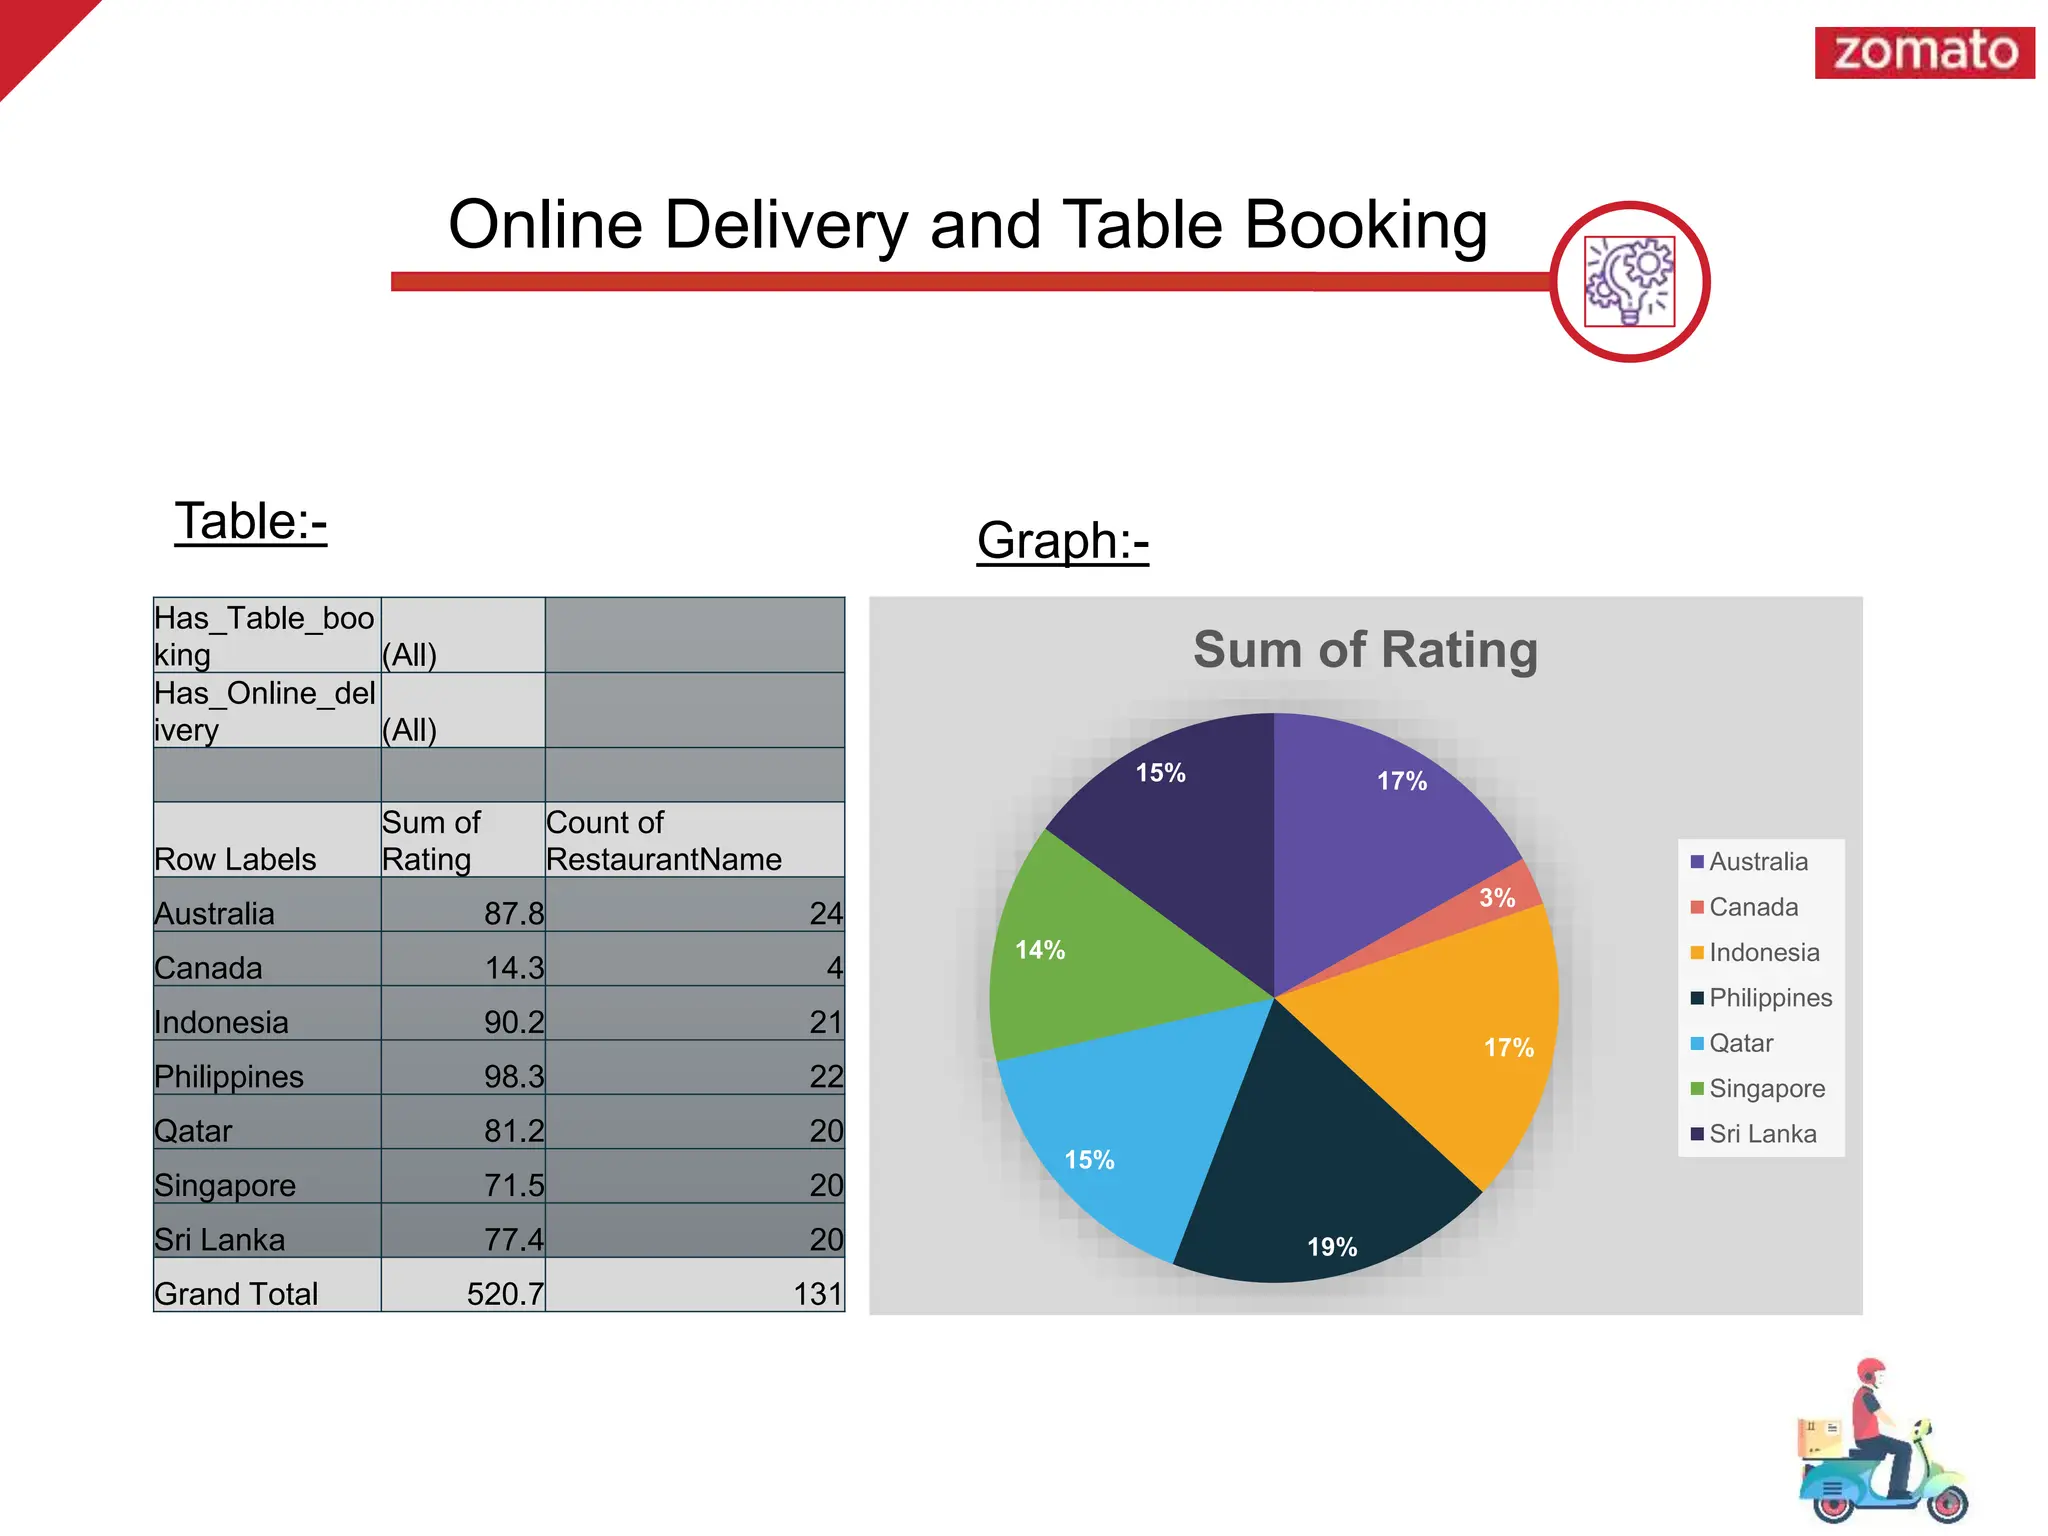
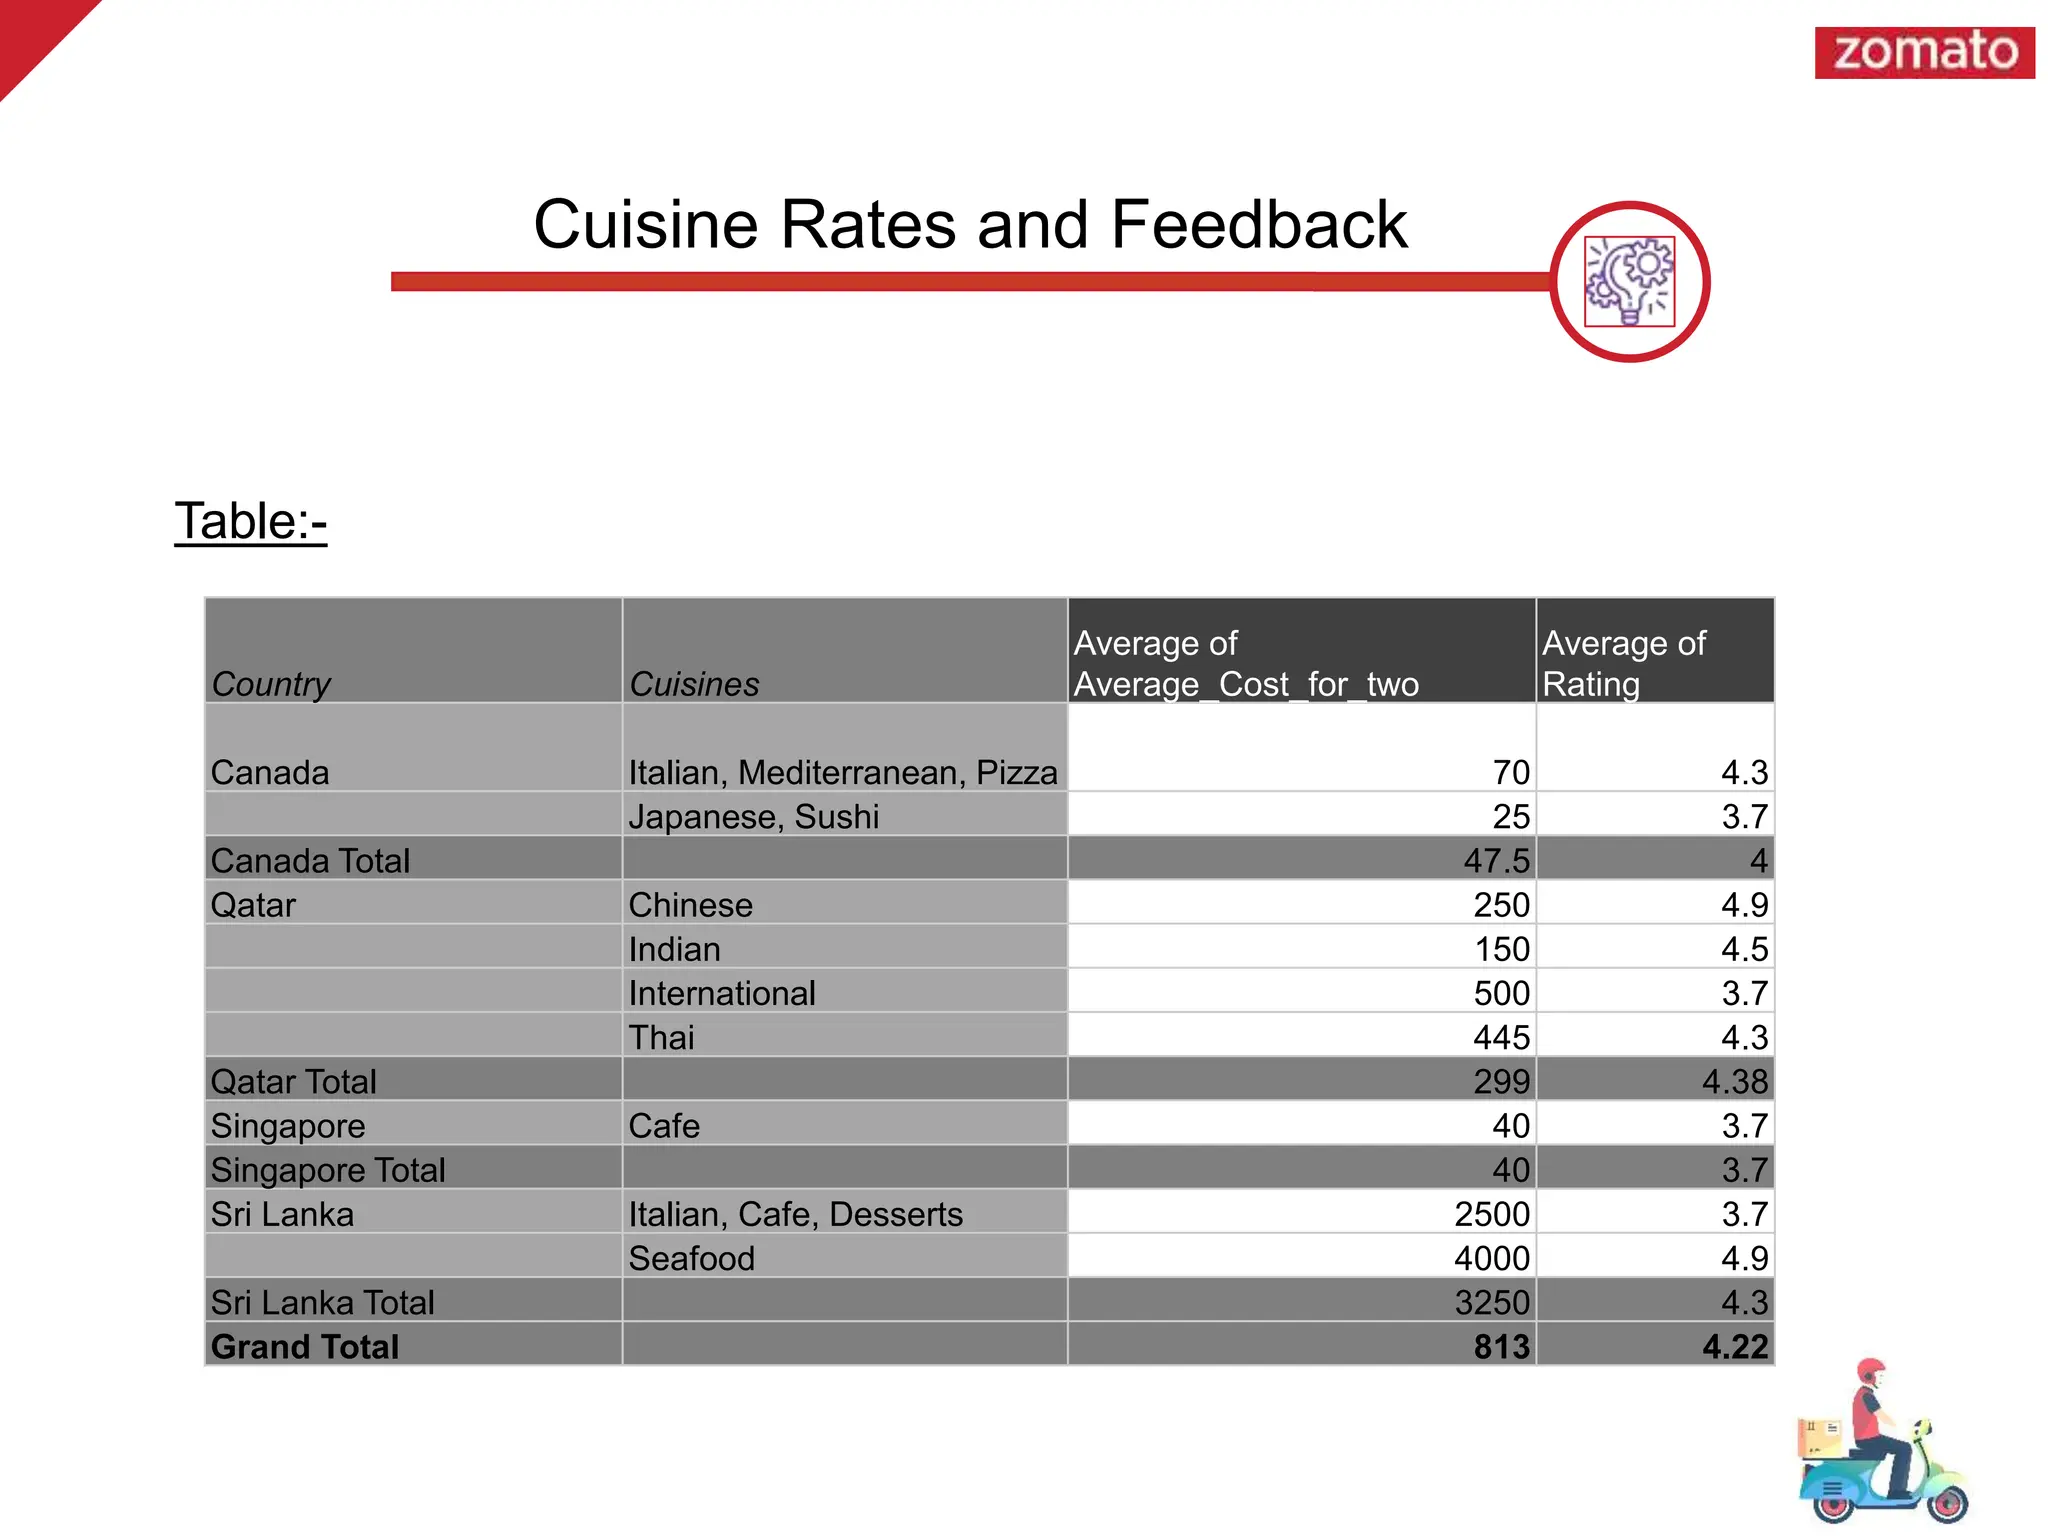
Zomato _By Himanshu
Maurya,
Sahil Ganjave &
Hardik Charkari
Data Mining &
Warehouse
Started In - July 2008, Delhi NCR.
Founded By: Deepinder Goyal, Pankaj
Chaddah
Initially named- “FoodieBay”
In November 2010 it was renamed as
“ZOMATO”
Parent Company - Info edge
Category - Mobile Application Based
Sector - Food & Restaurant guide
The Start:
Data Overview
This project involves analysis of Zomato restaurant data using
Excel function.
The given Data set includes information about all the restaurant
which are listed on the Zomato
Restaurant name
Country & city
Cuisine
Currency
Table booking (yes/no)
Online delivery (yes/no)
Price range
Average Cost for Two people
Ratings (out of 5)
Zomato is used by millions every day to decide where to
eat in over 10,000 cities across 23 countries
Cleaning process:- The given data contains inconsistent data and values so it
has to be cleaned.
Categorical and Continuous Data :-Understanding the nature of your data is
crucial for selecting the appropriate tools and techniques.
Visualization Techniques:- It helps in giving insights and make data driven
decisions. Excel provides variety of charting and formatting options to help you
create compelling and informative visualization.
LookUp Functions:- VLookUp function is used to combination with other data
to achieve required information or table. It is considered in cleaning process.
Average Rating Calculation:- Using this we can easily calculate average
ratings of restaurants based on price range, rating and availability of other
aspects like online delivery and . Methods like IF functions, logical operators,
and aggregation functions are used.
ANALYTICAL APPROACH AND TOOL
OBJECTIVE TASKS
ANALYSIS
Number of restaurants opened in each country.
Numbers of restaurants opened each year.
Places to open newer restaurants with lesser competition.
Total number of restaurants in India in the price range of 4.
Average number of voters for the restaurants in each country
The average rating for all the restaurants & restaurants that
have price range < 4 and provide online delivery.
Highlighting suggested places to open restaurants.
Row Labels Count of Restaurant
Australia 24
Brazil 60
Canada 4
India 8652
Indonesia 21
New Zealand 40
Philippines 22
Qatar 20
Singapore 20
South Africa 60
Sri Lanka 20
Turkey 34
United Arab Emirates 60
United Kingdom 80
United States of America 434
Grand Total 9551
24 60 4
8652
21 40 22 20 20 60 20 34 60 80 434
Total
Total
Number of restaurants opened in each country
Table:- Graph:-
Numbers of restaurants opened each
year
Row Labels Count of RestaurantName
2010 1080
2011 1098
2012 1022
2013 1061
2014 1051
2015 1024
2016 1027
2017 1086
2018 1102
Grand Total 9551
1080
1098
1022
1061
1051
1024
1027
1086
1102
980
1000
1020
1040
1060
1080
1100
1120
2010 2011 2012 2013 2014 2015 2016 2017 2018
Total
Total
Table:- Graph:-
Countries to open newer restaurants with lesser competition
Row Labels Count of RestaurantName
Australia 24
Canada 4
Indonesia 21
New Zealand 40
Philippines 22
Qatar 20
Singapore 20
Sri Lanka 20
Turkey 34
Grand Total 205
Australia, 24
Canada, 4
Indonesia, 21
New Zealand,
40
Philippines, 22
Qatar, 20
Singapore, 20
Sri Lanka, 20
Turkey, 34
TOTAL
Table:- Graph:-
Total number of restaurants in India in the price range of
4
Country India
Price range 4
Count of Restaurant Name
388
0
100
200
300
400
500
Total
Total
Table:- Graph:-
Table:- Graph:-
Average number of voters for the restaurants in each
country
Row Labels Average of Votes
Australia 111.4166667
Brazil 19.61666667
Canada 103
India 137.212552
Indonesia 772.0952381
New Zealand 243.025
Philippines 407.4090909
Qatar 163.8
Singapore 31.9
South Africa 315.1666667
Sri Lanka 146.45
Turkey 431.4705882
United Arab Emirates 493.5166667
United Kingdom 205.4875
United States of America 428.2211982
Grand Total 156.9097477
0
100
200
300
400
500
600
700
800
900
Total
Total
3.658333333,
10%
3.575, 10%
4.295238095,
12%
4.2625, 12%
4.468181818,
12%
4.06, 11%
3.575, 10%
3.87, 11%
4.3, 12%
Average of Rating
Australia
Canada
Indonesia
New Zealand
Philippines
Qatar
Singapore
Sri Lanka
Turkey
Average Rating
Row Labels Average of Rating
Count of
RestaurantName
Australia 3.658333333 24
Canada 3.575 4
Indonesia 4.295238095 21
New Zealand 4.2625 40
Philippines 4.468181818 22
Qatar 4.06 20
Singapore 3.575 20
Sri Lanka 3.87 20
Turkey 4.3 34
Grand Total 4.084878049 205
Table:- Chart:-
Table:- Graph:-
Price range 4
Has_Online_delivery Yes
Row Labels Average of Rating
India 3.888372093
United Arab Emirates 4.11
Grand Total 3.930188679
3.888372093
4.11
INDIA UNITED ARAB EMIRATES
Total
Total
The average rating for all the restaurants that have price range of
4 and provide online delivery.
Table:- Graph:-
Highlighting suggested places to open
restaurants
Row Labels Count of RestaurantName
Australia 24
Canada 4
Indonesia 21
New Zealand 40
Philippines 22
Qatar 20
Singapore 20
Sri Lanka 20
Turkey 34
Grand Total 205
Australia, 24
Canada, 4
Indonesia, 21
New Zealand,
40
Philippines, 22
Qatar, 20
Singapore, 20
Sri Lanka, 20
Turkey, 34
TOTAL
Subjective Tasks Analysis
Countries for new restaurants
Suggested States and Cities
Current Restaurants Ratings
Expenditure on Food
Competitor Analysis
Cuisine Selection
Online Delivery and Table Booking
Cuisine Rates and Feedback
Price Range Distribution
Table:- Graph:-
Countries for new restaurants
Row Labels Count of RestaurantName
Canada 4
Sri Lanka 20
Singapore 20
Qatar 20
Indonesia 21
Philippines 22
Australia 24
Turkey 34
New Zealand 40
South Africa 60
Brazil 60
Grand Total 325
Table:-
Suggested States and Cities
Country RestaurantName Average of Rating
Canada Lake House Restaurant 4.3
Tokyo Sushi 3.7
Canada Total 4
Qatar Coral - InterContinental Doha 3.7
Gokul Gujarati Restaurant 4.3
Gymkhana 4.7
Mainland China Restaurant 4.9
Sabai Thai - The Westin Doha Hotel & Spa 4.3
Qatar Total 4.38
Singapore Chye Seng Huat Hardware 3.7
Singapore Total 3.7
Sri Lanka CIOCONAT Lounge 3.7
Ministry of Crab 4.9
Sri Lanka Total 4.3
Grand Total 4.22
Table:-
Cuisine Selection
Country Cuisines Average of Rating
Canada Italian, Mediterranean, Pizza 4.3
Japanese, Sushi 3.7
Canada Total 4
Qatar Chinese 4.9
Indian 4.533333333
International 3.7
Thai 4.3
Qatar Total 4.416666667
Singapore Cafe 3.7
Italian 4.1
Singapore Total 3.9
Sri Lanka Continental, American 4.1
Desserts, Ice Cream 4.1
Fast Food 4.1
Italian, Cafe, Desserts 3.7
Seafood 4.9
Sri Lanka Total 4.18
Grand Total 4.213333333
Table:- Graph:-
Online Delivery and Table Booking
Has_Table_boo
king (All)
Has_Online_del
ivery (All)
Row Labels
Sum of
Rating
Count of
RestaurantName
Australia 87.8 24
Canada 14.3 4
Indonesia 90.2 21
Philippines 98.3 22
Qatar 81.2 20
Singapore 71.5 20
Sri Lanka 77.4 20
Grand Total 520.7 131
17%
3%
17%
19%
15%
14%
15%
Sum of Rating
Australia
Canada
Indonesia
Philippines
Qatar
Singapore
Sri Lanka
Table:-
Cuisine Rates and Feedback
Country Cuisines
Average of
Average_Cost_for_two
Average of
Rating
Canada Italian, Mediterranean, Pizza 70 4.3
Japanese, Sushi 25 3.7
Canada Total 47.5 4
Qatar Chinese 250 4.9
Indian 150 4.5
International 500 3.7
Thai 445 4.3
Qatar Total 299 4.38
Singapore Cafe 40 3.7
Singapore Total 40 3.7
Sri Lanka Italian, Cafe, Desserts 2500 3.7
Seafood 4000 4.9
Sri Lanka Total 3250 4.3
Grand Total 813 4.22
Table:- Graph:-
Price Range Distribution
Count of
RestaurantName
Column
Labels
Row Labels 1 2 3 4
Grand
Total
Australia 4 14 5 1 24
Canada 3 1 4
Indonesia 1 20 21
New Zealand 3 4 17 16 40
Philippines 1 12 9 22
Qatar 1 5 14 20
Singapore 1 5 14 20
Sri Lanka 6 11 3 20
Turkey 11 18 5 34
Grand Total 7 42 93 63 205
1
3
0
2
4
6
8
10
12
14
16
18
20
4
3
14
3
1
4
1 1 1
6
11
5
20
17
12
5 5
11
18
1 1
16
9
14 14
3
5
1
2
3
4
DASHBOARD
Pivot charts :- For visualization & analysis of different trends and
pattern.
Slicers :- Make data visualization interactive
Comparison of different aspects (like price range and rating)
Impacts of different set of entities on different entities (e.g. impact of
online delivery on rating)
Various analysis
Contents of dashboard
Strategies
Customer preference & Quality of cuisines
Market Competition & Growth potential
Online/Offline Presence & services
Conduct Survey
Cost Benefit Analysis
Conclusion
In a span of 13 years (2008 till 2023) Zomato became a
small-time restaurant booking Tech Company to a giant E-
com company.
As Zomato continues to expand its global footprint, it aims
to revolutionize the food delivery industry and enhance the
dining experience for customers worldwide.
With a focus on innovative technology and exceptional
customer service, Zomato seeks to solidify its position as a
leader in the food delivery and restaurant discovery sector.
From above study we can conclude the cities where we
can open new restaurants or food services for better
growth of the overall company.
_By Himanshu Maurya

zomato data mining datasets for quality prefernece and conntrol.pptx

  • 1.
    Zomato _By Himanshu Maurya, SahilGanjave & Hardik Charkari Data Mining & Warehouse
  • 2.
    Started In -July 2008, Delhi NCR. Founded By: Deepinder Goyal, Pankaj Chaddah Initially named- “FoodieBay” In November 2010 it was renamed as “ZOMATO” Parent Company - Info edge Category - Mobile Application Based Sector - Food & Restaurant guide The Start:
  • 3.
    Data Overview This projectinvolves analysis of Zomato restaurant data using Excel function. The given Data set includes information about all the restaurant which are listed on the Zomato Restaurant name Country & city Cuisine Currency Table booking (yes/no) Online delivery (yes/no) Price range Average Cost for Two people Ratings (out of 5)
  • 4.
    Zomato is usedby millions every day to decide where to eat in over 10,000 cities across 23 countries
  • 5.
    Cleaning process:- Thegiven data contains inconsistent data and values so it has to be cleaned. Categorical and Continuous Data :-Understanding the nature of your data is crucial for selecting the appropriate tools and techniques. Visualization Techniques:- It helps in giving insights and make data driven decisions. Excel provides variety of charting and formatting options to help you create compelling and informative visualization. LookUp Functions:- VLookUp function is used to combination with other data to achieve required information or table. It is considered in cleaning process. Average Rating Calculation:- Using this we can easily calculate average ratings of restaurants based on price range, rating and availability of other aspects like online delivery and . Methods like IF functions, logical operators, and aggregation functions are used. ANALYTICAL APPROACH AND TOOL
  • 6.
    OBJECTIVE TASKS ANALYSIS Number ofrestaurants opened in each country. Numbers of restaurants opened each year. Places to open newer restaurants with lesser competition. Total number of restaurants in India in the price range of 4. Average number of voters for the restaurants in each country The average rating for all the restaurants & restaurants that have price range < 4 and provide online delivery. Highlighting suggested places to open restaurants.
  • 7.
    Row Labels Countof Restaurant Australia 24 Brazil 60 Canada 4 India 8652 Indonesia 21 New Zealand 40 Philippines 22 Qatar 20 Singapore 20 South Africa 60 Sri Lanka 20 Turkey 34 United Arab Emirates 60 United Kingdom 80 United States of America 434 Grand Total 9551 24 60 4 8652 21 40 22 20 20 60 20 34 60 80 434 Total Total Number of restaurants opened in each country Table:- Graph:-
  • 8.
    Numbers of restaurantsopened each year Row Labels Count of RestaurantName 2010 1080 2011 1098 2012 1022 2013 1061 2014 1051 2015 1024 2016 1027 2017 1086 2018 1102 Grand Total 9551 1080 1098 1022 1061 1051 1024 1027 1086 1102 980 1000 1020 1040 1060 1080 1100 1120 2010 2011 2012 2013 2014 2015 2016 2017 2018 Total Total Table:- Graph:-
  • 9.
    Countries to opennewer restaurants with lesser competition Row Labels Count of RestaurantName Australia 24 Canada 4 Indonesia 21 New Zealand 40 Philippines 22 Qatar 20 Singapore 20 Sri Lanka 20 Turkey 34 Grand Total 205 Australia, 24 Canada, 4 Indonesia, 21 New Zealand, 40 Philippines, 22 Qatar, 20 Singapore, 20 Sri Lanka, 20 Turkey, 34 TOTAL Table:- Graph:-
  • 10.
    Total number ofrestaurants in India in the price range of 4 Country India Price range 4 Count of Restaurant Name 388 0 100 200 300 400 500 Total Total Table:- Graph:-
  • 11.
    Table:- Graph:- Average numberof voters for the restaurants in each country Row Labels Average of Votes Australia 111.4166667 Brazil 19.61666667 Canada 103 India 137.212552 Indonesia 772.0952381 New Zealand 243.025 Philippines 407.4090909 Qatar 163.8 Singapore 31.9 South Africa 315.1666667 Sri Lanka 146.45 Turkey 431.4705882 United Arab Emirates 493.5166667 United Kingdom 205.4875 United States of America 428.2211982 Grand Total 156.9097477 0 100 200 300 400 500 600 700 800 900 Total Total
  • 12.
    3.658333333, 10% 3.575, 10% 4.295238095, 12% 4.2625, 12% 4.468181818, 12% 4.06,11% 3.575, 10% 3.87, 11% 4.3, 12% Average of Rating Australia Canada Indonesia New Zealand Philippines Qatar Singapore Sri Lanka Turkey Average Rating Row Labels Average of Rating Count of RestaurantName Australia 3.658333333 24 Canada 3.575 4 Indonesia 4.295238095 21 New Zealand 4.2625 40 Philippines 4.468181818 22 Qatar 4.06 20 Singapore 3.575 20 Sri Lanka 3.87 20 Turkey 4.3 34 Grand Total 4.084878049 205 Table:- Chart:-
  • 13.
    Table:- Graph:- Price range4 Has_Online_delivery Yes Row Labels Average of Rating India 3.888372093 United Arab Emirates 4.11 Grand Total 3.930188679 3.888372093 4.11 INDIA UNITED ARAB EMIRATES Total Total The average rating for all the restaurants that have price range of 4 and provide online delivery.
  • 14.
    Table:- Graph:- Highlighting suggestedplaces to open restaurants Row Labels Count of RestaurantName Australia 24 Canada 4 Indonesia 21 New Zealand 40 Philippines 22 Qatar 20 Singapore 20 Sri Lanka 20 Turkey 34 Grand Total 205 Australia, 24 Canada, 4 Indonesia, 21 New Zealand, 40 Philippines, 22 Qatar, 20 Singapore, 20 Sri Lanka, 20 Turkey, 34 TOTAL
  • 15.
    Subjective Tasks Analysis Countriesfor new restaurants Suggested States and Cities Current Restaurants Ratings Expenditure on Food Competitor Analysis Cuisine Selection Online Delivery and Table Booking Cuisine Rates and Feedback Price Range Distribution
  • 16.
    Table:- Graph:- Countries fornew restaurants Row Labels Count of RestaurantName Canada 4 Sri Lanka 20 Singapore 20 Qatar 20 Indonesia 21 Philippines 22 Australia 24 Turkey 34 New Zealand 40 South Africa 60 Brazil 60 Grand Total 325
  • 17.
    Table:- Suggested States andCities Country RestaurantName Average of Rating Canada Lake House Restaurant 4.3 Tokyo Sushi 3.7 Canada Total 4 Qatar Coral - InterContinental Doha 3.7 Gokul Gujarati Restaurant 4.3 Gymkhana 4.7 Mainland China Restaurant 4.9 Sabai Thai - The Westin Doha Hotel & Spa 4.3 Qatar Total 4.38 Singapore Chye Seng Huat Hardware 3.7 Singapore Total 3.7 Sri Lanka CIOCONAT Lounge 3.7 Ministry of Crab 4.9 Sri Lanka Total 4.3 Grand Total 4.22
  • 18.
    Table:- Cuisine Selection Country CuisinesAverage of Rating Canada Italian, Mediterranean, Pizza 4.3 Japanese, Sushi 3.7 Canada Total 4 Qatar Chinese 4.9 Indian 4.533333333 International 3.7 Thai 4.3 Qatar Total 4.416666667 Singapore Cafe 3.7 Italian 4.1 Singapore Total 3.9 Sri Lanka Continental, American 4.1 Desserts, Ice Cream 4.1 Fast Food 4.1 Italian, Cafe, Desserts 3.7 Seafood 4.9 Sri Lanka Total 4.18 Grand Total 4.213333333
  • 19.
    Table:- Graph:- Online Deliveryand Table Booking Has_Table_boo king (All) Has_Online_del ivery (All) Row Labels Sum of Rating Count of RestaurantName Australia 87.8 24 Canada 14.3 4 Indonesia 90.2 21 Philippines 98.3 22 Qatar 81.2 20 Singapore 71.5 20 Sri Lanka 77.4 20 Grand Total 520.7 131 17% 3% 17% 19% 15% 14% 15% Sum of Rating Australia Canada Indonesia Philippines Qatar Singapore Sri Lanka
  • 20.
    Table:- Cuisine Rates andFeedback Country Cuisines Average of Average_Cost_for_two Average of Rating Canada Italian, Mediterranean, Pizza 70 4.3 Japanese, Sushi 25 3.7 Canada Total 47.5 4 Qatar Chinese 250 4.9 Indian 150 4.5 International 500 3.7 Thai 445 4.3 Qatar Total 299 4.38 Singapore Cafe 40 3.7 Singapore Total 40 3.7 Sri Lanka Italian, Cafe, Desserts 2500 3.7 Seafood 4000 4.9 Sri Lanka Total 3250 4.3 Grand Total 813 4.22
  • 21.
    Table:- Graph:- Price RangeDistribution Count of RestaurantName Column Labels Row Labels 1 2 3 4 Grand Total Australia 4 14 5 1 24 Canada 3 1 4 Indonesia 1 20 21 New Zealand 3 4 17 16 40 Philippines 1 12 9 22 Qatar 1 5 14 20 Singapore 1 5 14 20 Sri Lanka 6 11 3 20 Turkey 11 18 5 34 Grand Total 7 42 93 63 205 1 3 0 2 4 6 8 10 12 14 16 18 20 4 3 14 3 1 4 1 1 1 6 11 5 20 17 12 5 5 11 18 1 1 16 9 14 14 3 5 1 2 3 4
  • 22.
  • 23.
    Pivot charts :-For visualization & analysis of different trends and pattern. Slicers :- Make data visualization interactive Comparison of different aspects (like price range and rating) Impacts of different set of entities on different entities (e.g. impact of online delivery on rating) Various analysis Contents of dashboard
  • 24.
    Strategies Customer preference &Quality of cuisines Market Competition & Growth potential Online/Offline Presence & services Conduct Survey Cost Benefit Analysis
  • 25.
    Conclusion In a spanof 13 years (2008 till 2023) Zomato became a small-time restaurant booking Tech Company to a giant E- com company. As Zomato continues to expand its global footprint, it aims to revolutionize the food delivery industry and enhance the dining experience for customers worldwide. With a focus on innovative technology and exceptional customer service, Zomato seeks to solidify its position as a leader in the food delivery and restaurant discovery sector. From above study we can conclude the cities where we can open new restaurants or food services for better growth of the overall company. _By Himanshu Maurya