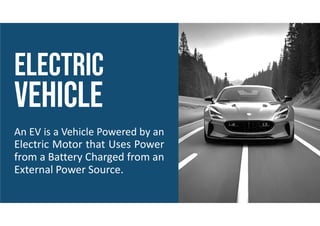
An EV isa Vehicle Powered by an
Electric Motor that Uses Power
from a Battery Charged from an
External Power Source.
6.
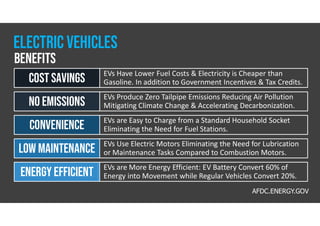
EVs Have LowerFuel Costs & Electricity is Cheaper than
Gasoline. In addition to Government Incentives & Tax Credits.
Cost Savings
EVs Produce Zero Tailpipe Emissions Reducing Air Pollution
Mitigating Climate Change & Accelerating Decarbonization.
No Emissions
EVs are Easy to Charge from a Standard Household Socket
Eliminating the Need for Fuel Stations.
Convenience
EVs Use Electric Motors Eliminating the Need for Lubrication
or Maintenance Tasks Compared to Combustion Motors.
Low Maintenance
EVs are More Energy Efficient: EV Battery Convert 60% of
Energy into Movement while Regular Vehicles Convert 20%.
Energy Efficient
Benefits
Electric vehicles
AFDC.ENERGY.GOV
7.
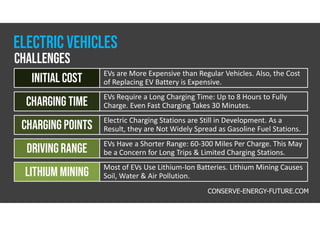
EVs are MoreExpensive than Regular Vehicles. Also, the Cost
of Replacing EV Battery is Expensive.
initial cost
EVs Require a Long Charging Time: Up to 8 Hours to Fully
Charge. Even Fast Charging Takes 30 Minutes.
charging time
Electric Charging Stations are Still in Development. As a
Result, they are Not Widely Spread as Gasoline Fuel Stations.
Charging points
EVs Have a Shorter Range: 60-300 Miles Per Charge. This May
be a Concern for Long Trips & Limited Charging Stations.
Drivingrange
Most of EVs Use Lithium-Ion Batteries. Lithium Mining Causes
Soil, Water & Air Pollution.
Lithium mining
Challenges
Electric vehicles
CONSERVE-ENERGY-FUTURE.COM
9.
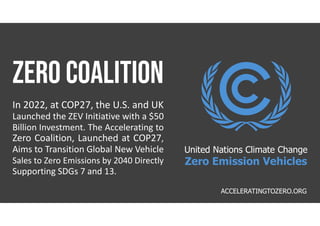
In 2022, atCOP27, the U.S. and UK
Launched the ZEV Initiative with a $50
Billion Investment. The Accelerating to
Zero Coalition, Launched at COP27,
Aims to Transition Global New Vehicle
Sales to Zero Emissions by 2040 Directly
Supporting SDGs 7 and 13.
ACCELERATINGTOZERO.ORG
United Nations Climate Change
Zero Emission Vehicles
10.
This is aplaceholder text. This text
can be replaced with your own text.
This text can be replaced with your
own text. This is a placeholder text.
This text can be replaced with your
own text. This text can be replaced
with your own text.
9.7
6.6
4.1
3.6
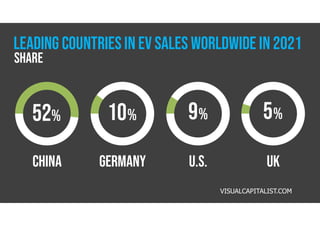
CHINA
THIS IS APLACEHOLDERTEXT.
THIS TEXTCAN BE REPLACED
WITH YOUR OWN TEXT.
GERMANY
THIS IS A
PLACEHOLD
U.S.
THIS IS A
PLACEHOLD
UK
THIS IS A
PLACEHOLD
52% 10% 9% 5%
VISUALCAPITALIST.COM
Leading countriesin EV SALES WORLDWIDE in 2021
share
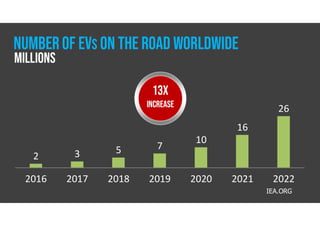
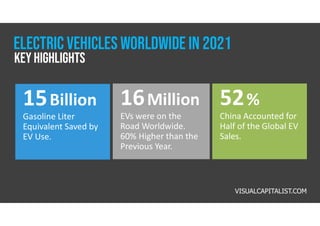
16Million
EVs were onthe
Road Worldwide.
60% Higher than the
Previous Year.
52%
China Accounted for
Half of the Global EV
Sales.
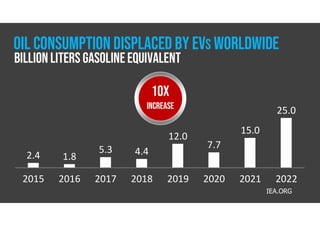
15Billion
Gasoline Liter
Equivalent Saved by
EV Use.
VISUALCAPITALIST.COM
Electric vehicles WORLDWIDE in 2021
Key highlights
18.
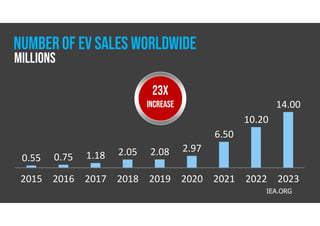
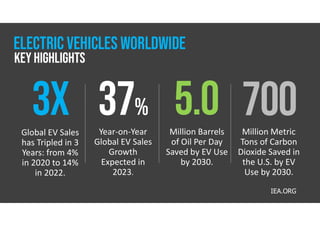
Year-on-Year
Global EV Sales
Growth
Expectedin
2023.
%
Global EV Sales
has Tripled in 3
Years: from 4%
in 2020 to 14%
in 2022.
Million Metric
Tons of Carbon
Dioxide Saved in
the U.S. by EV
Use by 2030.
Million Barrels
of Oil Per Day
Saved by EV Use
by 2030.
IEA.ORG
Electric Vehicles worldwide
Key highlights