SlideShare a Scribd company logo
Original Research Articles
Widening Racial and Ethnic Disparities in AIDS
Incidence in Salt Lake City-Ogden, Utah, 1990-2000
Erika K. Barth Cottrell, MPP, Sang Lim Lee, MA, and Eric N.
Reither, PhD
The Effect of Palliative Care Inpatients on the Agency
for Healthcare Research and Quality Inpatient
Quality Indicators (AHRQ IQIs) for In-hospital
Mortality Rates: A Utah Case Study
Carol Masheter, PhD
Cancer Incidence and Mortality Trends in Utah:
1973-2004
Antoinette M. Stroup, PhD, Rosemary Dibble, CTR, and C.
Janna Harrell, MS
Variations in Rates of Gestational Diabetes Between
Asian American and Pacific Islander Mothers in Utah
Brenda Ralls, PhD, William F. Stinner, PhD, Gulzar H. Shah,
MStat, MSS, PhD, Richard Bullough, PhD, Fahina Pasi, BS,
Jeffrey Duncan, MS, and Marie Aschliman, Analyst
Birth Order and Other Sociodemographic Factors
Influencing Immunization Status of Children in Utah:
A Cohort Study Using Utah Statewide Immunization
Information System and Vital Records Data
Sandra K. Schulthies, MS and Yukiko Yoneoka, MS
Episiotomy and Obstetric Trauma in Utah: Evidence
from Linked Hospital Discharge and Birth Data
Gulzar H. Shah, M. Stat, MSS, PhD; Pamela A. Clarkson
Freeman, PhD, MSW; Syed Rafay Ahmed, BSc Honors;
Michael Varner, MD; and Wu Xu, PhD
Special Topic - Obesity
Obesity in America and in Utah
Rebecca L. Utz, PhD, and Norman J. Waitzman, PhD
Trends and Variability in Utah’s Obesity Rates, 2006
Michael Friedrichs, MS
The Distribution and Determinants of Overweight
Among Adolescents in the Intermountain West
Eric N. Reither, PhD, Hyojun Park, MA, Nao Xiong, MA, and
Matthew McCabe
Maternal Obesity in Utah
Laurie Baksh, MPH
Preventing Obesity and Managing Its Consequences:
Wellness Programs and Primary Care
Julie Day, MD; Annie Sheets Mervis, MSW;
Michael Magill, MD
“Eat & Live Well”: Lessons Learned from an After
School Weight Management Program
Rebecca Utz, PhD, Darrin Cottle, MS, Kori Fitschen, BS,
Julie Metos, MPH, RD, CD, Justine Reel, PhD, Nicole L.
Mihalopoulos, MD, MPH
The Road To The Utah Partnership For Healthy
Weight (UPHW) and Coordinated Efforts to Reduce
Overweight and Obesity in Utah
Richard C. Bullough, PhD
Health Policy
2008 Utah Legislative Review
Aaron S. Larson, MPA-HSA
2008 Utah Health Data Review
10
17
25
33
39
44
54
56
64
72
Utah’s Health: An Annual Review
April 2008 | Volume 13
UH Review 2008
www.uhreview.com
78
81
88
94
111
Executive Editors
Michael L. Young, MBA, MHA
Editor-in-Chief
Justin Caron, Honors BS
Managing Editor
Daisy Krakowiak, BS
Articles Editor
Alison Edwards, M. Stat
Data Editor
Anna Reeves
Production Editor
Aaron Larson, MPA
Legislative Correspondent
Isaac Paulsen
Advisory Board Liaison
Safia Ahmed
Associate Managing Editor
Sarah Watts, BS
Associate Production Editor
Editorial Board Members
Donya Mohebali
Melody Perez-Ollerton
Acknowledgement
We would like to thank Dr. Richard Sperry for his continued support and
guidance, the University of Utah Publications Council and the Governor
Scott M. Matheson Center for Healthcare Studies for their financial support,
and the ARUP Institute for Clinical and Experimental Pathology®
and
Intermountain Healthcare for their generous donations.
Faculty Advisor
Richard Sperry, MD, PhD
Governor Scott M. Matheson Presidential Endowed Chair in Health
Policy Management
Advisory Board Members
Lawrence J. Cook, M. Stat
Computer Professional, Pediatric Critical Care, University of Utah
School of Medicine
Jean A. Dyer, PhD
Dean, School of Nursing, Westminster College
Marlene Egger, PhD
Professor, Family & Preventive Medicine, University of Utah
Gena Fletcher, MS
Research Analyst, Pediatric Inpatient Medicine, University of Utah
School of Medicine
Leslie Francis, PhD
Dean, College of Humanities, Alfred C. Emery Professor of Law
Robert Paul Huefner, PhD
Professor Emeritus, Political Science, University of Utah
Carol Masheter, PhD
Epidemiologist, Office of Health Care Statistics, Utah Department of
Health
Michael B. Mundorff, MBA, MHSA
Data Project Manager, Primary Children’s Medical Center
Maureen Murtaugh, PhD, RD
Associate Professor, Division of Clinical Epidemiology, Department
of Internal Medicine, University of Utah
Ginette A. Pepper, PhD, RN, FAAN
Professor, College of Nursing, University of Utah
Pamela S. Perlich, PhD
Senior Research Economist, Bureau of Economic and Business
Research, University of Utah
Lucy Savitz, PhD, MBA
Senior Scientist, Intermountain Healthcare
Debra Scammon, PhD
Emma Eccles Jones Professor of Marketing, David Eccles School of
Business, University of Utah
Gulzar H. Shah, PhD, MStat, MSS
Director of Research, National Association of Health Data
Organization; Family and Preventive Medicine, University of Utah
Xiaomeng Sheng, PhD
Research Assistant Professor, Family and Preventive Medicine,
University of Utah
Julia Summerhays, MS
Graduate Assistant and Doctoral Candidate, Health Promotion and
Education, University of Utah
J. Michele Stuart, PhD
Assistant Professor, Department of Pathology, University of Utah
Rebecca Utz, PhD
Associate Professor, Department of Sociology, University of Utah  
Norman J. Waitzman, PhD
Professor, Department of Economics, University of Utah
Lisa Wyman, MPH
Utah Department of Health
Utah’s Health: An Annual Review
Utah’s Health:
An Annual Review
Volume 13
www.uhreview.com
A Publication of the University of Utah
2008 Utah’s Health: An Annual Review
©2008 The University of Utah. All Rights Reserved.
Introduction & Editor’s Note
It is with great pleasure and excitement that I present the thirteenth volume of Utah’s Health: An Annual Review, on behalf of
the 2007-08 Editorial Board. As a scientific journal, Utah’s Health is dedicated to publishing original health-related research, and
reporting and analyzing health-related data. We hope that our journal will help promote health policy dialogue at both state and
national levels. In addition to aiding students, researchers, legislators, and health-related professionals, Utah’s Health also serves as a
health education resource to the general public, and is available online at www.uhreview.com.
As in years past, Utah’s Health is comprised of three main sections: Original Research, Special Topics, and a Data Review. This year’s
journal also features an expanded Legislative Review since there was ample debate and legislation relating to the health of Utahn’s
during this years legislative session. The Original Research Articles submitted this year are cutting edge, peer-reviewed scientific
research that relates to the health of Utahns, and I am very grateful for the many wonderful submissions that were received.
This year the University of Utah was privileged to have been host to a conference on obesity that featured many excellent lecturers
and speakers. As obesity is a growing health concern and important to the overall health status of Utahns in general, the editorial
board decided to dedicate the entire Special Topics section of this volume to this area.
There are many who deserve credit for the successful publication of this, the thirteenth volume of Utah’s Health: An Annual Review,
and thus I would like to thank the dedicated group of authors, contributors, and volunteers that have offered their time and effort
to make this journal possible. It is because of their commitment to research and the scholarly pursuit of health-related issues in Utah
that this journal is even made possible. I am grateful for and thank the stalwart group of advisory board members that have provided
expert review and assisted with the editing of our numerous articles and data pages. I would also like to thank Dr. Richard Sperry
who has supported us our faculty advisor this past year. Additionally, I owe a special thanks to Professor Norman J. Waitzman, PhD,
and Rebecca Utz, PhD, who graciously worked as our liaison with the authors and contributors of the special topic articles.
Lastly, I would like to acknowledge the contributions of a remarkable group of fellow students who have served diligently on this
volumes editorial board, and extend to them a sincere and heartfelt thank you for their enduring commitment to the success of this
publication.
Michael L. Young
Editor-in-Chief
Utah’s Health: An Annual Review – Volume XIII, 2008
2008 Utah’s Health: An Annual Review
©2008 The University of Utah. All Rights Reserved.
Syed Rafay Ahmed, BSc (Honors), is with the Department
of Sociology, Social Work and Anthropology at Utah State
University.
Marie Aschliman is an information analyst for The Utah
Department of Health Office of Vital Records and Statistics.
Laurie Baksh, MPH, is the PRAMS Data Manager at the
Utah Department of Health, Reproductive Health Program.
Richard Bullough, PhD, is the director of the Utah Diabetes
Prevention and Control Program at the Utah Department of
Health’s Bureau of Health Promotion as well as an adjunct
professor in health education at the University of Utah.
Darrin Cottle, MS, is a recent graduate of the Division of
Nutrition at the University of Utah.	
Erika K. Barth Cottrell, MPP, is a PhD student in Sociology
and is affiliated with the Center for Demography and Ecology
at the University of Wisconsin-Madison.
Julie Day, MD, is the Medical Director for Quality for the
University of Utah Community Clinics, the Medical Director
for Quality for the University Health Plan, and the Medical
Director of the Redwood Multi-specialty clinic and practices in
the Greenwood Internal Medicine Clinic.
Rosemary Dibble, CTR, is the Director of Operations at the
Utah Cancer Registry.
Jeffrey Duncan, MS, is currently the Director of Utah’s
Office of Vital Records and Statistics.
Kori Fitschen, BS, is a graduate student in the Department of
Exercise and Sport Science.
Pamela A. Clarkson Freeman, PhD, MSW, is at the
University of Utah.
Michael Friedrichs, MS, is the lead epidemiologist for the
Bureau of Health Promotion in the Utah Department of
Health.
C. Janna Harrell, MS, is the Senior Research Analyst at the
Utah Cancer Registry.
Sang Lim Lee, MA, is a PhD student in Sociology and is
affiliated with the Population Research Laboratory at Utah
State University.
Carol Masheter, Ph.D., currently works as Epidemiologist II
in the Office of Health Care Statistics, Utah Department of
Health, Salt Lake City.
Michael Magill, MD, is the chairman of the Department of
Family Practice at the University of Utah and the Executive
Medical Director of the University Health Care Community
Clinics.
Matthew McCabe is an undergraduate student emphasizing
in premedical studies at Utah State University.
Annie Sheets Mervis, MSW, is the Quality Manager for the
10 University of Utah Health Care Community Clinics.
Julie Metos, MPH, RD, CD, is a clinical instructor and
graduate student program director in the Division of Nutrition
at the University of Utah.
Nicole L. Mihalopoulos, MD, MPH, is an assistant
professor in Adolescent Medicine in the Department of
Pediatrics and an adjunct professor in the Division of Nutrition
and the Department of Internal Medicine.
Authors and Contributors
2008 Utah’s Health: An Annual Review
©2008 The University of Utah. All Rights Reserved.
Hyojun Park, MA, is a PhD student in the Department
of Sociology, Social Work and Anthropology at Utah State
University.
Fahina Pasi, BS, is the executive director of the National
Tongan American Society.
Brenda Ralls, PhD, is currently the epidemiologist for the
Utah Diabetes Prevention and Control Program.
Justine Reel, PhD, is an associate professor in the Department
of Exercise and Sport Science.
Eric N. Reither, PhD, is Assistant Professor of Sociology at
Utah State University and is affiliated with the Population
Research Laboratory in the Department of Sociology, Social
Work and Anthropology.
Sandra K. Schulthies, MS, is with the Utah Statewide
Immunization Information System (USIIS) in the Utah
Department of Health.
Gulzar H. Shah has a Masters Degree in Statistics,
Masters in Social Sciences, and PhD in Sociology, with
Demography, Sociology of Health and Social Problems as
areas of emphasis. Currently, he is the Director of Research
at National Association of Health Data Organizations
(NAHDO).
William F. Stinner, PhD, is a professor emeritus from Utah
State University.
Antoinette M. Stroup, PhD, is the Co-Principal Investigator
and Deputy Director of the Utah Cancer Registry (UCR).
Rebecca L. Utz, PhD, is an assistant professor of Sociology and
affiliate member of the Institute for Public and International
Affairs and the Center on Aging at the University of Utah.
Rebecca L. Utz, PhD, is an assistant professor of Sociology and
affiliate member of the Institute for Public and International
Affairs and the Center on Aging at the University of Utah.
Michael Varner, MD, is at the Department of Obstetrics and
Gynecology at the University of Utah.
Norman J. Waitzman, PhD, is a professor of Economics and
co-director of the Behavioral Science and Health program at
the University of Utah.
Nao Xiong, MA, is a PhD student in the Department of
Sociology, Social Work and Anthropology at Utah State
University.
Wu Xu, PhD, is with the Utah Research Center for Excellence
in Public Health Informatics.
Yukiko Yoneoka, MS, is with the Utah Statewide
Immunization Information System (USIIS) in the Utah
Department of Health.
2008 Utah’s Health: An Annual Review
©2008 The University of Utah. All Rights Reserved.
Table of Contents
Orginal Research Articles.....................................................................................................9
Widening Racial and Ethnic Disparities in AIDS Incidence in Salt Lake City-Ogden, Utah, 1990-2000........... 10
	 Erika K. Barth Cottrell, MPP; Sang Lim Lee, MA; and Eric N. Reither, PhD
The Effect of Palliative Care Inpatients on the Agency for Healthcare Research and Quality Inpatient
Quality Indicators (AHRQ IQIs) for In-hospital Mortality Rates: A Utah Case Study........................................ 17
	 Carol Masheter, PhD
Cancer Incidence and Mortality Trends in Utah: 1973-2004...................................................................................25	
	 Antoinette M. Stroup, PhD; Rosemary Dibble, CTR; and C. Janna Harrell, MS
Variations in Rates of Gestational Diabetes Between Asian American and Pacific Islander Mothers in Utah...33
Brenda Ralls, PhD; William F. Stinner, PhD; Gulzar H. Shah, MStat, MSS, PhD;
Richard Bullough, PhD; Fahina Pasi, BS; Jeffrey Duncan, MS; and Marie Aschliman, Analyst
Birth Order and Other Sociodemographic Factors Influencing Immunization Status of Children in Utah: A
Cohort Study Using Utah Statewide Immunization Information System and Vital Records Data......................39
Sandra K. Schulthies, MS and Yukiko Yoneoka, MS
Episiotomy and Obstetric Trauma in Utah: Evidence from Linked Hospital Discharge and Birth Data............44
Gulzar H. Shah, M. Stat, MSS, PhD; Pamela A. Clarkson Freeman, PhD, MSW;
Syed Rafay Ahmed, B Sc Honors; Michael Varner, MD; and Wu Xu, PhD
Special Topic: Obesity..........................................................................................................53
Obesity in America and in Utah.................................................................................................................................54
	 Rebecca L. Utz, PhD, and Norman J. Waitzman, PhD
Trends and Variability in Utah’s Obesity Rates, 2006..............................................................................................56
Michael Friedrichs, MS
The Distribution and Determinants of Overweight Among Adolescents in the Intermountain West..................64
Eric N. Reither, PhD; Hyojun Park, MA; Nao Xiong, MA; and Matthew McCabe
Maternal Obesity in Utah............................................................................................................................................72
Laurie Baksh, MPH
Preventing Obesity and Managing Its Consequences: Wellness Programs and Primary Care............................78
Julie Day, Annie Sheets Mervis, Michael Magill
“Eat & Live Well”: Lessons Learned from an After School Weight Management Program................................81
Rebecca Utz, PhD; Darrin Cottle, MS; Kori Fitschen, BS; Julie Metos, MPH, RD, CD;
Justine Reel, PhD; and Nicole L. Mihalopoulos, MD, MPH
The Road To The Utah Partnership For Healthy Weight (UPHW) and Coordinated Efforts
to Reduce Overweight and Obesity in Utah...............................................................................................................88
Richard C. Bullough, PhD
Health Policy
2008 Utah Legislative Review.....................................................................................................................................94
Aaron S. Larson, MPA-HSA
2008 Utah Health Data Review......................................................................................111
Population Indicators................................................................................................................................................. 114
General Health Indicators.........................................................................................................................................122
Behavioral Influences on Health............................................................................................................................... 137
Women’s and Children’s Health............................................................................................................................... 149
Infectious Diseases and STDs....................................................................................................................................154
Chronic Diseases........................................................................................................................................................ 171
Local Health Districts................................................................................................................................................ 183
Health Services Directory................................................................................................207
Birth and Death - Utah, Regional, National Trends
Chronic Homelessness
Cost of Urban Living
Education
Population by Race and Ethnicity
Unemployment Rate
Air Quality
All Cause Mortality
Emergency Department Visits
Health Insurance Coverage	 	 	 	 
Hospital Discharge by Major Disease Category
Life Expectancy
Poverty
Self-Perceived Health Status
Alcohol Use - Utah and United States
Homicide
Motor Vehicle Crash Deaths and Seat Belt Utilization
Suicide
Tobacco Use - Utah and United States
Violent Crime
Newborn Screening
Overweight Children and Adolescents
Vaginal Birth and Cesarean Section
HIV/AIDS
Chlamydia
E.Coli
Gonorrhea
Hepatitis
Herpes and Trichomonas
Human Papillomavirus
Immunizations
Mumps, Polio, and Rubella
Pneumonia and Influenza
Syphilis
Tuberculosis
Breast Cancer
Cerebrovascular Diseases
Colon Cancer
Coronary Heart Disease
Diabetes Mellitus
Lung Cancer
Prostate Cancer
Bear River Health Department
Central Utah Health Department
Davis County Health Department
Salt Lake County Health Department
Southeastern Utah Health Department
Southwestern Utah Health Department
Summit County Health Department
Tooele County Health Department
Tri-County Health Department
Utah County Health Department
Wasatch City/County Health Department
Weber-Morgan Health Department
2008 Utah’s Health: An Annual Review
©2008 The University of Utah. All Rights Reserved.
Utah’s Health: An Annual Review
Original Research Articles
2008 Utah’s Health: An Annual Review
10 ©2008 The University of Utah. All Rights Reserved.Widening Racial and Ethnic Disparities in AIDS Incidence
Widening Racial and Ethnic Disparities
in AIDS Incidence in Salt Lake City-
Ogden, Utah, 1990-2000
Authors:
Erika K. Barth Cottrell, MPP
Sang Lim Lee, MA
Eric N. Reither, PhD
Abstract
Context: Public health agencies have identified the elimination of health disparities
as a major policy objective.
Objectives: The main goals of this study were to assess the magnitude of racial/eth-
nic disparities in rates of AIDS incidence in the metropolitan statistical area of Salt
Lake City-Ogden, Utah and determine how those disparities have changed over the
period 1990-2000.
Methods: Incidence rates were calculated using data from the AIDS Public Informa-
tion Data Set (numerators) and US Census Bureau (denominators). Rates of AIDS
incidence were produced for broad demographic groups (e.g., Hispanics) in Salt Lake
City-Ogden. In addition, age-standardized incidence rates were produced for groups
defined by age, sex and race/ethnicity, permitting careful examination of trends in
racial/ethnic disparities.
Results: In Salt Lake City-Ogden’s general population, AIDS incidence dropped
from 11.23 per 100,000 in 1990 to 7.99 per 100,000 in 2000—a decline of about 29%.
AIDS incidence rates also dropped for populations of non-Hispanic Blacks (-15.12%)
and non-Hispanic Whites (-36.72%), but climbed among Hispanics (11.89%). Of all
groups examined, Hispanic females experienced the largest increase in AIDS inci-
dence over this period (58.27%). Rate ratios indicate that racial/ethnic disparities in
AIDS incidence widened during the 1990s, both between non-Hispanic Whites and
non-Hispanic Blacks (up 33.75%) and between non-Hispanic Whites and Hispanics
(up 76.59%). Perhaps the most striking finding is the 113.35% increase in the disparity
in AIDS incidence between non-Hispanic White and Hispanic females. Although ra-
cial/ethnic disparities in AIDS incidence generally widened between 1990 and 2000,
it is encouraging to note that the disparity between non-Hispanic White and non-
Hispanic Black females declined by almost 6%.
Conclusion: Despite progress in reducing rates of AIDS incidence in Salt Lake City-
Ogden’s general population, racial/ethnic disparities widened considerably between
1990 and 2000.
Brief Bios
Ms. Cottrell is a Ph.D. student in
Sociology and is affiliated with the
Center for Demography and Ecol-
ogy at the University of Wisconsin-
Madison.
Mr. Lee is a Ph.D. student in
Sociology and is affiliated with the
Population Research Laboratory at
Utah State University.
Dr. Reither is Assistant Professor
of Sociology, Utah State University,
Population Research Laboratory
and Department of Sociology, So-
cial Work and Anthropology, Logan
UT 84322-0730, office phone (435)
797-1217, fax (435) 797-1240, e-mail
eric.reither@usu.edu.
2008 Utah’s Health: An Annual Review
©2008 The University of Utah. All Rights Reserved. 11Widening Racial and Ethnic Disparities in AIDS Incidence
Introduction
In January 2000, the United States Department of Health
and Human Services launched Healthy People 2010, a
health promotion and disease prevention agenda with two
overarching goals: to increase quality and years of healthy
life and to eliminate health disparities (U.S. Department
of Health, 2000). A large body of research pointing to the
growing socioeconomic and racial/ethnic disparities in
morbidity and premature mortality in many parts of the
United States, including Utah, supports the importance of
this objective (see for example Singh, 2001; Smith, 1999;
Palloni, 2006).
Combating the Human Immunodeficiency Virus (HIV) and
Acquired Immune Deficiency Syndrome (AIDS) is one of
the key priorities of Healthy People 2010. Despite Utah’s
relatively low rates of HIV/AIDS, it remains an important
cause of morbidity and mortality in the state (Utah Depart-
ment of Health, 2000). Indeed, AIDS was one of the top
12 reported communicable diseases in Utah for 2001-2005
(Utah Department of Health, 2006).
As in the rest of the United States, in Utah there was a
substantial decrease in the number of newly reported HIV
infections and AIDS cases in the mid to late 1990s (Ries,
1999; Utah Department of Health, 2000). However, de-
spite this progress, it is important to note that HIV/AIDS
incidence did not decline for all of Utah’s racial and ethnic
groups. In fact, racial/ethnic disparities in incident cases
of HIV/AIDS actually grew during the 1990s (Ries, 1999;
University of Utah Health Sciences AIDS Center, 1999).
This paper adds to existing knowledge about the HIV/AIDS
epidemic in Utah by looking specifically at rates of AIDS
incidence in the metropolitan statistical area (MSA) of Salt
Lake City-Ogden between 1990 and 2000, with a particular
focus on racial/ethnic disparities. As the largest and most
diverse urban center in the state of Utah, Salt Lake City-
Ogden is well suited for such an investigation.
Methods
Data from the AIDS Public Information Data Set
(APIDS) (CDC, 2007a) and the U.S. Census Bureau (2007)
were used to estimate AIDS incidence rates between 1990
and 2000 for various demographic groups in the MSA of
Salt Lake City-Ogden, Utah. We utilized a weighting vari-
able (adjwgt) included in APIDS that accounts for report-
ing delays, thus minimizing the possibility of underestimat-
ing incident AIDS diagnoses. To increase the stability of
our estimates for a given year (e.g., 1990), we accumulated
AIDS diagnoses over a period of five years (e.g., 1988-1992),
then divided by five to produce annualized incidence rates.
Weighted estimates affected only the final period of obser-
vation (i.e., 1998-2002), increasing the number of AIDS di-
agnoses from 505 to 533.
In 1993, the CDC expanded the surveillance case definition
for AIDS to include immunological criteria (e.g., less than
200 CD4+ T-lymphocytes/uL) and three new clinical con-
ditions (pulmonary tuberculosis, recurrent pneumonia and
invasive cervical cancer) (CDC, 1993). Although the new
definition was retroactively applied, it did not result in sub-
stantially more AIDS diagnoses until 1993, at which time
the AIDS incidence curve in the U.S became temporarily
distorted (CDC, 2007a). This distortion had essentially dis-
appeared by 1996, suggesting that AIDS estimates for 1990
and 2000 are generally comparable.
In correspondence to rate numerators, rate denominators
were derived for demographic groups classified by age, sex
and race/ethnicity. In 2000, the U.S. Census permitted mul-
tiracial classifications. To produce population estimates for
non-Hispanic Whites, non-Hispanic Blacks and Hispanics
in 2000, we adopted the fractional approach outlined by Al-
len and Turner (2001) to apportion multiracial individuals
in Salt Lake City-Ogden to these racial/ethnic categories.
Also, because 1990 U.S. Census data presented in Ameri-
can FactFinder do not distinguish race from ethnicity in age
and sex specific tables, we derived non-Hispanic White and
non-Hispanic Black populations by estimating (and subse-
quently subtracting) the number of Hispanic individuals in
these groups.
Data from APIDS and the U.S. Census Bureau were man-
aged and analyzed in SPSS 15.0 and Microsoft Excel. The
analyses proceeded in two stages: First, to provide an as-
sessment of general progress, AIDS incidence rates were
calculated for all of Salt Lake City-Ogden and broad de-
mographic groups (e.g., women) in 1990 and 2000. Second,
to generate a clearer picture of trends in racial/ethnic dis-
parities, AIDS incidence rates for Hispanics, non-Hispanic
Whites and non-Hispanic Blacks were stratified by sex
and age in 1990 and 2000. Sex specific analyses were con-
ducted for all age groups combined and also for adults aged
20-64 to estimate changes in AIDS incidence in this higher
risk category. To minimize the influence of changing age
structures on estimated trends in racial/ethnic disparities in
AIDS incidence, the stratified analyses were age-standard-
ized according to the 1990 non-Hispanic White population
(Preston et al, 2001). Because we have access to population
rather than sample data, the incidence rates generated by
our study are population parameters—not sample statis-
tics. Consequently, it is neither necessary nor appropriate to
provide measures of uncertainty (e.g., confidence intervals)
2008 Utah’s Health: An Annual Review
12 ©2008 The University of Utah. All Rights Reserved.Widening Racial and Ethnic Disparities in AIDS Incidence
typically found in epidemiologic research, as the purpose
of such measures is to make inferences about population
characteristics from sample data.
In our subsequent discussion of these analyses, we sought
to situate Salt Lake City-Ogden in a national context. Con-
sequently, selected analyses were replicated for the United
States in 1990 and 2000. Rates of AIDS incidence for the
United States include all 50 states and the District of Co-
lumbia, but not territories (e.g., Puerto Rico). Unfortunately,
APIDS does not provide AIDS data for individual states or
cities with populations less than 500,000, making it impos-
sible to replicate these analyses for either the state of Utah
or other urban centers in the state (e.g., Logan).
Results
In Salt Lake City-Ogden’s general population, AIDS inci-
dence dropped from 11.23 per 100,000 in 1990 to 7.99 per
100,000 in 2000 - a decline of about 29% (see Table 1). The
incidence of AIDS among males fell by 32.20%, from 20.73
per 100,000 in 1990 to 14.06 per 100,000 in 2000. Incidence
among females, which was already low relative to males,
declined an additional 0.58%, from 1.85 to 1.84 per 100,000.
With the exception of the youngest age group (ages 0-19)
where AIDS incidence increased marginally from 0.24 to
0.26 per 100,000, AIDS incidence declined in all age other
groups between 1990 and 2000. The decline was especially
pronounced among young adults (ages 20-34) and mature
adults (ages 65 and over). Whereas the 1990 AIDS incidence
rate of 21.94 per 100,000 young adults was high relative to
the rate of 15.44 per 100,000 midlife adults (ages 40-64), by
2000 the rates of these two groups were almost identical, at
11.68 at 11.58 per 100,000 respectively.
As shown in Table 1, AIDS incidence rates also dropped
in the non-Hispanic Black (-15.12%) and non-Hispanic
White (-36.72%) populations, but climbed among Hispan-
ics (11.89%). Among the groups we examined, the largest
increase in AIDS incidence occurred among Hispanic fe-
males (58.27%), which jumped from 3.82 per 100,000 in
1990 to 6.05 per 100,000 in 2000 (see Figure 2). Although
AIDS incidence among Hispanic males grew only a little
more than 1% over this period, it is important to note that
Figure 1. Racial disparities in AIDS incidence rates among males in the MSA of Salt
Lake City-Ogden, Utah, 1990-2000
20.1 18.6
120.1
37.1 35.2
216.4
12.1
18.9
82.5
22.5
35.7
155.9
0
50
100
150
200
250
Non-Hispanic
White
Hispanic Non-Hispanic
Black
Non-Hispanic
White
Hispanic Non-Hispanic
Black
All Males Young and Midlife Adult (20-64) Males
Rateper100,000peryear
1990 AIDS Indicence Rates
2000 AIDS Indicence Rates
Figure 1. Racial disparities in AIDS incidence rates among males in the MSA
of Salt Lake City-Ogden, Utah, 1990-2000
2008 Utah’s Health: An Annual Review
©2008 The University of Utah. All Rights Reserved. 13Widening Racial and Ethnic Disparities in AIDS Incidence
AIDS incidence rates among Hispanic males remain high
relative to Hispanic females (see Figure 1 and Figure 2).
The trends in AIDS incidence among Hispanics are in stark
contrast to trends found in the non-Hispanic Black female
and non-Hispanic Black male populations, which both de-
clined by about 30% over this period of time.
Although AIDS incidence rates among non-Hispanic Blacks
fell considerably between 1990 and 2000, non-Hispanic
Blacks remain the most affected racial/ethnic group in Salt
Lake City-Ogden. In 2000, there were 82.55 incident cases
of AIDS per 100,000 in the non-Hispanic Black male popu-
lation, relative to 12.14 per 100,000 among non-Hispanic
White males and 18.89 per 100,000 among Hispanic males
(see Figure 1). Similarly, in 2000 AIDS incidence among
non-Hispanic Black females was 46.70 per 100,000, versus
less than one per 100,000 in the non-Hispanic White female
population and 6.05 per 100,000 in the Hispanic female
population (see Figure 2). Thus, although AIDS incidence
is declining among non-Hispanic Blacks, this population re-
mains a high priority for prevention and treatment efforts.
Moreover, rate ratios indicate that racial/ethnic disparities
in AIDS incidence widened over this period, both be-
tween non-Hispanic Whites and non-Hispanic Blacks (up
33.75%) and between non-Hispanic Whites and Hispanics
(up 76.59%) (see Table 2). Particularly striking findings
are the 113.35% increase in disparity in AIDS incidence
between Hispanic and non-Hispanic White females, and
the 67.98% increase in the disparity between Hispanic
and non-Hispanic White males. There was a more modest
(albeit important) 13.91% increase in the disparity between
non-Hispanic Black and non-Hispanic White males, and a
5.64% decline in the disparity between non-Hispanic Black
and non-Hispanic White females. These findings highlight
the general vulnerability of the non-Hispanic Black and
Hispanic populations, as well as the increasing susceptibil-
ity of Hispanic females to HIV infection.
Table 1. AIDS incidence rates (per 100,000) among major demographic groups in Salt
Lake City-Ogden, Utah, 1990-2000
1990
†
2000
†
General Population 11.23 (20.73) 7.99 (13.81)
Sex
Male 20.73 (38.24) 14.06 (24.23)
Female 1.85 (3.37) 1.84 (3.06)
Age
‡
Children (0-19) 0.24 0.26
Young adult (20-34) 21.94 11.68
Midlife adult (40-64) 15.44 11.58
Mature adult (65+) 1.99 0.72
Race/ethnicity
Non-Hispanic White 10.43 (19.23) 6.60 (9.60)
Non-Hispanic Black 93.87 (174.03) 79.68 (114.23)
Hispanic 11.62 (22.03) 13.00 (18.91)
-15.12% (-34.46%)
11.89% (-14.20%)
Percent Change
†
-36.72% (-50.07%)
-28.83% (-33.36%)
-32.20% (-36.64%)
-0.58% (-9.20%)
6.68%
-46.77%
-24.99%
-63.62%
† Figures in parentheses include only adults aged 20-64; figures to the left of parentheses include all age
groups. While percent change figures are correct, they do not perfectly correspond to incidence rates
shown here due to rate rounding.
‡ The age category 35-39 is omitted because missing data are included in this group. However, given (1)
the high probability that individuals in this category are between 20 and 64 years of age and (2)
considerable underestimation of AIDS incidence among adults aged 20-64 when the category 35-39 is
excluded, we retained this category in calculations of rates shown in parentheses.
2008 Utah’s Health: An Annual Review
14 ©2008 The University of Utah. All Rights Reserved.Widening Racial and Ethnic Disparities in AIDS Incidence
Discussion
The U.S. Department of Health and Human Services has
designated the elimination of health disparities as a top
public health priority (U.S. Department of Health and Hu-
man Services, 2000). This call to action is timely in its im-
portance, as evidenced by research showing that health dis-
parities have widened in recent decades (i.e. Singh, 2002;
Smith, 1999; Palloni, 2006). Our investigation adds to this
body of research by demonstrating that racial/ethnic dis-
parities in rates of AIDS incidence widened substantially
in Salt Lake City-Ogden, Utah over the final decade of the
20th century. As noted, disparities in AIDS incidence be-
tween non-Hispanic Whites and non-Hispanic Blacks in-
creased by almost 34% and disparities in AIDS incidence
between non-Hispanic Whites and Hispanics increased by
over 76% between 1990 and 2000.
Clearly, growing disparities in AIDS incidence pose a
significant challenge to the achievement of the overarch-
ing goals of Healthy People 2010. However, this should not
obscure important progress that has been made combating
the AIDS epidemic. Between 1990 and 2000, the rate of
AIDS incidence declined in Salt Lake City-Ogden, both
in the general population and among non-Hispanic Whites
and non-Hispanic Blacks. Moreover, the disparity in AIDS
incidence between males and females fell by almost 30%
over this decade, and the disparity in AIDS incidence be-
tween non-Hispanic White and non-Hispanic Black women
fell by almost 6%.
Our analysis of APIDS data for the United States revealed
that Salt Lake City-Ogden is part of broader national trends
(results not shown). In the United States between 1990 and
2000, rates of AIDS incidence declined in the general pop-
ulation and among certain demographic groups – includ-
ing males and non-Hispanic Whites – just as they did in
Salt Lake City-Ogden. Part of this decline is testament to
the success of HIV prevention campaigns, which promot-
ed safer behaviors and reduced the number of new infec-
tions from 150,000 per year in the early 1980s to 40,000
per year by the early 1990s (CDC, 2005). However, perhaps
the most salient factor behind declining AIDS incidence in
the 1990s in both Utah and the country as a whole was the
growing availability of highly active antiretroviral therapy
(HAART), which delays progression from HIV to AIDS
and significantly prolongs life (Karon et al., 2001; Ries,
1999).
Despite similarities between Salt Lake City-Ogden and the
rest of the nation there are some notable differences to con-
sider. First of all, it is important to recognize that AIDS
incidence rates in Salt Lake City are well below those found
nationwide. As of 2000, the overall rate of AIDS incidence
in the United States (about 15 per 100,000) was almost twice
that in Salt Lake City-Ogden (about 8 per 100,000). AIDS
incidence in Salt Lake City-Ogden also compares favor-
ably to other MSAs such as Los Angeles (17 per 100,000),
Chicago (23 per 100,000), and New York (68 per 100,000)
(CDC, 2000). In addition, although AIDS incidence rates
among non-Hispanic Blacks increased by about 8% nation-
wide between 1990 and 2000, incidence rates among non-
Hispanic Blacks in Salt Lake City-Ogden actually fell by
over 15% during this period. Despite these positive trends
in Salt Lake City-Ogden relative to the nation as a whole, it
Table 2. AIDS incidence rates ratios for all age groups, by sex and race/ethnicity, Salt
Lake City-Ogden, Utah, 1990-2000
1990†
2000†
Percent Change†
Sex
Male: Female 10.89 7.83 -28.10%
Race/Ethnicity
Non-Hispanic Black: Non-Hispanic White 9.03 12.08 33.75%
Hispanic: Non-Hispanic White 1.12 1.97 76.59%
Race/Ethnicity for Males
Non-Hispanic Black: Non-Hispanic White 5.97 6.80 13.91%
Hispanic: Non-Hispanic White 0.93 1.56 67.98%
Race/Ethnicity for Females
Non-Hispanic Black: Non-Hispanic White 52.54 49.58 -5.64%
Hispanic: Non-Hispanic White 3.01 6.42 113.35%
† Figures include all age groups.
2008 Utah’s Health: An Annual Review
©2008 The University of Utah. All Rights Reserved. 15Widening Racial and Ethnic Disparities in AIDS Incidence
is notable that although there was a 34% decline in AIDS
incidence in the Hispanic population nationwide, AIDS in-
cidence among Hispanics in Salt Lake City-Ogden climbed
by almost 12% between 1990 and 2000.
This study has various limitations. First, APIDS data do not
extend past 2002, making it impossible to investigate more
recent trends in racial/ethnic disparities in AIDS incidence.
Second, because APIDS do not include indicators of socio-
economic status (SES), it was not possible to disentangle
race/ethnicity from potential mediators such as education
and income. Typically, research on racial/ethnic health dis-
parities – including research on HIV/AIDS – has found that
controlling for SES may attenuate but does not eliminate
racial/ethnic disparities (Ebrahim et al, 2004; Moore et al,
1994; Robert et al, 2004). Third, there is a large and in-
creasing share of missing data on mode of transmission in
APIDS, making it difficult to estimate what forms of HIV
transmission might account for shifting patterns of AIDS
incidence in Salt Lake City-Ogden.
Several mechanisms could be responsible for disparities in
AIDS incidence. Race/ethnicity is associated with markers
of SES such as income, which has become less equitably
distributed in the United States in recent decades (Ferrie,
2005; US Census Bureau, 2005). Although race/ethnicity
itself is not a risk factor for HIV infection, it may be as-
sociated with social, cultural, and economic factors - such
as high rates of poverty, unemployment, and lack of access
to health care - that are often correlated with high risk be-
havior (Blair et al, 2002). Such factors could also serve as
barriers to accessing HIV prevention information and/or
appropriate testing, diagnosis and treatment services, in-
cluding HAART (Andersen et al, 2000; Utah Department
of Health, 2007). Since the advent of HAART, if and when
an HIV infection progresses to AIDS is contingent on sev-
eral factors - namely whether individuals are prescribed the
appropriate medications, whether they can afford the medi-
cations and whether they take the medications as prescribed
(CDC, 2007b). Therefore, differential access and compli-
ance with HAART regimens may also be responsible for
disparities in AIDS incidence.
Although the elimination of racial/ethnic disparities in
AIDS incidence seems unlikely without broad societal
change, opportunities exist for clinicians and the public
Figure 2. Racial disparities in AIDS incidence rates among females in the MSA of Salt
Lake City-Ogden, Utah, 1990-2000
1.3 3.8
66.7
2.3
7.2
126.6
0.9
6.0
46.7
1.7
10.9
76.7
0
50
100
150
200
250
Non-Hispanic
White
Hispanic Non-Hispanic
Black
Non-Hispanic
White
Hispanic Non-Hispanic
Black
All Females Young and Midlife Adult (20-64) Females
Rateper100,000peryear
1990 AIDS Indicence Rates
2000 AIDS Indicence Rates
17
Figure 2. Racial disparities in AIDS incidence rates among females in the MSA of
Salt Lake City-Ogden, Utah, 1990-2000
2008 Utah’s Health: An Annual Review
16 ©2008 The University of Utah. All Rights Reserved.Widening Racial and Ethnic Disparities in AIDS Incidence
health community in Utah to contribute toward their reduc-
tion. The Department of Health has highlighted the neces-
sity of extending the recent success in reducing HIV/AIDS
incidence by developing broader public health strategies to
encourage HIV/AIDS prevention and treatment among His-
panics and non-Hispanic Blacks in Utah (Utah Department
of Health, 2000). For example, after identifying Hispanics
as one of their top three HIV prevention priorities, the Utah
HIV Prevention Community Planning Committee (CPC)
implemented a HIV Prevention Hispanic Needs Assessment
in 2005 to help make evidence based decisions concerning
the HIV prevention needs of Utah’s Hispanic population
(Utah Department of Health, 2007). Physicians can also
take measures to ensure that disadvantaged patients – in
particular Hispanics and non-Hispanic Blacks – are aware
of HIV treatment options that may delay the onset of AIDS.
HIV is increasingly a chronic illness; with proper treatment
and care, people living with HIV can effectively ward off
illness and substantially prolong life. Ensuring that all ra-
cial and ethnic groups have information about HIV preven-
tion and access to treatment and care is integral to reducing
overall disparities in health, both in Salt Lake City-Ogden
and in the United States as a whole.
References
Allen J, Turner E. 2001. “Bridging 1990 and 2000 census race data: fractional
assignment of multiracial populations.” Population Research Policy Review
20:513-533.
Andersen R, Bozzette S, Shapiro M. 2000. “Access of vulnerable groups to
antiretroviral therapy among persons in care for HIV disease in the United
States.” Health Services Research 35:389-416.
Blair JM, Fleming PL, Karon JM. 2002. “Trends in AIDS incidence and survival
among racial/ethnic minority men who have sex with men.” Journal of Acquired
Immune Deficiency Syndromes 31(3):339-347.
CDC. 2007a. APIDS: AIDS Public Information Data Set. Available online at
http://www.cdc.gov/hiv/topics/surveillance/resources/software/apids/index.htm.
CDC. 2007b. HIV/AIDS Statistics and Surveillance. Available online at http://
www.cdc.gov/hiv/topics/surveillance/index.htm.
CDC. 2005. “HIV prevention in the third decade: Activities of CDC’s Divisions
of HIV/AIDS Prevention,” Available online at http://www.cdc.gov/hiv/resources/
reports/hiv3rddecade/index.htm.
CDC. 2000. “U.S. HIV and AIDS cases reported through June 2005.” HIV/AIDS
Surveillance Report 12(1). Available online at http://www.cdc.gov/HIV/topics/
surveillance/resources/reports/pdf/hasr1201.pdf.
CDC. 1992. “1993 revised classification system for HIV infection and expanded
surveillance case definition for AIDS among adolescents and adults.” MMWR
41(RR-17):1-19.
Ebrahim S, Anderson J, Weidle P, Purcell D. 2004. “Race/ethnic disparities in
HIV testing and knowledge about treatment for HIV/AIDS: United States, 2001.”
AIDS Patient Care STDS 18(1):27-33.
Ferrie JP. 2005. “The end of American exceptionalism? Mobility in the United
States Since 1850.” Journal of Economic Perspectives 19:199-215.
Karon, John M, Fleming, Patricia L, Steketee Richard W, and De Cock Kevin
M. 2001. “HIV in the United States at the turn of the Century: An Epidemic in
Transition,” American Journal of Public Health 91(7): 1060.
Moore R, Stanton D, Gopalan R, Chaisson R. 1994. “Racial differences in the use
of drug therapy for HIV disease in an urban community.” New England Journal
of Medicine 330(11):763-768.
Palloni, A. 2006. “Reproducing inequalities: Luck, wallets, and the enduring
effects of childhood health,” Demography 43(4).
Preston S, Heuveline P, Guillot M. 2001. Demography: Measuring and Modeling
Population Processes. Malden, Mass: Blackwell Publishers.
Ries K. 1999. “The HIV/AIDS Epidemic in Utah, 1998.” Utah’s Health: An
Annual Review 6.
Robert S, Reither E. 2004. “A multilevel analysis of race, community
disadvantage, and body mass index among adults in the US.” Social Science &
Medicine 59(12):2421-2434.
SinghG,SiahpushM.2002.“Increasinginequalitiesinall-causeandcardiovascular
mortality among US adults aged 25–64 years by area socioeconomic status,
1969–1998.” International Journal of Epidemiology 31:600-613.
Smith J. 1999. “Healthy bodies and thick wallets: The dual relation between
health and economic status.” Journal of Economic Perspectives 13(2):145-166.
University of Utah Health Sciences AIDS Center. 1999. Sixth Annual Report,
February 1999.
US Census Bureau. 2007. American FactFinder. Available online at http://
factfinder.census.gov/home/saff/main.html?_lang=en.
US Census Bureau, Housing and Household Economic Statistics Division. 2005.
Selected measures of household income dispersion: 1967 to 2001 (Table IE-1).
Available online at http://www.census.gov/hhes/www/income/histinc/iel.html.
US Department of Health and Human Services. 2000. Healthy People 2010:
Understanding and Improving Health. 2nd Ed. Washington DC: US Government
Printing Office.
Utah Department of Health. 2000. Utah Health Status Update: HIV/AIDS in
Utah. Available online at http://health.utah.gov/opha/publications/hsu/0003hiv-
aids.pdf.
Utah Department of Health. 2006. Preliminary rankings of reportable
communicable diseases, by frequency, Utah and US, 2006 (including numbers
of cases and historical rankings). Available online at http://health.utah.gov/epi/
anrpt/anrpt06/Top%2025%20List_2006_031207dj.pdf.
Utah Department of Health. 2007. Utah HIV Prevention Hispanic Needs
Assessment Report. Available online at http://health.utah.gov/cdc/hivprevention/
resources/2005%20Hispanic%20Needs%20Assessment%20Report.pdf.
2008 Utah’s Health: An Annual Review
©2008 The University of Utah. All Rights Reserved. 17The Effect of Palliative Care Inpatients for In-hospital Mortality Rates
The Effect of Palliative Care Inpatients
on the Agency for Healthcare Research
and Quality Inpatient Quality
Indicators (AHRQ IQIs) for In-hospital
Mortality Rates: A Utah Case Study
Author: Carol Masheter, PhD
Abstract
This study compares the Agency for Healthcare Research and Quality Inpatient
Quality Indicator (AHRQ IQI) mortality rates among Utah inpatients when patients
with a palliative care code (palliative care discharges) are included and excluded.
This study also reports the annual rate of palliative care discharges per 100,000
hospital inpatient hospitalizations for the U.S. and Utah in 2000 through 2005. Seven
of the nine AHRQ IQIs examined included palliative care discharges for Utah in 2004
through 2006. For the Stroke IQI, when palliative care discharges are excluded, the
observed mortality rate decreased from about the same as the expected mortality rate
to significantly lower than the expected mortality rate for three of 39 Utah hospitals
and for Utah overall. For the Congestive Heart Failure IQI, similar decreases are
observed for two of these three hospitals, but not for Utah overall. All of the deceased
patients that two hospitals stated received comfort care did not have a palliative care
ICD-9-CM diagnosis code. Further study is needed.
Introduction
In 2005, Utah State Senate Bill SB 132 (Health Care Consumer Bill)1
mandated that
the Utah Health Data Committee publish Utah Hospital Comparison Reports2
using
nationally recognized hospital-level indicators on patient safety, quality of care and
charges. For the nationally recognized indicators, the report authors have used Agency
for Healthcare Research and Quality Inpatient Quality Indicators (AHRQ IQIs)3
. The
AHRQ IQI software4
, run on Utah Hospital Discharge Database (Utah Database)5
,
provides observed and expected rates of in-hospital mortality for specified conditions
and procedures6,7
. The observed mortality rate is the number of patients who died
in the hospital divided by the number of patients at risk. For example, the observed
rate for stroke is the number of patients who died in the hospital out of all patients
admitted for stroke as defined by the AHRQ stroke IQI. The expected mortality rate is
the number of patients expected to die from a specified condition or procedure, given
the patient’s age, gender and the severity of their illness, divided by the number of
patients at risk. The AHRQ IQI software calculates the expected mortality rate for all
included Utah hospitals (Utah overall) and for each hospital using regression weights
based on each patient’s age, sex, severity of illness and/or risk of mortality6,7,8
. The
Utah Hospital Comparison Reports compare observed and expected mortality rates
for Utah overall and for each hospital by AHRQ IQI using the Exact 95% Confidence
Key Words:
Palliative care code, comfort care
code, terminal care code, end of life
care code, in-hospital mortality, in-
hospital deaths, hospital mortality,
hospital deaths, hospital quality of
care, stroke hospitalization, conges-
tive heart failure hospitalization,
pneumonia hospitalization, Agency
for Healthcare Research and Quality
Inpatient Quality Indicators
Brief Bio
Carol Masheter, PhD, currently
works as Epidemiologist II in the
Office of Health Care Statistics,
Utah Department of Health, Salt
Lake City. She has conducted basic
research as a chemist in university and
medical school settings for 16 years,
taught and conducted research at
Rutgers University and the Univer-
sity of Utah in social science for 10
years, and has worked in public health
for six years. Dr. Masheter also is a
high-altitude mountaineer and will
attempt to climb to the summit of
Mt. Everest in May, 2008
Correspondence
Carol Masheter, PhD, Epidemiologist
Office of Health Care Statistics Utah
Department of Health 288 North
1460 West, Salt Lake City, UT
84116-4004
Phone: 801-538-6355 FAX:
801-538-9916 Email: cmasheter@
utah.gov
2008 Utah’s Health: An Annual Review
18 ©2008 The University of Utah. All Rights Reserved.The Effect of Palliative Care Inpatients for In-hospital Mortality Rates
Interval as a test for significant difference between these
two rates.
In response to the mandated Utah Hospital Comparison
Reports, Chief Executive Officers (CEOs) from two
hospitals have posted online comments explaining that some
of their patients were receiving comfort care or had do not
resuscitate orders9,10
. In these comments the hospital CEOs
suggested that inclusion of such patients in their hospital’s
mortality rates was not appropriate, because these patients
were near the end of their life and more likely to die in
the hospital than patients who received other kinds of care.
However, the developers of AHRQ IQIs have stated that
hospitals do not indicate palliative care patients consistently,
so the AHRQ IQI software does not exclude these patients
from their mortality rate indicators11
.
Hospital concerns about possible distortion of their mor-
tality rate led to this study as a preliminary investigation
based on actual hospital discharge data. Currently, the Utah
Database does not include do not resuscitate data. However,
the Utah Database does include up to nine diagnosis codes
per hospitalization. The International Classification of Dis-
eases, Ninth Revision, Clinical Modification (ICD-9-CM)
includes the diagnosis code V66.7
for “encounter for pallia-
tive care”, which could be used to identify inpatients who
received palliative care during their hospitalization.
According to the ICD-9-CM Coding Clinic, Fourth Quarter
199612
Code V66.7, Encounter for palliative care, has been cre-
ated effective October 1, 1996, to classify encounters
for end-of-life care, hospice care and terminal care [in
conjunction with the principal diagnosis code for the un-
derlying disease]. Code V66.7 may be assigned as an ad-
ditional code to identify patients who receive palliative
care in any health care setting, including a hospital.
Palliative care is an alternative to aggressive treatment
for patients who are in the terminal phase of their ill-
ness. Palliative care is focused towards management of
pain and symptoms and is often more appropriate than
aggressive hospital treatment for patients dying of incur-
able diseases….(pp. 47-48).
The Coding Clinic, First Quarter 199813
, adds
Code V66.7…. may be used when a patient is brought
in for aggressive treatment for a terminal condition and
during the encounter it is determined that further ag-
Figure 1. Rate of Palliative Care Inpatients* by Year, Utah and U.S., 2000-2006
43.4
58.4
70.8
83.6
99.5
157.7
192.8
152.2
213.0
200.9
217.9
288.2
261.3
0.0
50.0
100.0
150.0
200.0
250.0
300.0
350.0
2000 2001 2002 2003 2004 2005 2006
Year
Per100,000Inpatients
Utah
U.S.
Inpatients*: Maternity, and newborn (MDC 14 and MDC 15) patients are excluded.
2008 Utah’s Health: An Annual Review
©2008 The University of Utah. All Rights Reserved. 19The Effect of Palliative Care Inpatients for In-hospital Mortality Rates
gressive treatment is no longer appropriate and palliative
care is initiated.
The physician documentation in the medical record must
substantiate that palliative care is being given. Terms
such as comfort care, end-of-life care and hospice care
are all synonymous with palliative care…. The care
provided must be aimed only at relieving pain and dis-
comfort for the palliative care code to be applicable (pp.
11-12).
The current paper includes three sets of findings related
to use of this palliative care code. First, the paper includes
trend data on the use of the palliative care code in Utah
and the U.S. Second, it compares mortality rates at the state
level (Utah overall) and the hospital level when patients
with a palliative care code (palliative care discharges) are
excluded and when they are included. Third, the paper ex-
amines the diagnosis codes, procedure codes and length of
hospital stay for deceased patients that hospitals stated were
receiving comfort care when they died in the hospital.
Methods
Definitions
Hospitals included in this study (n=39) included all non-
specialty acute care hospitals plus one federal hospital and
one orthopedic specialty hospital. Other hospitals, such as
children’s, psychiatric, rehabilitation and long-term care
hospitals, were excluded.
Utah overall includes all 39 acute care hospitals combined
for a specified AHRQ IQI.
Years cited in this study were calendar years, that is, from
January 1 through December 31 for each year5
.
“Inpatients” are patients that spent at least 24 hours in the
hospital5
.
“Hospital discharge” or “discharge” is a hospital stay5
,
which is the unit of analysis for this study. One person may
have had more than one discharge.
“Palliative care discharge” was defined as an inpatient
hospital stay for which the palliative care ICD-9-CM code
(V66.7, “encounter for palliative care”)12
was a secondary
diagnosis. Code V66.7 cannot be used as a principal
diagnosis.
Large hospitals have more than 300 beds. Medium hospitals
have between 100 and 300 beds. Small hospitals have less
than 100 beds.
Data and Analyses
For the trend data, the annual national rate of palliative care
discharges per 100,000 discharges was obtained through the
HCUPnet online query system14
for the National Inpatient
Sample (NIS) for the years 2000 through 2005, the most
recent years of available NIS data when this paper was
written. The annual Utah rate of palliative care discharges
per 100,000 discharges was obtained through the HCUPnet
online query system for the State Inpatient Databases (SID)
for Utah for the years 2000 through 2006, the most recent
years of available SID data when this paper was written. As
Utah has a high birth rate compared to the rest of the nation
and maternity and newborn patients are unlikely to receive
palliative care discharges, maternity (Major Diagnosis
Category or MDC 14) and newborn (MDC 15) discharges
were excluded from both the NIS data and the SID data for
Utah.
For the AHRQ IQIs, the Utah rate of palliative care dis-
charges was determined using the AHRQ IQI software and
SAS, Version 9.1, on data from the Utah Database. Some
AHRQ IQIs are for relatively rare procedures or condi-
tions and have small denominators among Utah inpatients.
Hence the three most recent years of available data from
the Utah Database, 2004 through 2006, were combined and
used as the input data. This study reports findings on the
nine AHRQ IQI mortality indicators that had at least 4,800
Utah discharges in the denominator for this three year pe-
riod. These AHRQ IQIs exclude maternity, newborn and
pediatric discharges.
First, the AHRQ IQI software was run on the input data
including palliative care discharges. Second, the software
was run on the input data excluding palliative care
discharges. Third, the resulting numerators, denominators,
observed and expected rates for in-hospital deaths were
compared by AHRQ IQI for Utah overall and for each
hospital. The statistical significance test for differences
between the observed and expected mortality rates was the
Exact 95% confidence intervals (Exact CI)6
. The Exact CI is
more appropriate for small numbers, which the AHRQ IQIs
generate for some Utah hospitals for three years of data,
than the more commonly used 95% Confidence Interval
method. Fourth, the Utah Database data for deceased
patients that two hospitals stated had received comfort care
were examined for the presence or absence of the palliative
care code.
Findings
The annual rate of palliative care discharges has increased
significantly from 2000 through 2005 for the U.S. and
Utah (see Figure 1). The rate of palliative care discharges
is significantly lower for Utah than in the U.S. for each
2008 Utah’s Health: An Annual Review
20 ©2008 The University of Utah. All Rights Reserved.The Effect of Palliative Care Inpatients for In-hospital Mortality Rates
Table 1. Inpatients+ by Agency for Healthcare Research and Quality Inpatient Quality Indicators for In-hospital Mortality, Utah, 2004-
2006
Stroke (IQI 17) Deaths (Num)
At Risk
Patients
(Denom)
Observed
Rate
(Num/Denom)
Expected
Rate
Including Palliative Care Patients 673 6228 10.8% * 11.3%
Excluding Palliative Care Patients 619 6149 10.1% * 11.3%
Change in Rates 0.7% 0.0%
Palliative Care Patients Only 54 79 68.4%
Congestive Heart Failure (IQI
16)
Including Palliative Care Patients 409 10165 4.0% 4.7%
Excluding Palliative Care Patients 385 10131 3.8% 4.7%
Change in Rates 0.2% 0.0%
Palliative Care Patients Only 24 34 70.6%
Pneumonia (IQI 20)
Including Palliative Care Patients 579 16278 3.6% 5.3%
Excluding Palliative Care Patients 560 16253 3.4% 5.3%
Change in Rates 0.1% 0.0%
Palliative Care Patients Only 19 25 76.0%
Heart Attack (IQI 32)
Including Palliative Care Patients 418 6582 6.4% 6.1%
Excluding Palliative Care Patients 413 6573 6.3% 6.1%
Change in Rates 0.1% 0.0%
Palliative Care Patients Only 5 9 55.6%
Balloon Angioplasty (IQI 30)
Including Palliative Care Patients 250 15839 1.6% 1.6%
Excluding Palliative Care Patients 250 15839 1.6% 1.6%
Change in Rates 0.0% 0.0%
Palliative Care Patients Only 0 0 0.0%
Heart Bypass Surgery (IQI 12)
Including Palliative Care Patients 181 5112 3.5% 3.7%
Excluding Palliative Care Patients 180 5111 3.5% 3.7%
Change in Rates 0.0% 0.0%
Palliative Care Patients Only 1 1 100.0%
Hip Fracture (IQI 19) Hip fracture deaths including palliative care patients
Including Palliative Care Patients 149 4973 3.0% 3.0%
Excluding Palliative Care Patients 146 4968 2.9% 3.0%
Change in Rates 0.1% 0.0%
Palliative Care Patients Only 3 5 60.0%
Hip Replacement (IQI 14) Hip replacement deaths including palliative care patients
Including Palliative Care Patients 10 5703 0.2% 0.2%
Excluding Palliative Care Patients 10 5703 0.2% 0.2%
Change in Rates 0.0% 0.0%
Palliative Care Patients Only 0 0 0.0%
Gastrointestinal Hemorrhage
(IQI 18)
Gastrointestinal hemorrhage deaths including palliative
care patients
Including Palliative Care Patients 139 7173 1.9% 3.0%
Excluding Palliative Care Patients 136 7168 1.9% 3.0%
Change in Rates 0.0% 0.0%
Palliative Care Patients Only 3 5 60.0%
Total 109 158 69.0%
2008 Utah’s Health: An Annual Review
©2008 The University of Utah. All Rights Reserved. 21The Effect of Palliative Care Inpatients for In-hospital Mortality Rates
Table 2. Palliative Care Inpatients+ by Agency for Healthcare Research and Quality Inpatient Quality Indicator and
Hospital, Utah, 2004-2006
Stroke (IQI 17)
Hospital
Palliative Care
Deaths
Palliative Care
Discharges
Actual Rate
Change++
Changed Comparison of Observed Rate
With Expected Rate?
Stroke (IQI 17)
Utah Overall 54 79 1% Yes, from same to observed is lower.
Hospital 1 26 37 4% Yes, from same to observed is lower.
Hospital 2 8 11 1% Yes, from same to observed is lower.
Hospital 3 6 7 1% Yes, from same to observed is lower.
Hospital 4 2 5 5%
Hospital 5 1 4 0%
Hospital 6 2 3 0%
Hospital 7 2 3 1%
Hospital 8 1 2 2%
Hospital 9 1 2 1%
Hospital 10 1 1 17%
Hospital 11 1 1 1%
Hospital 12 1 1 1%
Hospital 13 1 1 1%
Hospital 14 1 1 1%
Congestive Heart Failure (IQI 16)
Utah Overall 24 34 0%
Hospital 1 7 12 1% Yes, from same to observed is lower.
Hospital 7 5 6 1%
Hospital 3 2 3 0%
Hospital 14 3 3 1%
Hospital 12 2 2 1%
Hospital 6 1 2 0%
Hospital 2 1 2 0% Yes, from same to observed is lower.
Hospital 4 1 1 1%
Hospital 17 1 1 4%
Hospital 16 1 1 0%
Hospital 18 0 1 0%
Pneumonia (IQI
20)
Utah Overall 19 25 0%
Hospital 1 11 15 1%
Hospital 7 2 3 0%
Hospital 9 1 2 0%
Hospital 11 1 1 0%
Hospital 12 1 1 0%
Hospital 15 1 1 1%
Hospital 3 1 1 0%
Hospital 16 1 1 0%
2008 Utah’s Health: An Annual Review
22 ©2008 The University of Utah. All Rights Reserved.The Effect of Palliative Care Inpatients for In-hospital Mortality Rates
year, yet the rate of increase over the years is greater in
Utah than in the U.S. from 2004 through 2006. In other
words, although the U.S. rate of palliative care discharges
is higher than Utah’s, the gap has narrowed. The Utah
annual rate increased from 43.4 (CI=30.5 to 56.3) palliative
care discharges per 100,000 discharges in 2000 to 192.8
(CI=165.6 to 220.0) palliative care discharges per 100,000
discharges in 2006. The U.S. annual rate increased from
152.2 (CI=152.1 to 152.3) palliative care discharges per
100,000 discharges in 2000 to 261.3 (CI=261.2 to 261.4)
palliative care discharges per 100,000 discharges in 2005.
For Utah overall, the number and rate of palliative care
discharges varied by AHRQ IQI (see Table 1). Of the
nine AHRQ IQIs examined in this study, seven indicators
included at least one palliative care discharge from 2004
through 2006. The two indicators with no palliative care
discharges were Balloon Angioplasty (IQI 12) and Hip
Replacement (IQI 19). The majority, but not all, of, palliative
care discharges for these seven indicators were deaths
(109/158= 69%). discharges were deaths in the hospital.
Indicators with the most palliative care discharges for Utah
overall were Stroke (IQI 17), Congestive Heart Failure
(IQI 16) and Pneumonia (IQI 20), 97 out of 138 (70%) of
which were deaths. For Utah overall, the Stroke (IQI 17)
discharges included 79 palliative care discharges of which
54 (68%) were deaths. The Congestive Heart Failure (IQI 16)
discharges included 34 palliative care discharges of which
24 (71%) were deaths. The Pneumonia (IQI 20) discharges
included 25 palliative care discharges of which 19 (76%)
were deaths. The palliative care discharges that were not
deaths were patients that were discharged to home, hospice
or home health care programs or transferred to other health
care facilities. Most palliative care discharges were for
patients who were 65 years of age or older (546/700 =78% of
all Utah palliative care discharges from 2004 through 2006).
Because the other six IQIs examined in this study included
fewer than 10 palliative care discharges per indicator for
Utah overall from 2004 through 2006, further analyses
were not reported at the hospital level in this study due to
possible unreliability associated with small numbers.
Among the 39 Utah hospitals included in this study,
Hospital 1 had the most palliative care discharges: 64
(46%) of the 138 palliative care discharges for these
three indicators with 37 (47%) of the 79 Utah overall
stroke discharges (IQI 17), 12 (35%) of the 34 Utah
overall congestive heart failure discharges and 15 (60%)
of the 25 Utah overall pneumonia discharges (IQI 20) (see
Table 2. Hospital totals for stroke, congestive heart failure
and pneumonia are not in Table 2 but are derived from it).
Hospital 2 had the second highest number of palliative care
discharges: 13 (9%) of the palliative care discharges for
Stroke, Congestive Heart Failure and Pneumonia with 11
(14%) for stroke patients and two (9%) for congestive heart
failure patients. Hospital 7 had the third highest number
of palliative care discharges, 12 (9%) of the palliative
care patients for Stroke, Congestive Heart Failure and
Pneumonia with three (9%) for stroke patients, six (18%)
for congestive heart failure patients and three (12%) for
pneumonia patients.
All four of these hospitals are urban hospitals. However, they
differ in several ways. Two of these hospitals are teaching
hospitals, and the other two are not teaching hospitals.
Two belong to the same hospital system, one belongs to
a different hospital system and the fourth is freestanding.
Two are large hospitals. The others are medium hospitals.
In short, the four hospitals with the greatest number of
palliative care discharges for stroke, congestive heart failure
and pneumonia had little in common other than the fact that
all four are urban hospitals.
When palliative care discharges were excluded, the Stroke,
Congestive Heart Failure and Pneumonia IQIs showed the
largest decrease in the Utah overall observed mortality rate
for those conditions (see Table 1).. Exclusion of palliative
care discharges did not change the Utah overall expected
mortality rate to seven decimal places for any of the
indicators.
The number and rate of palliative care discharges varied
by AHRQ IQI among the 39 Utah hospitals in this study
(see Table 2). Eighteen hospitals had at least one palliative
care discharge from 2004 through 2006. Among these 18
hospitals, four hospitals had palliative care discharges for
all three indicators: stroke (IQI 17), congestive heart failure
(IQI 16) and pneumonia (IQI 20). Seven additional hospitals
had palliative care discharges for two of these three
indicators. The remaining seven hospitals had palliative
care discharges for one of these three indicators. The
eighteen hospitals that had palliative care discharges for at
least one of these three indicators included urban and rural
hospitals, large, medium and small hospitals, teaching and
non teaching hospitals, and hospitals from most hospital
systems in Utah as well as some freestanding hospitals.
Oneimportantquestioniswhetherexclusionofpalliativecare
discharges changes the results of the comparison between
observed and expected mortality rate, using the Exact CI as
the test for statistical significance. The answer is yes, in some
cases. For stroke, the Utah overall observed mortality rate
shifted from statistically the same as the expected mortality
rate to statistically lower than the expected mortality rate,
as did the observed mortality rate for Hospitals 1, 2 and
3. For congestive heart failure, the observed mortality rate
2008 Utah’s Health: An Annual Review
©2008 The University of Utah. All Rights Reserved. 23The Effect of Palliative Care Inpatients for In-hospital Mortality Rates
shifted from statistically the same as the expected mortality
rate to statistically lower than the expected mortality rate
for Hospitals 1 and 2. For pneumonia, no shifts occurred
when palliative care discharges were excluded.
In two online Utah Hospital Comparison Reports, two
hospitals posted comments stating that a portion of their in-
hospital deaths were patients receiving comfort care. One
hospital stated that among the 15 adult pneumonia patients
that died at their hospital in 2003 through 2005, 14 were
receiving “comfort care.” These patients’ discharge data
were identified in the Utah Database which captures up to
nine diagnoses and up to six procedures per hospital visit.
None of these 15 pneumonia patients’ discharge data had
a palliative care code. Fourteen of the pneumonia patients
had less than nine diagnosis codes, so the Hospital Database
had captured all of these patients’ reported diagnosis codes
and may have captured all of the fifteenth patient’s reported
codes. Twelve of these fifteen pneumonia patients had no
procedure codes. Among the patients that had procedure
codes, the first had an intratracheal tube inserted, the second
received a transfusion of packed cells and the third received
a transfusion of packed cells and a transfusion of platelets.
Whether “comfort care” would include such procedures, or
if palliative care was chosen after they were performed is
unknown.
Another hospital stated that among the 17 adult hip fracture
patients that died at their hospital in 2002 through 2004,
six were receiving comfort care. None of these 17 patients’
records contained a palliative care code. Twelve of these 17
hip fracture patients had less than nine diagnosis codes, so
theUtahDatabasehadcapturedallofthesepatients’reported
diagnosis codes and may have captured all of the remaining
five patient’s reported codes. Two of the 17 patients had
no procedure codes. Patients with a hip fracture and no
procedure codes may have received comfort care only, or
they may have died in the hospital before any procedures
could be performed. The data did not permit distinction
between these two kinds of patients. As with the pneumonia
patients, whether these patients chose palliative care after
receiving more aggressive treatment is unknown.
Conclusions
Hospitals’ concerns about possible distortion of their
mortality rate led to this study as a preliminary investigation
based on hospital discharge data. Searching for the palliative
care diagnosis code (V66.7) seemed like a possible way
to identify patients who received comfort care. Some of
the findings were as expected. For example, no balloon
angioplasty or hip replacement patients had a palliative care
code for Utah overall. Only one heart bypass patient had a
palliative care code for Utah overall. These findings are not
surprising, because patients receiving this kind of treatment
were expected to experience improvement in their condition
andwerenotexpectedtodieduringorshortlyaftertreatment.
In contrast, stroke, congestive heart failure and pneumonia
are conditions that often are associated with the end of a
person’s life, so finding palliative care discharges among
patients with these conditions was not surprising. At first
glance, finding that some palliative care patients did not die
in the hospital seemed surprising. However some palliative
care patients may have had more than one hospital stay for
palliative care before they eventually died in the hospital or
elsewhere.
Finding no palliative care patients among the 32 patients
that two hospitals claimed received palliative care was
surprising. This finding supports AHRQ’s claim that
hospitals do not use the palliative care code consistently.
Inconsistent use of this code may be due to several reasons.
As stated earlier, physician documentation in the medical
record must substantiate that palliative care is being given
before medical coding personnel can assign the palliative
care code. Possibly the patients that the two hospitals stated
had received comfort care did not have sufficient physician
documentation to be assigned the palliative care code. If
documentation from other health care professionals were
present in the hospital’s patient record, the hospital may
have considered these patients to be palliative care patients.
Alternatively, these patients may have entered the hospital
for aggressive treatment and perhaps later during their stay
they, or their advocates, chose comfort care. Coders may
have neglected to assign the palliative care code to these
patients’ discharge records. Because coding is oriented
toward hospital charges and reimbursement for care that the
hospital provides, coding may not sufficiently describe all
patient care. Or some hospitals may specialize in palliative
care and attract patients who choose this kind of care. For
whatever reasons, the palliative care code does appear to be
used sparingly and inconsistently in Utah. This study found
a maximum of 302 discharges which used the palliative
care code out of approximately 150,000 non-maternity and
non-newborn inpatient hospital discharges per year for Utah
overall. Reasons for the absence of change in the expected
mortality rate when palliative care patients are excluded are
unclear. These findings warrant further investigation.
These considerations withstanding, this study’s findings
suggest that the hospitals’ concerns about the inclusion of
patientswithapalliativecarecodeintheirmortalitynumbers
andratesarewarranted.Thedegreetowhichthesedischarges
affected the statistical comparison between observed and
expected mortality rate was significant for Utah overall and
for three hospitals for the Stroke IQI 17 and for two of the
same three hospitals for the Congestive Heart Failure IQI
2008 Utah’s Health: An Annual Review
24 ©2008 The University of Utah. All Rights Reserved.The Effect of Palliative Care Inpatients for In-hospital Mortality Rates
18. Because the Utah Hospital Comparison Reports include
hospital ratings based on this comparison of observed and
expected rates of mortality, the appropriate handling of
palliative care discharges needs to be addressed through
future dialogue with AHRQ and the hospitals. Perhaps the
findings from this study can contribute constructively to
this dialogue.
The goal of this study is to contribute preliminary findings
on comparison of AHRQ IQI mortality rates when palliative
care discharges were included and excluded. While the
study achieved this goal, it raised new questions that need
to be addressed. Because of the possible variation in coding
among hospitals, possible differences in the portion of
patients that seek palliative care by hospital and insufficient
clinical detail of ICD-9-CM codes, analysts should use
caution when deciding whether they will include or exclude
palliative care discharges when using the AHRQ IQIs for
mortality rates. Also, the Utah Department of Health may
wish to consider do not resuscitate orders as a new required
data element when it reviews its required data elements for
hospital submission of discharge data. Availability of do not
resuscitate orders, as well as consistent use of the palliative
care code, would help to further improve the appropriate
determination of in-hospital mortality rates.
Acknowledgements
The author wishes to thank the following colleagues for
reviewing this article and making suggestions that improved
it: Keely Cofrin Allen, PhD, Paul Hougland, MD, and Wu
Xu, PhD, all with the Utah Department of Health. The author
also wishes to thank Jan Orton and Cindy Hutchinson for
information about the palliative care code. John Morgan
explored the lack of change in the expected rates when the
palliative care discharges were excluded.
References
1.	 Utah State Senate Bill, SB 132 Health Care Consumer Bill, http://www.
le.state.ut.us/~2005/bills/sbillenr/sb0132.htm
2.	 Utah Hospital Comparison Reports http://health.utah.gov/myhealthcare/
3.	 Agency for Healthcare Research and Quality Inpatient Quality Indicators
http://www.qualityindicators.ahrq.gov/iqi_overview.htm
4.	 Agency for Healthcare Research and Quality Inpatient Quality Indicators
Download http://www.qualityindicators.ahrq.gov/iqi_download.htm
5.	 Utah Hospital Inpatient Discharge Data Standard Report I (ST1:06)
http://health.utah.gov/hda/Reports/ST1_06.pdf
6.	 Agency for Healthcare Research and Quality Indicators, Guide to
Inpatient Quality Indicators, Version 3.1, March 12, 2007. http://www.
qualityindicators.ahrq.gov/downloads/iqi/iqi_guide_v31.pdf
7.	 Utah Hospital Comparison Reports Technical Document http://health.
utah.gov/myhealthcare/reports/2007/heart/2007heartTechnical.pdf
8.	 Agency for Healthcare Research and Quality Inpatient Quality Indicators,
Technical Specifications, Version 3.1 (March 12, 2007) http://www.
qualityindicators.ahrq.gov/downloads/iqi/iqi_technical_specs_v31.pdf
9.	 Hospital comments http://health.utah.gov/myhealthcare/reports/
pneumonia2006/uintahComment.tif
10.	 Hospitalcommentshttp://health.utah.gov/myhealthcare/reports/hip2006/
comment/timpanogos.pdf
11.	 Geppert, J. (AHRQ QI Support). Personal communication. May 1, 2007.
12.	 Coding Clinic, Fourth Quarter 1996.
13.	 Coding Clinic, First Quarter 1998.
14.	 Healthcare Cost and Utilization Project http://hcupnet.ahrq.gov/
2008 Utah’s Health: An Annual Review
©2008 The University of Utah. All Rights Reserved. 25Cancer Incidence and Mortality Trends in Utah
Cancer Incidence and Mortality Trends
in Utah: 1973-2004
Authors:
Antoinette M. Stroup, PhD
Rosemary Dibble, CTR
C. Janna Harrell, MS
Abstract
Introduction: We examined age-adjusted cancer incidence and mortality data in
Utah and evaluated long-term trends from 1973-2004.
Methods: This report assesses cancer incidence and mortality from 1973-2004. Long-
term trends were analyzed using joinpoint analysis.
Results: Prostate and female breast cancers were the leading incident cancers in
Utah. The leading mortality rates were for lung cancer and prostate cancer in men,
and breast cancer in women. Long-term incidence trends were driven by prostate
cancer. Long-term declines in mortality were due to declines in lung, prostate, and
colorectal cancers.
Conclusion: Utah’s overall cancer incidence and mortality from 2000-2004 continues
to be substantially lower than national averages. Unlike national trends, the age-
adjusted incidence of female breast cancer in Utah has not changed significantly since
1973. Utah’s long-term cancer mortality rates have been declining at a slower rate and
for a longer period of time than national trends.
Introduction
Utah is best known for its markedly lower cancer mortality compared to the rest of the
United States (US). In 2004, the cancer mortality rate in Utah was 139.1 cancer deaths
per 100,000.1
This was 25% below the national average.1
The American Cancer Society
estimated that Utah will experience a 16% rise in the number of new cancer cases
diagnosed from 2006 to 2007 and a 1% rise in the number of cancer deaths for same
time period (American Cancer Society, 2007). This contrasts with national estimates,
which are only expected to increase by about 3% for new cases and decline by 1%
for cancer deaths (American Cancer Society, 2007). Long-term national surveillance
data, however, shows a significant downward trend in cancer incidence, dropping at
an average annual rate of 0.3% per year from 1992-2004 (Espey, et al., 2007). Cancer
mortality is declining at an even faster rate, 1.1% per year from 1993-2002 and 2.1%
per year from 2002-2004 (Espey, et al., 2007). If cancer incidence and mortality in
Utah typically diverges from national patterns, it’s reasonable to question whether
Utah is experiencing the same long-term trends as the rest of the US. In this article,
we examine age-adjusted cancer incidence and mortality rates and evaluate long-
term trends from 1973-2004. These trends are then compared to the national profile.
Keywords
Cancer incidence, cancer mortality,
Utah
Brief Bios
Antoinette M. Stroup, PhD has
an MS in Family Ecology from the
University of Utah and a PhD in
Epidemiology from the University
of California. She is Co-Principal
Investigator and Deputy Director of
the Utah Cancer Registry (UCR)
She has a faculty appointment in the
Division of Clinical Epidemiology,
Department of Internal Medicine at
the University of Utah. She studies
cancer epidemiology and is currently
working on collaborative projects in
cancer registry informatics.
Rosemary Dibble, CTR, is the
Director of Operations at the Utah
Cancer Registry. She has served on
national cancer committees for the
National Cancer Institute’s Sur-
veillance, Epidemiology, and End
Results (SEER) Program, the North
American Association of Central
Cancer Registries (NAACCR), and
the American College of Surgeons.
During her more than 20-year tenure
as Director of Operations, the Utah
Cancer Registry has received 10
NAACCR awards and has consis-
tently been one of the top ranked
SEER registries in the nation.
C. Janna Harrell, MS, is the Senior
Research Analyst at the Utah Cancer
Registry. She has a Master’s of Science
in Family Ecology, a certificate in
Demography, a certificate in Global
Population and Reproductive Health,
and is SAS certified. She has been
with the Utah Cancer Registry since
2005.
2008 Utah’s Health: An Annual Review
26 ©2008 The University of Utah. All Rights Reserved.Cancer Incidence and Mortality Trends in Utah
Methods
This report contains incidence and mortality data for
cancer cases and deaths occurring between January 1, 1973
and December 31, 2004, and reported to the Utah Cancer
Registry as part of routine cancer surveillance for the Utah
Department of Health and the National Cancer Institute’s
Surveillance, Epidemiology and End Results (SEER)
Program. Incident data are presented for all primary,
invasive cancers, and grouped following the conventions of
the SEER program, which uses primary site and histology
codes defined in the International Classification of Diseases
for Oncology (ICD-O), Third Edition (Fritz, et al., 2000).
Rates and 95% confidence intervals were generated using
SEER*Stat v6.3.1,2
Cancer incidence and death rates are
expressed per 100,000 persons and are age-adjusted to the
2000 U.S. standard population. Long-term cancer incidence
and mortality trends (1973 through 2004) were analyzed
using joinpoint analysis, which is a statistical method that
describes changing trends over successive segments of time
by selecting the best fitting point or points where the rate
of increase or decrease changes significantly. Significant
trends were determined using the annual percent change
(APC) statistic for each segment and set at p<0.05.3
Results
Age-Adjusted Incidence 2000-2004
The age-adjusted cancer incidence from 2000-2004 was
407.0 per 100,000 (Table 1). Cancer incidence for men
and women, however, were dramatically different at 487.6
and 345.2 per 100,000, respectively. The leading cancer
site among men was the prostate. This was followed by
colorectal, lung and bronchus, and urinary bladder cancers.
Breast was the most frequent type of cancer among Utah
women, followed by colorectal, corpus and uterus, and lung
and bronchus cancers.
				
Age-Adjusted Mortality 2000-2004
The age-adjusted cancer mortality rate from 2000-2004 was
144.0 per 100,000 (Table 2). Like the gender differences
found in cancer incidence, cancer mortality was higher
among men. The two leading causes of cancer deaths among
men were cancers of the lung and bronchus and prostate. For
Utah women, deaths from breast cancer outranked deaths
from lung and colorectal cancers.
Long-term Cancer Incidence Trends, 1973-2004
When we examined cancer incidence trends in Utah from
1973 to 2004, four distinct joinpoint segments were found
(Table 3). Further analysis showed that this trend was
driven by prostate cancer incidence after the widespread
adoption of PSA screening in the early 1990s. Prostate
cancer incidence increased rapidly, by over 21% per year,
from 1989-1992 and abruptly decreased by almost 16% per
year from 1992-1995. Prostate cancer incidence continued
to rise from 1995-2004, although at a more modest rate.
Since 1973 men in Utah have experienced a steady but
significant increase in melanoma. Since the mid-1980s
they have had a significant decline in colorectal and lung
cancers. Female colorectal and uterine cancer incidence has
decreased significantly since 1973, while cancer incidence
for melanoma has been increasing for the entire time period
1973-2004. From 1973 to 1987, female lung cancer incidence
significantly increased at a rate of 5.075% per year, but
stabilized from 1987 through 2004. With the decreasing
lung cancer incidence in men and the increasing rates
among women, we see the gap closing between the men
and women (Figure 1). There were no significant joinpoint
trends for age-adjusted breast cancer incidence among Utah
women.
Long-term Cancer Mortality Trends, 1973-2004
After experiencing a significant increase from 1973-1993,
Utah’s age-adjusted cancer mortality rate decreased by
1% per year through 2004 (Table 4). After stratifying the
analysis by sex, cancer mortality rates remained relatively
stable for both women and men until 1993 and 1998,
respectively (Figure 2). By 1993, women started to show a
slight, but significant decrease in cancer mortality (-0.936
APC); and, although the decline in cancer morality did not
begin until 1998, declines for men were more pronounced
(-2.336 APC).
Long-term trends by sex and cancer site showed that
much of the later decline in cancer mortality among men
was attributable to declines in prostate, colorectal, and
lung cancer mortality. Men, however, also experienced
a significant and consistent mortality increase from non-
Hodgkin’s lymphoma (+1.387 APC) for the entire period
1973-2004. Women experienced significant, steady declines
in mortality due to breast and colorectal cancers. Mortality
trends due to lung cancer for women are substantially
different than the trends for men. From 1973-1989, lung
cancer mortality rose by more than 5% per year among Utah
women. Since 1989, however, the lung cancer mortality rate
among women has remained stable.
Discussion
Utah continues to have one of the lowest cancer incidence
andmortalityratesintheNation.Whencomparedtonational
averages, Utah’s overall cancer incidence from 2000-2004
is approximately 14% and 16% lower for men and women,
2008 Utah’s Health: An Annual Review
©2008 The University of Utah. All Rights Reserved. 27Cancer Incidence and Mortality Trends in Utah
Table 1. Utah Average Annual Age-Adjusted Cancer Incidence by Sex 2000-2004
Sex and Rank Site
Rate per
100,000
Lower CI Upper CI
Both Sexes All Sites 407.0 402.7 411.3
Male All Sites 487.6 480.6 494.7
1 Prostate 186.3 181.9 190.7
2 Colon and Rectum 47.5 45.3 49.8
3 Lung and Bronchus 40.3 38.2 42.4
4 Urinary Bladder 29.4 27.6 31.2
5 Melanoma of the Skin 27.2 25.6 28.9
6 Non-Hodgkin Lymphoma 23.2 21.7 24.7
7 Leukemia 16.2 14.9 17.5
8 Kidney and Renal Pelvis 13.2 12.1 14.4
9 Oral Cavity and Pharynx 11.6 10.6 12.7
10 Pancreas 11.3 10.3 12.5
11 Brain and Other Nervous System 8.0 7.2 8.9
12 Stomach 7.5 6.7 8.4
13 Testis 6.9 6.3 7.7
14 Myeloma 6.9 6.1 7.8
15 Esophagus 5.8 5.1 6.6
Female All Sites 345.2 339.9 350.6
1 Breast 115.7 112.6 118.9
2 Colon and Rectum 35.2 33.5 37.0
3 Corpus and Uterus, NOS 22.8 21.4 24.2
4 Lung and Bronchus 20.9 19.6 22.3
5 Melanoma of the Skin 18.5 17.3 19.7
6 Thyroid 16.1 15.0 17.2
7 Non-Hodgkin Lymphoma 15.7 14.6 16.9
8 Ovary 12.9 11.9 14.0
9 Leukemia 9.5 8.6 10.4
10 Pancreas 7.7 7.0 8.6
11 Kidney and Renal Pelvis 7.6 6.8 8.5
12 Urinary Bladder 6.5 5.8 7.3
13 Cervix Uteri 6.2 5.5 7.0
14 Brain and Other Nervous System 6.0 5.3 6.7
15 Oral Cavity and Pharynx 5.3 4.6 6.0
Source: Surveillance, Epidemiology, and End Results (SEER) Program (www.seer.cancer.gov)
SEER*Stat Database: Incidence - SEER 9 Regs Limited-Use, Nov 2006 Sub (1973-2004) - Linked To
County Attributes - Total U.S., 1969-2004 Counties, National Cancer Institute, DCCPS, Surveillance
Research Program, Cancer Statistics Branch, released April 2007, based on the November 2006
submission.
Rates are per 100,000 and age-adjusted to the US Std Population (19 age groups- Census p25-1130)
standard.
Confidence Intervals (Tiwari mod) are 95% for rates.
2008 Utah’s Health: An Annual Review
28 ©2008 The University of Utah. All Rights Reserved.Cancer Incidence and Mortality Trends in Utah
Table 2. Utah Average Annual Age-Adjusted Cancer Mortality by Sex 2000-2004
Sex and Rank Site
Rate per
100,000
Lower CI Upper CI
Both Sexes All Sites 144.0 141.5 146.7
Male All Sites 176.5 172.1 180.9
1 Lung and Bronchus 34.9 33.0 36.9
2 Prostate 27.6 25.8 29.5
3 Colon and Rectum 17.1 15.7 18.5
4 Pancreas 11.1 10.1 12.3
5 Non-Hodgkin Lymphoma 9.8 8.8 10.9
6 Leukemia 9.3 8.4 10.4
7 Urinary Bladder 6.2 5.3 7.1
8 Brain and Other Nervous System 5.7 5.0 6.5
9 Esophagus 5.5 4.7 6.3
10 Myeloma 5.1 4.4 5.9
11 Kidney and Renal Pelvis 4.4 3.8 5.2
12 Melanoma of the Skin 4.3 3.7 5.0
13 Liver and Intraheptic Bile Duct 4.2 3.6 4.9
14 Stomach 4.0 3.4 4.8
15 Oral Cavity and Pharynx 2.7 2.2 3.2
Female All Sites 120.8 117.6 124.0
1 Breast 23.0 21.6 24.4
2 Lung and Bronchus 17.0 15.8 18.2
3 Colon and Rectum 12.7 11.7 13.7
4 Ovary 8.3 7.4 9.1
5 Pancreas 7.2 6.5 8.0
6 Non-Hodgkin Lymphoma 5.8 5.1 6.5
7 Leukemia 5.4 4.7 6.1
8 Corpus and Uterus, NOS 4.3 3.7 5.0
9 Brain and Other Nervous System 3.4 2.9 4.0
10 Myeloma 3.0 2.5 3.6
11 Stomach 2.3 1.9 2.8
12 Liver and Intraheptic Bile Duct 2.3 1.9 2.8
13 Melanoma of the Skin 2.1 1.7 2.6
14 Kidney and Renal Pelvis 2.0 1.6 2.5
15 Cervix Uteri 1.7 1.3 2.1
Source; Surveillance, Epidemiology, and End Results (SEER) Program (www.seer.cancer.gov)
SEER*Stat Database: Mortality - All COD, Public-Use With State, Total U.S. (1969-2004), National
Cancer Institute, DCCPS, Surveillance Research Program, Cancer Statistics Branch, released April
2007. Underlying mortality data provided by NCHS (www.cdc.gov/nchs).
Rates are per 100,000 and age-adjusted to the US Std Population (19 age groups- Census p25-1130)
standard.
Confidence Intervals (Tiwari mod) are 95% for rates.
2008 Utah’s Health: An Annual Review
©2008 The University of Utah. All Rights Reserved. 29Cancer Incidence and Mortality Trends in Utah
Table 3. Surveillance, Epidemiology, and End Results Cancer Incidence Rate Trends with Joinpoint Analysis° for 1973-2004 for the
Top Five Cancers in Utah, by Sex
Trend 1 Trend 2 Trend 3 Trend 4
Sex/Cancer Site Years APC1
Years APC1
Years APC1
Years APC1
All Sites 1973-1989 0.842* 1989-1992 4.623 1992-1995 -3.9 1995-2004 0.790*
Men 1973-1989 0.974* 1989-1992 7.756* 1992-1995 -7.073* 1995-2004 0.898*
Women 1973-2004 0.488*
Male
Prostate 1973-1989 2.327* 1989-1992 21.389* 1992-1995 -15.857* 1995-2004 1.791*
Colon and Rectum 1973-1987 1.23 1987-2004 -1.184*
Melanoma of the Skin 1973-2004 3.372*
Urinary Bladder 1973-2004 0.368
Lung and Bronchus 1973-1984 0.45 1984-2004 -1.368*
Women
Breast 1973-1982 -0.105 1982-1986 5.726 1986-2004 0.225
Colon and Rectum 1973-2004 -0.503*
Melanoma of the Skin 1973-2004 1.977*
Lung and Bronchus 1973-1987 5.075* 1987-2004 0.811
Corpus and Uterus, NOS 1973-2004 -0.907*
Source: Surveillance, Epidemiology, and End Results (SEER) Program (www.seer.cancer.gov) SEER*Stat Database: Incidence - SEER 9
Regs Limited-Use, Nov 2006 Sub (1973-2004) - Linked To County Attributes - Total U.S., 1969-2004 Counties, National Cancer Institute,
DCCPS, Surveillance Research Program, Cancer Statistics Branch, released April 2007, based on the November 2006 submission.
° Joinpoint Regression Program, Version 3.1.beta. June 2006; Statistical Research and Applications Branch, National Cancer Institute.
1.
APC indicates annual percent change and is based on rates that were age-adjusted to the 2000 U.S. standard population (19 age groups;
Census, p25-1130).
* Annual Percent Change (APC) is statistically significantly different from zero (2 sided P<.05).
Figure 1. Utah Incidence Rate Trend with Joinpoint Analysis for 1973-2004 for Lung and Bronchus Cancer, by Sex
0
10
20
30
40
50
60
1973 1975 1977 1979 1981 1983 1985 1987 1989 1991 1993 1995 1997 1999 2001 2003
Year of Diagnosis
Women Men
Age-AdjustedRate
2008 Utah’s Health: An Annual Review
30 ©2008 The University of Utah. All Rights Reserved.Cancer Incidence and Mortality Trends in Utah
respectively.1
This is largely due to lower rates of lung and
colorectal cancers. There are a few cancer types, however,
in which Utah exceeds national averages. From 2000-2004,
the age-adjusted incidence for melanoma in Utah was
30% higher for men and 37% higher for women than the
national averages. Prostate cancer was 16% higher in Utah.
High melanoma rates are likely due to the more intense sun
exposure as a result of the high elevation, and the fact that
Utah has a large fair-skinned population who are known
to be at greatest risk for melanoma compared to other skin
types (Saladi & Persaud, 2005). The higher incidence of
prostate cancer may be due to its familiality. Studies of Utah
pedigrees have found a significant excess of prostate cancer
cases among descendants of a single founder (Neuhausen,
et al.,1999). Many of these descendants currently live in
Utah.
Age-adjusted cancer mortality from 2000-2004 is also
substantially lower than national averages. Utah men and
women die from cancer-related causes at a rate roughly
25% below the national average.1
A unique aspect of cancer
mortality in Utah is that deaths from lung cancer are not
the leading cause of cancer deaths among women. Utah
women die more frequently from breast cancer, which ranks
Table 4. Surveillance, Epidemiology, and End Results Cancer Mortality Rate Trends with
Joinpoint° Analysis for 1973-2004 for the Top Five Cancers in Utah, by Sex
Trend 1 Trend 2
Sex/Cancer Site Years APC1
Years APC1
All Sites 1973-1993 0.271* 1993-2004 -0.960*
Men 1973-1998 0.12 1998-2004 -2.336*
Women 1973-1993 0.274 1993-2004 -0.936*
Male
Prostate 1973-1995 1.387* 1995-2004 -5.595*
Colon and Rectum 1973-1991 0.316 1991-2004 -2.828*
Pancreas 1973-2004 -0.181
Non-Hodgkin's Lymphoma 1973-2004 1.387*
Lung and Bronchus 1973-2004 -0.556*
Women
Breast 1973-2004 -0.682*
Colon and Rectum 1973-2004 -1.379*
Pancreas 1973-2004 -0.142
Lung and Bronchus 1973-1989 5.292* 1989-2004 0.855
Ovary 1973-2004 0.115
Source:Surveillance, Epidemiology, and End Results (SEER) Program (www.seer.cancer.gov)
SEER*Stat Database: Mortality - All COD, Public-Use With State, Total U.S. (1969-2004),
National Cancer Institute, DCCPS, Surveillance Research Program, Cancer Statistics Branch,
released April 2007. Underlying mortality data provided by NCHS (www.cdc.gov/nchs).
° Joinpoint Regression Program, Version 3.1.beta. June 2006; Statistical Research and
Applications Branch, National Cancer Institute.
1.
Annual Percent Change (APC) indicates annual percent change and is based on rates that
were age-adjusted to the 2000 U.S. standard population (19 age groups; Census, p25-1130).
* APC is statistically significantly different from zero (2 sided P<.05).
2008 Utah’s Health: An Annual Review
©2008 The University of Utah. All Rights Reserved. 31Cancer Incidence and Mortality Trends in Utah
Figure 2. Utah Mortality Rate Trend with Joinpoint Analysis for 1973-2004 for All Cancer Sites, by Sex
0
50
100
150
200
250
1973 1975 1977 1979 1981 1983 1985 1987 1989 1991 1993 1995 1997 1999 2001 2003
Year of Death
Age-AdjustedRate
Women Men
second nationally (Espey, et a., 2007). The drastically lower
incidence and mortality rates for lung cancer in Utah have
been attributed in large part to the lifestyle of most Utahns,
, who typically refrain from smoking. According to the
Office of Public Health Assessment, only an average of 12%
of Utahns eighteen years of age and older smoked cigarettes
from 2000-2004 (Office of Public Health, Utah Department
of Health). In 2004 alone, the percentage of smokers was
substantially lower than the US average (10.5% in Utah,
20.9% US-wide) (Kuiper, Bombard, Maurice, & Jackson,
2007).
Unfortunately, the age-adjusted incidence of female breast
cancer in Utah has not changed significantly since 1973. This
is in stark contrast to national trends wherein breast cancer
incidence has been declining at a rate of almost 4% per year
from 2001-2004. We will continue to monitor Utah breast
cancer incidence trends in the coming years, as the case
counts in Utah may be not be enough to show significant
changes in a relatively short time period (2001-2004).
With regard to long-term cancer mortality, national trends
showed sharp declines in the past 12 years (1993-2004).
National cancer mortality declines have accelerated
from 1.1% per year from 1993-2002 to 2.1% per year
from 2002-2004 (Espey, 2007). This reflects significant
reductions in deaths from lung, prostate, female breast, and
colorectal cancers (Espey, 2007). Utah’s long-term cancer
mortality rates, on the other hand, have been declining at
a slower rate and for a longer period of time. Lung cancer
mortality among men, for example, has been declining at
only 0.6% per year since 1973, but significant decreases
nationwide did not appear until 1990 (Espey, 2007). Female
breast cancer mortality also decreased by more than 2%
per year since 1990 nationally (Espey, 2007), but Utah’s
decline in female breast cancer mortality has been slow
and steady at 0.7% per year since 1973. Additionally, the
nation experienced accelerated declines in colorectal
cancer mortality since 1987 in men (-1.9% per year from
1987-2002 and -4.9% per year from 2002-2004) and 1984
in women (-1.8% per year from 1984-2002 and -4.5% from
2002-2004) (Espey, 2007), but Utah’s declines have been
much more modest (-2.8% for men per year from 1991-2004
and -1.4 for women per year since 1973). Taken as a whole,
these findings indicate significant variations in long-term
cancer incidence and mortality trends between Utah and
the nation. Perhaps the nation has just recently begun the
necessary decline required to match Utah’s long-standing
reduction in cancer rates.
Acknowledgements
This research was supported by the Utah Cancer Registry,
which is funded by contract N01-PC-35141 from the
National Cancer Institute’s SEER program with additional
support from the Utah State Department of Health and the
University of Utah.
yyoneoka_birthorderstudy_2008

More Related Content

What's hot

Soep&s presenatation latest
Soep&s presenatation latestSoep&s presenatation latest
Soep&s presenatation latest
University of Massachusetts-Amherst
 
Mental Health Disparities - Research
Mental Health Disparities - ResearchMental Health Disparities - Research
Mental Health Disparities - Research
Ann Hinnen Sparks
 
JA Resume 7-2016
JA Resume 7-2016JA Resume 7-2016
JA Resume 7-2016
Joan Ascheim
 
Health Datapalooza 2013: Datalab - Rick Moser
Health Datapalooza 2013: Datalab - Rick MoserHealth Datapalooza 2013: Datalab - Rick Moser
Health Datapalooza 2013: Datalab - Rick Moser
Health Data Consortium
 
Term Paper_BIG DATA AND ONTARIOS PRIMARY CARE SECTOR (00000003)
Term Paper_BIG DATA AND ONTARIOS PRIMARY CARE SECTOR (00000003)Term Paper_BIG DATA AND ONTARIOS PRIMARY CARE SECTOR (00000003)
Term Paper_BIG DATA AND ONTARIOS PRIMARY CARE SECTOR (00000003)
Emmanuel Casalino
 
Health Datapalooza 2013: Datalab - Jim Craver
Health Datapalooza 2013: Datalab - Jim CraverHealth Datapalooza 2013: Datalab - Jim Craver
Health Datapalooza 2013: Datalab - Jim Craver
Health Data Consortium
 
Medical Orders for Life Sustaining Treatment: An Overview
Medical Orders for Life Sustaining Treatment: An OverviewMedical Orders for Life Sustaining Treatment: An Overview
Medical Orders for Life Sustaining Treatment: An Overview
Greg Bird
 
Standards of Medical Care in Diabetes 2016
Standards of Medical Care in Diabetes 2016Standards of Medical Care in Diabetes 2016
Standards of Medical Care in Diabetes 2016
Utai Sukviwatsirikul
 
C15 ada diabetes care 2016
C15 ada  diabetes care 2016C15 ada  diabetes care 2016
C15 ada diabetes care 2016
Diabetes for all
 
Healthcare in Africa independent study
Healthcare in Africa independent studyHealthcare in Africa independent study
Healthcare in Africa independent study
Kehinde Olugbile
 
Women health profile (indicators)
Women health profile (indicators)Women health profile (indicators)
Women health profile (indicators)
Saeed Sherbeny
 
Tma Hcpc Gme Stakeholder Forum 40808
Tma Hcpc Gme Stakeholder Forum 40808Tma Hcpc Gme Stakeholder Forum 40808
Tma Hcpc Gme Stakeholder Forum 40808
Steve Levine
 
MMWR elimination of mtct thailand june 2016
MMWR elimination of mtct thailand june 2016MMWR elimination of mtct thailand june 2016
MMWR elimination of mtct thailand june 2016
Chuchai Sornchumni
 
Article‘the line betweenintervention and abuse’– autis
Article‘the line betweenintervention and abuse’– autisArticle‘the line betweenintervention and abuse’– autis
Article‘the line betweenintervention and abuse’– autis
AASTHA76
 
CURRICULUM VITAE AS CV 2015[1]
CURRICULUM VITAE  AS CV 2015[1]CURRICULUM VITAE  AS CV 2015[1]
CURRICULUM VITAE AS CV 2015[1]
Aristides Sandoval
 
The Changing Healthcare Workforce - Healthcare Issue Briefings from Modern He...
The Changing Healthcare Workforce - Healthcare Issue Briefings from Modern He...The Changing Healthcare Workforce - Healthcare Issue Briefings from Modern He...
The Changing Healthcare Workforce - Healthcare Issue Briefings from Modern He...
Modern Healthcare
 
FCCC Multi-Year Study Poster Presentation
FCCC Multi-Year Study Poster PresentationFCCC Multi-Year Study Poster Presentation
FCCC Multi-Year Study Poster Presentation
Kesha Stone, MPH
 
Final Thesis_Text Apr23 2005 [Copy]
Final Thesis_Text Apr23 2005 [Copy]Final Thesis_Text Apr23 2005 [Copy]
Final Thesis_Text Apr23 2005 [Copy]
Phan Sok
 
Social Support in the Utilization of Antenatal Care Based On Customer Driven
Social Support in the Utilization of Antenatal Care Based On Customer DrivenSocial Support in the Utilization of Antenatal Care Based On Customer Driven
Social Support in the Utilization of Antenatal Care Based On Customer Driven
irjes
 
Poster Information
Poster Information Poster Information
Poster Information
Javed Khanni
 

What's hot (20)

Soep&s presenatation latest
Soep&s presenatation latestSoep&s presenatation latest
Soep&s presenatation latest
 
Mental Health Disparities - Research
Mental Health Disparities - ResearchMental Health Disparities - Research
Mental Health Disparities - Research
 
JA Resume 7-2016
JA Resume 7-2016JA Resume 7-2016
JA Resume 7-2016
 
Health Datapalooza 2013: Datalab - Rick Moser
Health Datapalooza 2013: Datalab - Rick MoserHealth Datapalooza 2013: Datalab - Rick Moser
Health Datapalooza 2013: Datalab - Rick Moser
 
Term Paper_BIG DATA AND ONTARIOS PRIMARY CARE SECTOR (00000003)
Term Paper_BIG DATA AND ONTARIOS PRIMARY CARE SECTOR (00000003)Term Paper_BIG DATA AND ONTARIOS PRIMARY CARE SECTOR (00000003)
Term Paper_BIG DATA AND ONTARIOS PRIMARY CARE SECTOR (00000003)
 
Health Datapalooza 2013: Datalab - Jim Craver
Health Datapalooza 2013: Datalab - Jim CraverHealth Datapalooza 2013: Datalab - Jim Craver
Health Datapalooza 2013: Datalab - Jim Craver
 
Medical Orders for Life Sustaining Treatment: An Overview
Medical Orders for Life Sustaining Treatment: An OverviewMedical Orders for Life Sustaining Treatment: An Overview
Medical Orders for Life Sustaining Treatment: An Overview
 
Standards of Medical Care in Diabetes 2016
Standards of Medical Care in Diabetes 2016Standards of Medical Care in Diabetes 2016
Standards of Medical Care in Diabetes 2016
 
C15 ada diabetes care 2016
C15 ada  diabetes care 2016C15 ada  diabetes care 2016
C15 ada diabetes care 2016
 
Healthcare in Africa independent study
Healthcare in Africa independent studyHealthcare in Africa independent study
Healthcare in Africa independent study
 
Women health profile (indicators)
Women health profile (indicators)Women health profile (indicators)
Women health profile (indicators)
 
Tma Hcpc Gme Stakeholder Forum 40808
Tma Hcpc Gme Stakeholder Forum 40808Tma Hcpc Gme Stakeholder Forum 40808
Tma Hcpc Gme Stakeholder Forum 40808
 
MMWR elimination of mtct thailand june 2016
MMWR elimination of mtct thailand june 2016MMWR elimination of mtct thailand june 2016
MMWR elimination of mtct thailand june 2016
 
Article‘the line betweenintervention and abuse’– autis
Article‘the line betweenintervention and abuse’– autisArticle‘the line betweenintervention and abuse’– autis
Article‘the line betweenintervention and abuse’– autis
 
CURRICULUM VITAE AS CV 2015[1]
CURRICULUM VITAE  AS CV 2015[1]CURRICULUM VITAE  AS CV 2015[1]
CURRICULUM VITAE AS CV 2015[1]
 
The Changing Healthcare Workforce - Healthcare Issue Briefings from Modern He...
The Changing Healthcare Workforce - Healthcare Issue Briefings from Modern He...The Changing Healthcare Workforce - Healthcare Issue Briefings from Modern He...
The Changing Healthcare Workforce - Healthcare Issue Briefings from Modern He...
 
FCCC Multi-Year Study Poster Presentation
FCCC Multi-Year Study Poster PresentationFCCC Multi-Year Study Poster Presentation
FCCC Multi-Year Study Poster Presentation
 
Final Thesis_Text Apr23 2005 [Copy]
Final Thesis_Text Apr23 2005 [Copy]Final Thesis_Text Apr23 2005 [Copy]
Final Thesis_Text Apr23 2005 [Copy]
 
Social Support in the Utilization of Antenatal Care Based On Customer Driven
Social Support in the Utilization of Antenatal Care Based On Customer DrivenSocial Support in the Utilization of Antenatal Care Based On Customer Driven
Social Support in the Utilization of Antenatal Care Based On Customer Driven
 
Poster Information
Poster Information Poster Information
Poster Information
 

Viewers also liked

RESUME-AMANDA JOHNSON
RESUME-AMANDA JOHNSONRESUME-AMANDA JOHNSON
RESUME-AMANDA JOHNSON
Amanda Johnson
 
Project Manager I
Project Manager IProject Manager I
Project Manager I
Matthew Witmer
 
Woodyresume1
Woodyresume1Woodyresume1
Woodyresume1
sherwood mackall
 
Tavia N. Tate 2016
Tavia N. Tate 2016Tavia N. Tate 2016
Tavia N. Tate 2016
Tavia Tate
 
Collins Resume (PETe)
Collins Resume (PETe)Collins Resume (PETe)
Collins Resume (PETe)
Rebecca Collins
 
UFLTV’s ARGUMENTS CHALLENGING THE FACTUAL AND LEGAL ASSERTIONS OF THE COURT’S...
UFLTV’s ARGUMENTS CHALLENGING THE FACTUAL AND LEGAL ASSERTIONS OF THE COURT’S...UFLTV’s ARGUMENTS CHALLENGING THE FACTUAL AND LEGAL ASSERTIONS OF THE COURT’S...
UFLTV’s ARGUMENTS CHALLENGING THE FACTUAL AND LEGAL ASSERTIONS OF THE COURT’S...
Eric Johnson
 
Joe's Resume
Joe's ResumeJoe's Resume
Joe's Resume
Joseph LeStarge
 
All-Time MIAA champions – Maryland High School Football Foundation
All-Time MIAA champions – Maryland High School Football FoundationAll-Time MIAA champions – Maryland High School Football Foundation
All-Time MIAA champions – Maryland High School Football Foundation
Isiah Coles LAT, CEAS, CMMSS, CES
 
rachel resume
rachel resumerachel resume
rachel resume
Rachel Long
 
Resume5.13.16
Resume5.13.16Resume5.13.16
Resume5.13.16
Catherine Adams
 
gngillis_std_20160818
gngillis_std_20160818gngillis_std_20160818
gngillis_std_20160818
Greg Gillis
 
RESUME OF MR FRED
RESUME OF MR FREDRESUME OF MR FRED
RESUME OF MR FRED
Frederick inlayo
 
Flyer
FlyerFlyer
Flyer
Mark Smith
 
EJuarezResume12-01-16 - Copy
EJuarezResume12-01-16 - CopyEJuarezResume12-01-16 - Copy
EJuarezResume12-01-16 - Copy
Ervin Juarez
 
Matt Harlow Resume Government 2-2
Matt Harlow Resume Government 2-2Matt Harlow Resume Government 2-2
Matt Harlow Resume Government 2-2
Matthew Harlow
 
Shelly Bevacqua - Resume - Administrative Assistant
Shelly Bevacqua - Resume - Administrative AssistantShelly Bevacqua - Resume - Administrative Assistant
Shelly Bevacqua - Resume - Administrative Assistant
Shelly Hardwick
 
Lisa_Leverett_Bailey_Resume1[1]
Lisa_Leverett_Bailey_Resume1[1]Lisa_Leverett_Bailey_Resume1[1]
Lisa_Leverett_Bailey_Resume1[1]
Lisa Leverett
 
Alecia
AleciaAlecia
Alecia
Alecia Fotu
 
RESUME_FALL
RESUME_FALLRESUME_FALL
RESUME_FALL
Papa Fall
 

Viewers also liked (19)

RESUME-AMANDA JOHNSON
RESUME-AMANDA JOHNSONRESUME-AMANDA JOHNSON
RESUME-AMANDA JOHNSON
 
Project Manager I
Project Manager IProject Manager I
Project Manager I
 
Woodyresume1
Woodyresume1Woodyresume1
Woodyresume1
 
Tavia N. Tate 2016
Tavia N. Tate 2016Tavia N. Tate 2016
Tavia N. Tate 2016
 
Collins Resume (PETe)
Collins Resume (PETe)Collins Resume (PETe)
Collins Resume (PETe)
 
UFLTV’s ARGUMENTS CHALLENGING THE FACTUAL AND LEGAL ASSERTIONS OF THE COURT’S...
UFLTV’s ARGUMENTS CHALLENGING THE FACTUAL AND LEGAL ASSERTIONS OF THE COURT’S...UFLTV’s ARGUMENTS CHALLENGING THE FACTUAL AND LEGAL ASSERTIONS OF THE COURT’S...
UFLTV’s ARGUMENTS CHALLENGING THE FACTUAL AND LEGAL ASSERTIONS OF THE COURT’S...
 
Joe's Resume
Joe's ResumeJoe's Resume
Joe's Resume
 
All-Time MIAA champions – Maryland High School Football Foundation
All-Time MIAA champions – Maryland High School Football FoundationAll-Time MIAA champions – Maryland High School Football Foundation
All-Time MIAA champions – Maryland High School Football Foundation
 
rachel resume
rachel resumerachel resume
rachel resume
 
Resume5.13.16
Resume5.13.16Resume5.13.16
Resume5.13.16
 
gngillis_std_20160818
gngillis_std_20160818gngillis_std_20160818
gngillis_std_20160818
 
RESUME OF MR FRED
RESUME OF MR FREDRESUME OF MR FRED
RESUME OF MR FRED
 
Flyer
FlyerFlyer
Flyer
 
EJuarezResume12-01-16 - Copy
EJuarezResume12-01-16 - CopyEJuarezResume12-01-16 - Copy
EJuarezResume12-01-16 - Copy
 
Matt Harlow Resume Government 2-2
Matt Harlow Resume Government 2-2Matt Harlow Resume Government 2-2
Matt Harlow Resume Government 2-2
 
Shelly Bevacqua - Resume - Administrative Assistant
Shelly Bevacqua - Resume - Administrative AssistantShelly Bevacqua - Resume - Administrative Assistant
Shelly Bevacqua - Resume - Administrative Assistant
 
Lisa_Leverett_Bailey_Resume1[1]
Lisa_Leverett_Bailey_Resume1[1]Lisa_Leverett_Bailey_Resume1[1]
Lisa_Leverett_Bailey_Resume1[1]
 
Alecia
AleciaAlecia
Alecia
 
RESUME_FALL
RESUME_FALLRESUME_FALL
RESUME_FALL
 

Similar to yyoneoka_birthorderstudy_2008

2015EBPConferenceBrochure
2015EBPConferenceBrochure2015EBPConferenceBrochure
2015EBPConferenceBrochure
Graduate Nursing UT Tyler
 
Utah Nutrition and Physical Activity Plan 2010-2020
Utah Nutrition and Physical Activity Plan 2010-2020Utah Nutrition and Physical Activity Plan 2010-2020
Utah Nutrition and Physical Activity Plan 2010-2020
State of Utah, Salt Lake City
 
Dietary Guidelines 2010 Slideshow
Dietary Guidelines 2010 SlideshowDietary Guidelines 2010 Slideshow
Dietary Guidelines 2010 Slideshow
Corrie T
 
Dietary guidelines 2010
Dietary guidelines 2010Dietary guidelines 2010
Dietary guidelines 2010
Alberto Fatticcioni
 
HHS Priority Areas For Improvement Of Quality In Public Health 2010
HHS Priority Areas For Improvement Of Quality In Public Health 2010HHS Priority Areas For Improvement Of Quality In Public Health 2010
HHS Priority Areas For Improvement Of Quality In Public Health 2010
University of New Mexico
 
Program in Health Disparities Research 2012 Annual Report
Program in Health Disparities Research 2012 Annual ReportProgram in Health Disparities Research 2012 Annual Report
Program in Health Disparities Research 2012 Annual Report
Mitchell Davis Jr
 
Vol 6(2)
Vol 6(2)Vol 6(2)
Global Medical Cures™ | Dietary Guidelines for Americans
Global Medical Cures™ | Dietary Guidelines for AmericansGlobal Medical Cures™ | Dietary Guidelines for Americans
Global Medical Cures™ | Dietary Guidelines for Americans
Global Medical Cures™
 
Emerging Models- Reaching the Hard to Reach and Underserved
Emerging Models- Reaching the Hard to Reach and UnderservedEmerging Models- Reaching the Hard to Reach and Underserved
Emerging Models- Reaching the Hard to Reach and Underserved
LaShannon Spencer
 
Utah Health Review 2009
Utah Health Review 2009Utah Health Review 2009
Utah Health Review 2009
State of Utah, Salt Lake City
 
Dietary Guidelines for Americans U.S. Department of Agri.docx
Dietary Guidelines for Americans U.S. Department of Agri.docxDietary Guidelines for Americans U.S. Department of Agri.docx
Dietary Guidelines for Americans U.S. Department of Agri.docx
duketjoy27252
 
Free Healthy Eating Dietary Guide For Americans 2010
Free Healthy Eating Dietary Guide For Americans 2010Free Healthy Eating Dietary Guide For Americans 2010
Free Healthy Eating Dietary Guide For Americans 2010
Prabhakara T
 
The Health Effects of Cannabis and Cannabinoids_ The Current State of Evidenc...
The Health Effects of Cannabis and Cannabinoids_ The Current State of Evidenc...The Health Effects of Cannabis and Cannabinoids_ The Current State of Evidenc...
The Health Effects of Cannabis and Cannabinoids_ The Current State of Evidenc...
Vorawut Wongumpornpinit
 
SGIM February 2017.Proofs.Second Pass
SGIM February 2017.Proofs.Second PassSGIM February 2017.Proofs.Second Pass
SGIM February 2017.Proofs.Second Pass
Frank K. Darmstadt
 
Is access to healthcare a basic.pdf
Is access to healthcare a basic.pdfIs access to healthcare a basic.pdf
Is access to healthcare a basic.pdf
bkbk37
 
12-5-2016__Wright_Kathy_CV__linkedin
12-5-2016__Wright_Kathy_CV__linkedin12-5-2016__Wright_Kathy_CV__linkedin
12-5-2016__Wright_Kathy_CV__linkedin
Kathy Wright
 
Ethics and Public Health Model CurriculumEditors.docx
Ethics and Public Health Model CurriculumEditors.docxEthics and Public Health Model CurriculumEditors.docx
Ethics and Public Health Model CurriculumEditors.docx
elbanglis
 
Ethics and Public Health Model CurriculumEditors.docx
Ethics and Public Health Model CurriculumEditors.docxEthics and Public Health Model CurriculumEditors.docx
Ethics and Public Health Model CurriculumEditors.docx
humphrieskalyn
 
Cooperative Extension's National Focus on Health literacy
Cooperative Extension's National Focus on Health literacyCooperative Extension's National Focus on Health literacy
Cooperative Extension's National Focus on Health literacy
SUAREC
 
Bệnh học cơ bản của Robbins - Robbins Basic Pathology (Vinay Kumar, Abul K. A...
Bệnh học cơ bản của Robbins - Robbins Basic Pathology (Vinay Kumar, Abul K. A...Bệnh học cơ bản của Robbins - Robbins Basic Pathology (Vinay Kumar, Abul K. A...
Bệnh học cơ bản của Robbins - Robbins Basic Pathology (Vinay Kumar, Abul K. A...
doankhanhvy091
 

Similar to yyoneoka_birthorderstudy_2008 (20)

2015EBPConferenceBrochure
2015EBPConferenceBrochure2015EBPConferenceBrochure
2015EBPConferenceBrochure
 
Utah Nutrition and Physical Activity Plan 2010-2020
Utah Nutrition and Physical Activity Plan 2010-2020Utah Nutrition and Physical Activity Plan 2010-2020
Utah Nutrition and Physical Activity Plan 2010-2020
 
Dietary Guidelines 2010 Slideshow
Dietary Guidelines 2010 SlideshowDietary Guidelines 2010 Slideshow
Dietary Guidelines 2010 Slideshow
 
Dietary guidelines 2010
Dietary guidelines 2010Dietary guidelines 2010
Dietary guidelines 2010
 
HHS Priority Areas For Improvement Of Quality In Public Health 2010
HHS Priority Areas For Improvement Of Quality In Public Health 2010HHS Priority Areas For Improvement Of Quality In Public Health 2010
HHS Priority Areas For Improvement Of Quality In Public Health 2010
 
Program in Health Disparities Research 2012 Annual Report
Program in Health Disparities Research 2012 Annual ReportProgram in Health Disparities Research 2012 Annual Report
Program in Health Disparities Research 2012 Annual Report
 
Vol 6(2)
Vol 6(2)Vol 6(2)
Vol 6(2)
 
Global Medical Cures™ | Dietary Guidelines for Americans
Global Medical Cures™ | Dietary Guidelines for AmericansGlobal Medical Cures™ | Dietary Guidelines for Americans
Global Medical Cures™ | Dietary Guidelines for Americans
 
Emerging Models- Reaching the Hard to Reach and Underserved
Emerging Models- Reaching the Hard to Reach and UnderservedEmerging Models- Reaching the Hard to Reach and Underserved
Emerging Models- Reaching the Hard to Reach and Underserved
 
Utah Health Review 2009
Utah Health Review 2009Utah Health Review 2009
Utah Health Review 2009
 
Dietary Guidelines for Americans U.S. Department of Agri.docx
Dietary Guidelines for Americans U.S. Department of Agri.docxDietary Guidelines for Americans U.S. Department of Agri.docx
Dietary Guidelines for Americans U.S. Department of Agri.docx
 
Free Healthy Eating Dietary Guide For Americans 2010
Free Healthy Eating Dietary Guide For Americans 2010Free Healthy Eating Dietary Guide For Americans 2010
Free Healthy Eating Dietary Guide For Americans 2010
 
The Health Effects of Cannabis and Cannabinoids_ The Current State of Evidenc...
The Health Effects of Cannabis and Cannabinoids_ The Current State of Evidenc...The Health Effects of Cannabis and Cannabinoids_ The Current State of Evidenc...
The Health Effects of Cannabis and Cannabinoids_ The Current State of Evidenc...
 
SGIM February 2017.Proofs.Second Pass
SGIM February 2017.Proofs.Second PassSGIM February 2017.Proofs.Second Pass
SGIM February 2017.Proofs.Second Pass
 
Is access to healthcare a basic.pdf
Is access to healthcare a basic.pdfIs access to healthcare a basic.pdf
Is access to healthcare a basic.pdf
 
12-5-2016__Wright_Kathy_CV__linkedin
12-5-2016__Wright_Kathy_CV__linkedin12-5-2016__Wright_Kathy_CV__linkedin
12-5-2016__Wright_Kathy_CV__linkedin
 
Ethics and Public Health Model CurriculumEditors.docx
Ethics and Public Health Model CurriculumEditors.docxEthics and Public Health Model CurriculumEditors.docx
Ethics and Public Health Model CurriculumEditors.docx
 
Ethics and Public Health Model CurriculumEditors.docx
Ethics and Public Health Model CurriculumEditors.docxEthics and Public Health Model CurriculumEditors.docx
Ethics and Public Health Model CurriculumEditors.docx
 
Cooperative Extension's National Focus on Health literacy
Cooperative Extension's National Focus on Health literacyCooperative Extension's National Focus on Health literacy
Cooperative Extension's National Focus on Health literacy
 
Bệnh học cơ bản của Robbins - Robbins Basic Pathology (Vinay Kumar, Abul K. A...
Bệnh học cơ bản của Robbins - Robbins Basic Pathology (Vinay Kumar, Abul K. A...Bệnh học cơ bản của Robbins - Robbins Basic Pathology (Vinay Kumar, Abul K. A...
Bệnh học cơ bản của Robbins - Robbins Basic Pathology (Vinay Kumar, Abul K. A...
 

More from Yukiko Yoneoka

Trauma-prehospital data matching for nasemso project Utah's method
Trauma-prehospital data matching for nasemso project Utah's methodTrauma-prehospital data matching for nasemso project Utah's method
Trauma-prehospital data matching for nasemso project Utah's method
Yukiko Yoneoka
 
Utah geriatric hip fracture and in-hospital death
Utah geriatric hip fracture and in-hospital deathUtah geriatric hip fracture and in-hospital death
Utah geriatric hip fracture and in-hospital death
Yukiko Yoneoka
 
Utah geriatric head injury and in-hospital death
Utah geriatric head injury and in-hospital death Utah geriatric head injury and in-hospital death
Utah geriatric head injury and in-hospital death
Yukiko Yoneoka
 
Using linked trauma and prehospital data to improve data quality and analysis...
Using linked trauma and prehospital data to improve data quality and analysis...Using linked trauma and prehospital data to improve data quality and analysis...
Using linked trauma and prehospital data to improve data quality and analysis...
Yukiko Yoneoka
 
Utah trauma registrar survey 2018
Utah trauma registrar survey 2018Utah trauma registrar survey 2018
Utah trauma registrar survey 2018
Yukiko Yoneoka
 
2012-2016 Utah Pediatric emergency care status state & regional
2012-2016 Utah Pediatric emergency care status state & regional 2012-2016 Utah Pediatric emergency care status state & regional
2012-2016 Utah Pediatric emergency care status state & regional
Yukiko Yoneoka
 
yyoneoka_UtahUsesGIS_2009
yyoneoka_UtahUsesGIS_2009yyoneoka_UtahUsesGIS_2009
yyoneoka_UtahUsesGIS_2009
Yukiko Yoneoka
 
yyoneoka_missedopHPV_2016
yyoneoka_missedopHPV_2016yyoneoka_missedopHPV_2016
yyoneoka_missedopHPV_2016
Yukiko Yoneoka
 
yyoneoka_AIRA_marginaldata_2016
yyoneoka_AIRA_marginaldata_2016yyoneoka_AIRA_marginaldata_2016
yyoneoka_AIRA_marginaldata_2016
Yukiko Yoneoka
 
yyoneoka_AMIA_LinkKing_2009
yyoneoka_AMIA_LinkKing_2009yyoneoka_AMIA_LinkKing_2009
yyoneoka_AMIA_LinkKing_2009
Yukiko Yoneoka
 

More from Yukiko Yoneoka (10)

Trauma-prehospital data matching for nasemso project Utah's method
Trauma-prehospital data matching for nasemso project Utah's methodTrauma-prehospital data matching for nasemso project Utah's method
Trauma-prehospital data matching for nasemso project Utah's method
 
Utah geriatric hip fracture and in-hospital death
Utah geriatric hip fracture and in-hospital deathUtah geriatric hip fracture and in-hospital death
Utah geriatric hip fracture and in-hospital death
 
Utah geriatric head injury and in-hospital death
Utah geriatric head injury and in-hospital death Utah geriatric head injury and in-hospital death
Utah geriatric head injury and in-hospital death
 
Using linked trauma and prehospital data to improve data quality and analysis...
Using linked trauma and prehospital data to improve data quality and analysis...Using linked trauma and prehospital data to improve data quality and analysis...
Using linked trauma and prehospital data to improve data quality and analysis...
 
Utah trauma registrar survey 2018
Utah trauma registrar survey 2018Utah trauma registrar survey 2018
Utah trauma registrar survey 2018
 
2012-2016 Utah Pediatric emergency care status state & regional
2012-2016 Utah Pediatric emergency care status state & regional 2012-2016 Utah Pediatric emergency care status state & regional
2012-2016 Utah Pediatric emergency care status state & regional
 
yyoneoka_UtahUsesGIS_2009
yyoneoka_UtahUsesGIS_2009yyoneoka_UtahUsesGIS_2009
yyoneoka_UtahUsesGIS_2009
 
yyoneoka_missedopHPV_2016
yyoneoka_missedopHPV_2016yyoneoka_missedopHPV_2016
yyoneoka_missedopHPV_2016
 
yyoneoka_AIRA_marginaldata_2016
yyoneoka_AIRA_marginaldata_2016yyoneoka_AIRA_marginaldata_2016
yyoneoka_AIRA_marginaldata_2016
 
yyoneoka_AMIA_LinkKing_2009
yyoneoka_AMIA_LinkKing_2009yyoneoka_AMIA_LinkKing_2009
yyoneoka_AMIA_LinkKing_2009
 

yyoneoka_birthorderstudy_2008

  • 1. Original Research Articles Widening Racial and Ethnic Disparities in AIDS Incidence in Salt Lake City-Ogden, Utah, 1990-2000 Erika K. Barth Cottrell, MPP, Sang Lim Lee, MA, and Eric N. Reither, PhD The Effect of Palliative Care Inpatients on the Agency for Healthcare Research and Quality Inpatient Quality Indicators (AHRQ IQIs) for In-hospital Mortality Rates: A Utah Case Study Carol Masheter, PhD Cancer Incidence and Mortality Trends in Utah: 1973-2004 Antoinette M. Stroup, PhD, Rosemary Dibble, CTR, and C. Janna Harrell, MS Variations in Rates of Gestational Diabetes Between Asian American and Pacific Islander Mothers in Utah Brenda Ralls, PhD, William F. Stinner, PhD, Gulzar H. Shah, MStat, MSS, PhD, Richard Bullough, PhD, Fahina Pasi, BS, Jeffrey Duncan, MS, and Marie Aschliman, Analyst Birth Order and Other Sociodemographic Factors Influencing Immunization Status of Children in Utah: A Cohort Study Using Utah Statewide Immunization Information System and Vital Records Data Sandra K. Schulthies, MS and Yukiko Yoneoka, MS Episiotomy and Obstetric Trauma in Utah: Evidence from Linked Hospital Discharge and Birth Data Gulzar H. Shah, M. Stat, MSS, PhD; Pamela A. Clarkson Freeman, PhD, MSW; Syed Rafay Ahmed, BSc Honors; Michael Varner, MD; and Wu Xu, PhD Special Topic - Obesity Obesity in America and in Utah Rebecca L. Utz, PhD, and Norman J. Waitzman, PhD Trends and Variability in Utah’s Obesity Rates, 2006 Michael Friedrichs, MS The Distribution and Determinants of Overweight Among Adolescents in the Intermountain West Eric N. Reither, PhD, Hyojun Park, MA, Nao Xiong, MA, and Matthew McCabe Maternal Obesity in Utah Laurie Baksh, MPH Preventing Obesity and Managing Its Consequences: Wellness Programs and Primary Care Julie Day, MD; Annie Sheets Mervis, MSW; Michael Magill, MD “Eat & Live Well”: Lessons Learned from an After School Weight Management Program Rebecca Utz, PhD, Darrin Cottle, MS, Kori Fitschen, BS, Julie Metos, MPH, RD, CD, Justine Reel, PhD, Nicole L. Mihalopoulos, MD, MPH The Road To The Utah Partnership For Healthy Weight (UPHW) and Coordinated Efforts to Reduce Overweight and Obesity in Utah Richard C. Bullough, PhD Health Policy 2008 Utah Legislative Review Aaron S. Larson, MPA-HSA 2008 Utah Health Data Review 10 17 25 33 39 44 54 56 64 72 Utah’s Health: An Annual Review April 2008 | Volume 13 UH Review 2008 www.uhreview.com 78 81 88 94 111
  • 2. Executive Editors Michael L. Young, MBA, MHA Editor-in-Chief Justin Caron, Honors BS Managing Editor Daisy Krakowiak, BS Articles Editor Alison Edwards, M. Stat Data Editor Anna Reeves Production Editor Aaron Larson, MPA Legislative Correspondent Isaac Paulsen Advisory Board Liaison Safia Ahmed Associate Managing Editor Sarah Watts, BS Associate Production Editor Editorial Board Members Donya Mohebali Melody Perez-Ollerton Acknowledgement We would like to thank Dr. Richard Sperry for his continued support and guidance, the University of Utah Publications Council and the Governor Scott M. Matheson Center for Healthcare Studies for their financial support, and the ARUP Institute for Clinical and Experimental Pathology® and Intermountain Healthcare for their generous donations. Faculty Advisor Richard Sperry, MD, PhD Governor Scott M. Matheson Presidential Endowed Chair in Health Policy Management Advisory Board Members Lawrence J. Cook, M. Stat Computer Professional, Pediatric Critical Care, University of Utah School of Medicine Jean A. Dyer, PhD Dean, School of Nursing, Westminster College Marlene Egger, PhD Professor, Family & Preventive Medicine, University of Utah Gena Fletcher, MS Research Analyst, Pediatric Inpatient Medicine, University of Utah School of Medicine Leslie Francis, PhD Dean, College of Humanities, Alfred C. Emery Professor of Law Robert Paul Huefner, PhD Professor Emeritus, Political Science, University of Utah Carol Masheter, PhD Epidemiologist, Office of Health Care Statistics, Utah Department of Health Michael B. Mundorff, MBA, MHSA Data Project Manager, Primary Children’s Medical Center Maureen Murtaugh, PhD, RD Associate Professor, Division of Clinical Epidemiology, Department of Internal Medicine, University of Utah Ginette A. Pepper, PhD, RN, FAAN Professor, College of Nursing, University of Utah Pamela S. Perlich, PhD Senior Research Economist, Bureau of Economic and Business Research, University of Utah Lucy Savitz, PhD, MBA Senior Scientist, Intermountain Healthcare Debra Scammon, PhD Emma Eccles Jones Professor of Marketing, David Eccles School of Business, University of Utah Gulzar H. Shah, PhD, MStat, MSS Director of Research, National Association of Health Data Organization; Family and Preventive Medicine, University of Utah Xiaomeng Sheng, PhD Research Assistant Professor, Family and Preventive Medicine, University of Utah Julia Summerhays, MS Graduate Assistant and Doctoral Candidate, Health Promotion and Education, University of Utah J. Michele Stuart, PhD Assistant Professor, Department of Pathology, University of Utah Rebecca Utz, PhD Associate Professor, Department of Sociology, University of Utah   Norman J. Waitzman, PhD Professor, Department of Economics, University of Utah Lisa Wyman, MPH Utah Department of Health Utah’s Health: An Annual Review
  • 3. Utah’s Health: An Annual Review Volume 13 www.uhreview.com A Publication of the University of Utah
  • 4.
  • 5. 2008 Utah’s Health: An Annual Review ©2008 The University of Utah. All Rights Reserved. Introduction & Editor’s Note It is with great pleasure and excitement that I present the thirteenth volume of Utah’s Health: An Annual Review, on behalf of the 2007-08 Editorial Board. As a scientific journal, Utah’s Health is dedicated to publishing original health-related research, and reporting and analyzing health-related data. We hope that our journal will help promote health policy dialogue at both state and national levels. In addition to aiding students, researchers, legislators, and health-related professionals, Utah’s Health also serves as a health education resource to the general public, and is available online at www.uhreview.com. As in years past, Utah’s Health is comprised of three main sections: Original Research, Special Topics, and a Data Review. This year’s journal also features an expanded Legislative Review since there was ample debate and legislation relating to the health of Utahn’s during this years legislative session. The Original Research Articles submitted this year are cutting edge, peer-reviewed scientific research that relates to the health of Utahns, and I am very grateful for the many wonderful submissions that were received. This year the University of Utah was privileged to have been host to a conference on obesity that featured many excellent lecturers and speakers. As obesity is a growing health concern and important to the overall health status of Utahns in general, the editorial board decided to dedicate the entire Special Topics section of this volume to this area. There are many who deserve credit for the successful publication of this, the thirteenth volume of Utah’s Health: An Annual Review, and thus I would like to thank the dedicated group of authors, contributors, and volunteers that have offered their time and effort to make this journal possible. It is because of their commitment to research and the scholarly pursuit of health-related issues in Utah that this journal is even made possible. I am grateful for and thank the stalwart group of advisory board members that have provided expert review and assisted with the editing of our numerous articles and data pages. I would also like to thank Dr. Richard Sperry who has supported us our faculty advisor this past year. Additionally, I owe a special thanks to Professor Norman J. Waitzman, PhD, and Rebecca Utz, PhD, who graciously worked as our liaison with the authors and contributors of the special topic articles. Lastly, I would like to acknowledge the contributions of a remarkable group of fellow students who have served diligently on this volumes editorial board, and extend to them a sincere and heartfelt thank you for their enduring commitment to the success of this publication. Michael L. Young Editor-in-Chief Utah’s Health: An Annual Review – Volume XIII, 2008
  • 6. 2008 Utah’s Health: An Annual Review ©2008 The University of Utah. All Rights Reserved. Syed Rafay Ahmed, BSc (Honors), is with the Department of Sociology, Social Work and Anthropology at Utah State University. Marie Aschliman is an information analyst for The Utah Department of Health Office of Vital Records and Statistics. Laurie Baksh, MPH, is the PRAMS Data Manager at the Utah Department of Health, Reproductive Health Program. Richard Bullough, PhD, is the director of the Utah Diabetes Prevention and Control Program at the Utah Department of Health’s Bureau of Health Promotion as well as an adjunct professor in health education at the University of Utah. Darrin Cottle, MS, is a recent graduate of the Division of Nutrition at the University of Utah. Erika K. Barth Cottrell, MPP, is a PhD student in Sociology and is affiliated with the Center for Demography and Ecology at the University of Wisconsin-Madison. Julie Day, MD, is the Medical Director for Quality for the University of Utah Community Clinics, the Medical Director for Quality for the University Health Plan, and the Medical Director of the Redwood Multi-specialty clinic and practices in the Greenwood Internal Medicine Clinic. Rosemary Dibble, CTR, is the Director of Operations at the Utah Cancer Registry. Jeffrey Duncan, MS, is currently the Director of Utah’s Office of Vital Records and Statistics. Kori Fitschen, BS, is a graduate student in the Department of Exercise and Sport Science. Pamela A. Clarkson Freeman, PhD, MSW, is at the University of Utah. Michael Friedrichs, MS, is the lead epidemiologist for the Bureau of Health Promotion in the Utah Department of Health. C. Janna Harrell, MS, is the Senior Research Analyst at the Utah Cancer Registry. Sang Lim Lee, MA, is a PhD student in Sociology and is affiliated with the Population Research Laboratory at Utah State University. Carol Masheter, Ph.D., currently works as Epidemiologist II in the Office of Health Care Statistics, Utah Department of Health, Salt Lake City. Michael Magill, MD, is the chairman of the Department of Family Practice at the University of Utah and the Executive Medical Director of the University Health Care Community Clinics. Matthew McCabe is an undergraduate student emphasizing in premedical studies at Utah State University. Annie Sheets Mervis, MSW, is the Quality Manager for the 10 University of Utah Health Care Community Clinics. Julie Metos, MPH, RD, CD, is a clinical instructor and graduate student program director in the Division of Nutrition at the University of Utah. Nicole L. Mihalopoulos, MD, MPH, is an assistant professor in Adolescent Medicine in the Department of Pediatrics and an adjunct professor in the Division of Nutrition and the Department of Internal Medicine. Authors and Contributors
  • 7. 2008 Utah’s Health: An Annual Review ©2008 The University of Utah. All Rights Reserved. Hyojun Park, MA, is a PhD student in the Department of Sociology, Social Work and Anthropology at Utah State University. Fahina Pasi, BS, is the executive director of the National Tongan American Society. Brenda Ralls, PhD, is currently the epidemiologist for the Utah Diabetes Prevention and Control Program. Justine Reel, PhD, is an associate professor in the Department of Exercise and Sport Science. Eric N. Reither, PhD, is Assistant Professor of Sociology at Utah State University and is affiliated with the Population Research Laboratory in the Department of Sociology, Social Work and Anthropology. Sandra K. Schulthies, MS, is with the Utah Statewide Immunization Information System (USIIS) in the Utah Department of Health. Gulzar H. Shah has a Masters Degree in Statistics, Masters in Social Sciences, and PhD in Sociology, with Demography, Sociology of Health and Social Problems as areas of emphasis. Currently, he is the Director of Research at National Association of Health Data Organizations (NAHDO). William F. Stinner, PhD, is a professor emeritus from Utah State University. Antoinette M. Stroup, PhD, is the Co-Principal Investigator and Deputy Director of the Utah Cancer Registry (UCR). Rebecca L. Utz, PhD, is an assistant professor of Sociology and affiliate member of the Institute for Public and International Affairs and the Center on Aging at the University of Utah. Rebecca L. Utz, PhD, is an assistant professor of Sociology and affiliate member of the Institute for Public and International Affairs and the Center on Aging at the University of Utah. Michael Varner, MD, is at the Department of Obstetrics and Gynecology at the University of Utah. Norman J. Waitzman, PhD, is a professor of Economics and co-director of the Behavioral Science and Health program at the University of Utah. Nao Xiong, MA, is a PhD student in the Department of Sociology, Social Work and Anthropology at Utah State University. Wu Xu, PhD, is with the Utah Research Center for Excellence in Public Health Informatics. Yukiko Yoneoka, MS, is with the Utah Statewide Immunization Information System (USIIS) in the Utah Department of Health.
  • 8.
  • 9. 2008 Utah’s Health: An Annual Review ©2008 The University of Utah. All Rights Reserved. Table of Contents Orginal Research Articles.....................................................................................................9 Widening Racial and Ethnic Disparities in AIDS Incidence in Salt Lake City-Ogden, Utah, 1990-2000........... 10 Erika K. Barth Cottrell, MPP; Sang Lim Lee, MA; and Eric N. Reither, PhD The Effect of Palliative Care Inpatients on the Agency for Healthcare Research and Quality Inpatient Quality Indicators (AHRQ IQIs) for In-hospital Mortality Rates: A Utah Case Study........................................ 17 Carol Masheter, PhD Cancer Incidence and Mortality Trends in Utah: 1973-2004...................................................................................25 Antoinette M. Stroup, PhD; Rosemary Dibble, CTR; and C. Janna Harrell, MS Variations in Rates of Gestational Diabetes Between Asian American and Pacific Islander Mothers in Utah...33 Brenda Ralls, PhD; William F. Stinner, PhD; Gulzar H. Shah, MStat, MSS, PhD; Richard Bullough, PhD; Fahina Pasi, BS; Jeffrey Duncan, MS; and Marie Aschliman, Analyst Birth Order and Other Sociodemographic Factors Influencing Immunization Status of Children in Utah: A Cohort Study Using Utah Statewide Immunization Information System and Vital Records Data......................39 Sandra K. Schulthies, MS and Yukiko Yoneoka, MS Episiotomy and Obstetric Trauma in Utah: Evidence from Linked Hospital Discharge and Birth Data............44 Gulzar H. Shah, M. Stat, MSS, PhD; Pamela A. Clarkson Freeman, PhD, MSW; Syed Rafay Ahmed, B Sc Honors; Michael Varner, MD; and Wu Xu, PhD Special Topic: Obesity..........................................................................................................53 Obesity in America and in Utah.................................................................................................................................54 Rebecca L. Utz, PhD, and Norman J. Waitzman, PhD Trends and Variability in Utah’s Obesity Rates, 2006..............................................................................................56 Michael Friedrichs, MS The Distribution and Determinants of Overweight Among Adolescents in the Intermountain West..................64 Eric N. Reither, PhD; Hyojun Park, MA; Nao Xiong, MA; and Matthew McCabe Maternal Obesity in Utah............................................................................................................................................72 Laurie Baksh, MPH Preventing Obesity and Managing Its Consequences: Wellness Programs and Primary Care............................78 Julie Day, Annie Sheets Mervis, Michael Magill “Eat & Live Well”: Lessons Learned from an After School Weight Management Program................................81 Rebecca Utz, PhD; Darrin Cottle, MS; Kori Fitschen, BS; Julie Metos, MPH, RD, CD; Justine Reel, PhD; and Nicole L. Mihalopoulos, MD, MPH The Road To The Utah Partnership For Healthy Weight (UPHW) and Coordinated Efforts to Reduce Overweight and Obesity in Utah...............................................................................................................88 Richard C. Bullough, PhD Health Policy 2008 Utah Legislative Review.....................................................................................................................................94 Aaron S. Larson, MPA-HSA
  • 10. 2008 Utah Health Data Review......................................................................................111 Population Indicators................................................................................................................................................. 114 General Health Indicators.........................................................................................................................................122 Behavioral Influences on Health............................................................................................................................... 137 Women’s and Children’s Health............................................................................................................................... 149 Infectious Diseases and STDs....................................................................................................................................154 Chronic Diseases........................................................................................................................................................ 171 Local Health Districts................................................................................................................................................ 183 Health Services Directory................................................................................................207 Birth and Death - Utah, Regional, National Trends Chronic Homelessness Cost of Urban Living Education Population by Race and Ethnicity Unemployment Rate Air Quality All Cause Mortality Emergency Department Visits Health Insurance Coverage         Hospital Discharge by Major Disease Category Life Expectancy Poverty Self-Perceived Health Status Alcohol Use - Utah and United States Homicide Motor Vehicle Crash Deaths and Seat Belt Utilization Suicide Tobacco Use - Utah and United States Violent Crime Newborn Screening Overweight Children and Adolescents Vaginal Birth and Cesarean Section HIV/AIDS Chlamydia E.Coli Gonorrhea Hepatitis Herpes and Trichomonas Human Papillomavirus Immunizations Mumps, Polio, and Rubella Pneumonia and Influenza Syphilis Tuberculosis Breast Cancer Cerebrovascular Diseases Colon Cancer Coronary Heart Disease Diabetes Mellitus Lung Cancer Prostate Cancer Bear River Health Department Central Utah Health Department Davis County Health Department Salt Lake County Health Department Southeastern Utah Health Department Southwestern Utah Health Department Summit County Health Department Tooele County Health Department Tri-County Health Department Utah County Health Department Wasatch City/County Health Department Weber-Morgan Health Department
  • 11. 2008 Utah’s Health: An Annual Review ©2008 The University of Utah. All Rights Reserved. Utah’s Health: An Annual Review Original Research Articles
  • 12. 2008 Utah’s Health: An Annual Review 10 ©2008 The University of Utah. All Rights Reserved.Widening Racial and Ethnic Disparities in AIDS Incidence Widening Racial and Ethnic Disparities in AIDS Incidence in Salt Lake City- Ogden, Utah, 1990-2000 Authors: Erika K. Barth Cottrell, MPP Sang Lim Lee, MA Eric N. Reither, PhD Abstract Context: Public health agencies have identified the elimination of health disparities as a major policy objective. Objectives: The main goals of this study were to assess the magnitude of racial/eth- nic disparities in rates of AIDS incidence in the metropolitan statistical area of Salt Lake City-Ogden, Utah and determine how those disparities have changed over the period 1990-2000. Methods: Incidence rates were calculated using data from the AIDS Public Informa- tion Data Set (numerators) and US Census Bureau (denominators). Rates of AIDS incidence were produced for broad demographic groups (e.g., Hispanics) in Salt Lake City-Ogden. In addition, age-standardized incidence rates were produced for groups defined by age, sex and race/ethnicity, permitting careful examination of trends in racial/ethnic disparities. Results: In Salt Lake City-Ogden’s general population, AIDS incidence dropped from 11.23 per 100,000 in 1990 to 7.99 per 100,000 in 2000—a decline of about 29%. AIDS incidence rates also dropped for populations of non-Hispanic Blacks (-15.12%) and non-Hispanic Whites (-36.72%), but climbed among Hispanics (11.89%). Of all groups examined, Hispanic females experienced the largest increase in AIDS inci- dence over this period (58.27%). Rate ratios indicate that racial/ethnic disparities in AIDS incidence widened during the 1990s, both between non-Hispanic Whites and non-Hispanic Blacks (up 33.75%) and between non-Hispanic Whites and Hispanics (up 76.59%). Perhaps the most striking finding is the 113.35% increase in the disparity in AIDS incidence between non-Hispanic White and Hispanic females. Although ra- cial/ethnic disparities in AIDS incidence generally widened between 1990 and 2000, it is encouraging to note that the disparity between non-Hispanic White and non- Hispanic Black females declined by almost 6%. Conclusion: Despite progress in reducing rates of AIDS incidence in Salt Lake City- Ogden’s general population, racial/ethnic disparities widened considerably between 1990 and 2000. Brief Bios Ms. Cottrell is a Ph.D. student in Sociology and is affiliated with the Center for Demography and Ecol- ogy at the University of Wisconsin- Madison. Mr. Lee is a Ph.D. student in Sociology and is affiliated with the Population Research Laboratory at Utah State University. Dr. Reither is Assistant Professor of Sociology, Utah State University, Population Research Laboratory and Department of Sociology, So- cial Work and Anthropology, Logan UT 84322-0730, office phone (435) 797-1217, fax (435) 797-1240, e-mail eric.reither@usu.edu.
  • 13. 2008 Utah’s Health: An Annual Review ©2008 The University of Utah. All Rights Reserved. 11Widening Racial and Ethnic Disparities in AIDS Incidence Introduction In January 2000, the United States Department of Health and Human Services launched Healthy People 2010, a health promotion and disease prevention agenda with two overarching goals: to increase quality and years of healthy life and to eliminate health disparities (U.S. Department of Health, 2000). A large body of research pointing to the growing socioeconomic and racial/ethnic disparities in morbidity and premature mortality in many parts of the United States, including Utah, supports the importance of this objective (see for example Singh, 2001; Smith, 1999; Palloni, 2006). Combating the Human Immunodeficiency Virus (HIV) and Acquired Immune Deficiency Syndrome (AIDS) is one of the key priorities of Healthy People 2010. Despite Utah’s relatively low rates of HIV/AIDS, it remains an important cause of morbidity and mortality in the state (Utah Depart- ment of Health, 2000). Indeed, AIDS was one of the top 12 reported communicable diseases in Utah for 2001-2005 (Utah Department of Health, 2006). As in the rest of the United States, in Utah there was a substantial decrease in the number of newly reported HIV infections and AIDS cases in the mid to late 1990s (Ries, 1999; Utah Department of Health, 2000). However, de- spite this progress, it is important to note that HIV/AIDS incidence did not decline for all of Utah’s racial and ethnic groups. In fact, racial/ethnic disparities in incident cases of HIV/AIDS actually grew during the 1990s (Ries, 1999; University of Utah Health Sciences AIDS Center, 1999). This paper adds to existing knowledge about the HIV/AIDS epidemic in Utah by looking specifically at rates of AIDS incidence in the metropolitan statistical area (MSA) of Salt Lake City-Ogden between 1990 and 2000, with a particular focus on racial/ethnic disparities. As the largest and most diverse urban center in the state of Utah, Salt Lake City- Ogden is well suited for such an investigation. Methods Data from the AIDS Public Information Data Set (APIDS) (CDC, 2007a) and the U.S. Census Bureau (2007) were used to estimate AIDS incidence rates between 1990 and 2000 for various demographic groups in the MSA of Salt Lake City-Ogden, Utah. We utilized a weighting vari- able (adjwgt) included in APIDS that accounts for report- ing delays, thus minimizing the possibility of underestimat- ing incident AIDS diagnoses. To increase the stability of our estimates for a given year (e.g., 1990), we accumulated AIDS diagnoses over a period of five years (e.g., 1988-1992), then divided by five to produce annualized incidence rates. Weighted estimates affected only the final period of obser- vation (i.e., 1998-2002), increasing the number of AIDS di- agnoses from 505 to 533. In 1993, the CDC expanded the surveillance case definition for AIDS to include immunological criteria (e.g., less than 200 CD4+ T-lymphocytes/uL) and three new clinical con- ditions (pulmonary tuberculosis, recurrent pneumonia and invasive cervical cancer) (CDC, 1993). Although the new definition was retroactively applied, it did not result in sub- stantially more AIDS diagnoses until 1993, at which time the AIDS incidence curve in the U.S became temporarily distorted (CDC, 2007a). This distortion had essentially dis- appeared by 1996, suggesting that AIDS estimates for 1990 and 2000 are generally comparable. In correspondence to rate numerators, rate denominators were derived for demographic groups classified by age, sex and race/ethnicity. In 2000, the U.S. Census permitted mul- tiracial classifications. To produce population estimates for non-Hispanic Whites, non-Hispanic Blacks and Hispanics in 2000, we adopted the fractional approach outlined by Al- len and Turner (2001) to apportion multiracial individuals in Salt Lake City-Ogden to these racial/ethnic categories. Also, because 1990 U.S. Census data presented in Ameri- can FactFinder do not distinguish race from ethnicity in age and sex specific tables, we derived non-Hispanic White and non-Hispanic Black populations by estimating (and subse- quently subtracting) the number of Hispanic individuals in these groups. Data from APIDS and the U.S. Census Bureau were man- aged and analyzed in SPSS 15.0 and Microsoft Excel. The analyses proceeded in two stages: First, to provide an as- sessment of general progress, AIDS incidence rates were calculated for all of Salt Lake City-Ogden and broad de- mographic groups (e.g., women) in 1990 and 2000. Second, to generate a clearer picture of trends in racial/ethnic dis- parities, AIDS incidence rates for Hispanics, non-Hispanic Whites and non-Hispanic Blacks were stratified by sex and age in 1990 and 2000. Sex specific analyses were con- ducted for all age groups combined and also for adults aged 20-64 to estimate changes in AIDS incidence in this higher risk category. To minimize the influence of changing age structures on estimated trends in racial/ethnic disparities in AIDS incidence, the stratified analyses were age-standard- ized according to the 1990 non-Hispanic White population (Preston et al, 2001). Because we have access to population rather than sample data, the incidence rates generated by our study are population parameters—not sample statis- tics. Consequently, it is neither necessary nor appropriate to provide measures of uncertainty (e.g., confidence intervals)
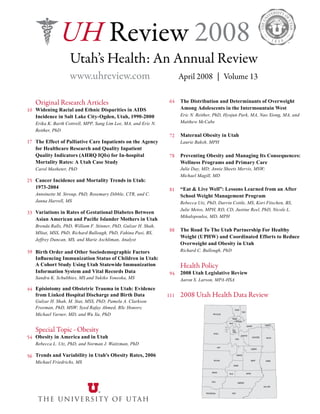
  • 14. 2008 Utah’s Health: An Annual Review 12 ©2008 The University of Utah. All Rights Reserved.Widening Racial and Ethnic Disparities in AIDS Incidence typically found in epidemiologic research, as the purpose of such measures is to make inferences about population characteristics from sample data. In our subsequent discussion of these analyses, we sought to situate Salt Lake City-Ogden in a national context. Con- sequently, selected analyses were replicated for the United States in 1990 and 2000. Rates of AIDS incidence for the United States include all 50 states and the District of Co- lumbia, but not territories (e.g., Puerto Rico). Unfortunately, APIDS does not provide AIDS data for individual states or cities with populations less than 500,000, making it impos- sible to replicate these analyses for either the state of Utah or other urban centers in the state (e.g., Logan). Results In Salt Lake City-Ogden’s general population, AIDS inci- dence dropped from 11.23 per 100,000 in 1990 to 7.99 per 100,000 in 2000 - a decline of about 29% (see Table 1). The incidence of AIDS among males fell by 32.20%, from 20.73 per 100,000 in 1990 to 14.06 per 100,000 in 2000. Incidence among females, which was already low relative to males, declined an additional 0.58%, from 1.85 to 1.84 per 100,000. With the exception of the youngest age group (ages 0-19) where AIDS incidence increased marginally from 0.24 to 0.26 per 100,000, AIDS incidence declined in all age other groups between 1990 and 2000. The decline was especially pronounced among young adults (ages 20-34) and mature adults (ages 65 and over). Whereas the 1990 AIDS incidence rate of 21.94 per 100,000 young adults was high relative to the rate of 15.44 per 100,000 midlife adults (ages 40-64), by 2000 the rates of these two groups were almost identical, at 11.68 at 11.58 per 100,000 respectively. As shown in Table 1, AIDS incidence rates also dropped in the non-Hispanic Black (-15.12%) and non-Hispanic White (-36.72%) populations, but climbed among Hispan- ics (11.89%). Among the groups we examined, the largest increase in AIDS incidence occurred among Hispanic fe- males (58.27%), which jumped from 3.82 per 100,000 in 1990 to 6.05 per 100,000 in 2000 (see Figure 2). Although AIDS incidence among Hispanic males grew only a little more than 1% over this period, it is important to note that Figure 1. Racial disparities in AIDS incidence rates among males in the MSA of Salt Lake City-Ogden, Utah, 1990-2000 20.1 18.6 120.1 37.1 35.2 216.4 12.1 18.9 82.5 22.5 35.7 155.9 0 50 100 150 200 250 Non-Hispanic White Hispanic Non-Hispanic Black Non-Hispanic White Hispanic Non-Hispanic Black All Males Young and Midlife Adult (20-64) Males Rateper100,000peryear 1990 AIDS Indicence Rates 2000 AIDS Indicence Rates Figure 1. Racial disparities in AIDS incidence rates among males in the MSA of Salt Lake City-Ogden, Utah, 1990-2000
  • 15. 2008 Utah’s Health: An Annual Review ©2008 The University of Utah. All Rights Reserved. 13Widening Racial and Ethnic Disparities in AIDS Incidence AIDS incidence rates among Hispanic males remain high relative to Hispanic females (see Figure 1 and Figure 2). The trends in AIDS incidence among Hispanics are in stark contrast to trends found in the non-Hispanic Black female and non-Hispanic Black male populations, which both de- clined by about 30% over this period of time. Although AIDS incidence rates among non-Hispanic Blacks fell considerably between 1990 and 2000, non-Hispanic Blacks remain the most affected racial/ethnic group in Salt Lake City-Ogden. In 2000, there were 82.55 incident cases of AIDS per 100,000 in the non-Hispanic Black male popu- lation, relative to 12.14 per 100,000 among non-Hispanic White males and 18.89 per 100,000 among Hispanic males (see Figure 1). Similarly, in 2000 AIDS incidence among non-Hispanic Black females was 46.70 per 100,000, versus less than one per 100,000 in the non-Hispanic White female population and 6.05 per 100,000 in the Hispanic female population (see Figure 2). Thus, although AIDS incidence is declining among non-Hispanic Blacks, this population re- mains a high priority for prevention and treatment efforts. Moreover, rate ratios indicate that racial/ethnic disparities in AIDS incidence widened over this period, both be- tween non-Hispanic Whites and non-Hispanic Blacks (up 33.75%) and between non-Hispanic Whites and Hispanics (up 76.59%) (see Table 2). Particularly striking findings are the 113.35% increase in disparity in AIDS incidence between Hispanic and non-Hispanic White females, and the 67.98% increase in the disparity between Hispanic and non-Hispanic White males. There was a more modest (albeit important) 13.91% increase in the disparity between non-Hispanic Black and non-Hispanic White males, and a 5.64% decline in the disparity between non-Hispanic Black and non-Hispanic White females. These findings highlight the general vulnerability of the non-Hispanic Black and Hispanic populations, as well as the increasing susceptibil- ity of Hispanic females to HIV infection. Table 1. AIDS incidence rates (per 100,000) among major demographic groups in Salt Lake City-Ogden, Utah, 1990-2000 1990 † 2000 † General Population 11.23 (20.73) 7.99 (13.81) Sex Male 20.73 (38.24) 14.06 (24.23) Female 1.85 (3.37) 1.84 (3.06) Age ‡ Children (0-19) 0.24 0.26 Young adult (20-34) 21.94 11.68 Midlife adult (40-64) 15.44 11.58 Mature adult (65+) 1.99 0.72 Race/ethnicity Non-Hispanic White 10.43 (19.23) 6.60 (9.60) Non-Hispanic Black 93.87 (174.03) 79.68 (114.23) Hispanic 11.62 (22.03) 13.00 (18.91) -15.12% (-34.46%) 11.89% (-14.20%) Percent Change † -36.72% (-50.07%) -28.83% (-33.36%) -32.20% (-36.64%) -0.58% (-9.20%) 6.68% -46.77% -24.99% -63.62% † Figures in parentheses include only adults aged 20-64; figures to the left of parentheses include all age groups. While percent change figures are correct, they do not perfectly correspond to incidence rates shown here due to rate rounding. ‡ The age category 35-39 is omitted because missing data are included in this group. However, given (1) the high probability that individuals in this category are between 20 and 64 years of age and (2) considerable underestimation of AIDS incidence among adults aged 20-64 when the category 35-39 is excluded, we retained this category in calculations of rates shown in parentheses.
  • 16. 2008 Utah’s Health: An Annual Review 14 ©2008 The University of Utah. All Rights Reserved.Widening Racial and Ethnic Disparities in AIDS Incidence Discussion The U.S. Department of Health and Human Services has designated the elimination of health disparities as a top public health priority (U.S. Department of Health and Hu- man Services, 2000). This call to action is timely in its im- portance, as evidenced by research showing that health dis- parities have widened in recent decades (i.e. Singh, 2002; Smith, 1999; Palloni, 2006). Our investigation adds to this body of research by demonstrating that racial/ethnic dis- parities in rates of AIDS incidence widened substantially in Salt Lake City-Ogden, Utah over the final decade of the 20th century. As noted, disparities in AIDS incidence be- tween non-Hispanic Whites and non-Hispanic Blacks in- creased by almost 34% and disparities in AIDS incidence between non-Hispanic Whites and Hispanics increased by over 76% between 1990 and 2000. Clearly, growing disparities in AIDS incidence pose a significant challenge to the achievement of the overarch- ing goals of Healthy People 2010. However, this should not obscure important progress that has been made combating the AIDS epidemic. Between 1990 and 2000, the rate of AIDS incidence declined in Salt Lake City-Ogden, both in the general population and among non-Hispanic Whites and non-Hispanic Blacks. Moreover, the disparity in AIDS incidence between males and females fell by almost 30% over this decade, and the disparity in AIDS incidence be- tween non-Hispanic White and non-Hispanic Black women fell by almost 6%. Our analysis of APIDS data for the United States revealed that Salt Lake City-Ogden is part of broader national trends (results not shown). In the United States between 1990 and 2000, rates of AIDS incidence declined in the general pop- ulation and among certain demographic groups – includ- ing males and non-Hispanic Whites – just as they did in Salt Lake City-Ogden. Part of this decline is testament to the success of HIV prevention campaigns, which promot- ed safer behaviors and reduced the number of new infec- tions from 150,000 per year in the early 1980s to 40,000 per year by the early 1990s (CDC, 2005). However, perhaps the most salient factor behind declining AIDS incidence in the 1990s in both Utah and the country as a whole was the growing availability of highly active antiretroviral therapy (HAART), which delays progression from HIV to AIDS and significantly prolongs life (Karon et al., 2001; Ries, 1999). Despite similarities between Salt Lake City-Ogden and the rest of the nation there are some notable differences to con- sider. First of all, it is important to recognize that AIDS incidence rates in Salt Lake City are well below those found nationwide. As of 2000, the overall rate of AIDS incidence in the United States (about 15 per 100,000) was almost twice that in Salt Lake City-Ogden (about 8 per 100,000). AIDS incidence in Salt Lake City-Ogden also compares favor- ably to other MSAs such as Los Angeles (17 per 100,000), Chicago (23 per 100,000), and New York (68 per 100,000) (CDC, 2000). In addition, although AIDS incidence rates among non-Hispanic Blacks increased by about 8% nation- wide between 1990 and 2000, incidence rates among non- Hispanic Blacks in Salt Lake City-Ogden actually fell by over 15% during this period. Despite these positive trends in Salt Lake City-Ogden relative to the nation as a whole, it Table 2. AIDS incidence rates ratios for all age groups, by sex and race/ethnicity, Salt Lake City-Ogden, Utah, 1990-2000 1990† 2000† Percent Change† Sex Male: Female 10.89 7.83 -28.10% Race/Ethnicity Non-Hispanic Black: Non-Hispanic White 9.03 12.08 33.75% Hispanic: Non-Hispanic White 1.12 1.97 76.59% Race/Ethnicity for Males Non-Hispanic Black: Non-Hispanic White 5.97 6.80 13.91% Hispanic: Non-Hispanic White 0.93 1.56 67.98% Race/Ethnicity for Females Non-Hispanic Black: Non-Hispanic White 52.54 49.58 -5.64% Hispanic: Non-Hispanic White 3.01 6.42 113.35% † Figures include all age groups.
  • 17. 2008 Utah’s Health: An Annual Review ©2008 The University of Utah. All Rights Reserved. 15Widening Racial and Ethnic Disparities in AIDS Incidence is notable that although there was a 34% decline in AIDS incidence in the Hispanic population nationwide, AIDS in- cidence among Hispanics in Salt Lake City-Ogden climbed by almost 12% between 1990 and 2000. This study has various limitations. First, APIDS data do not extend past 2002, making it impossible to investigate more recent trends in racial/ethnic disparities in AIDS incidence. Second, because APIDS do not include indicators of socio- economic status (SES), it was not possible to disentangle race/ethnicity from potential mediators such as education and income. Typically, research on racial/ethnic health dis- parities – including research on HIV/AIDS – has found that controlling for SES may attenuate but does not eliminate racial/ethnic disparities (Ebrahim et al, 2004; Moore et al, 1994; Robert et al, 2004). Third, there is a large and in- creasing share of missing data on mode of transmission in APIDS, making it difficult to estimate what forms of HIV transmission might account for shifting patterns of AIDS incidence in Salt Lake City-Ogden. Several mechanisms could be responsible for disparities in AIDS incidence. Race/ethnicity is associated with markers of SES such as income, which has become less equitably distributed in the United States in recent decades (Ferrie, 2005; US Census Bureau, 2005). Although race/ethnicity itself is not a risk factor for HIV infection, it may be as- sociated with social, cultural, and economic factors - such as high rates of poverty, unemployment, and lack of access to health care - that are often correlated with high risk be- havior (Blair et al, 2002). Such factors could also serve as barriers to accessing HIV prevention information and/or appropriate testing, diagnosis and treatment services, in- cluding HAART (Andersen et al, 2000; Utah Department of Health, 2007). Since the advent of HAART, if and when an HIV infection progresses to AIDS is contingent on sev- eral factors - namely whether individuals are prescribed the appropriate medications, whether they can afford the medi- cations and whether they take the medications as prescribed (CDC, 2007b). Therefore, differential access and compli- ance with HAART regimens may also be responsible for disparities in AIDS incidence. Although the elimination of racial/ethnic disparities in AIDS incidence seems unlikely without broad societal change, opportunities exist for clinicians and the public Figure 2. Racial disparities in AIDS incidence rates among females in the MSA of Salt Lake City-Ogden, Utah, 1990-2000 1.3 3.8 66.7 2.3 7.2 126.6 0.9 6.0 46.7 1.7 10.9 76.7 0 50 100 150 200 250 Non-Hispanic White Hispanic Non-Hispanic Black Non-Hispanic White Hispanic Non-Hispanic Black All Females Young and Midlife Adult (20-64) Females Rateper100,000peryear 1990 AIDS Indicence Rates 2000 AIDS Indicence Rates 17 Figure 2. Racial disparities in AIDS incidence rates among females in the MSA of Salt Lake City-Ogden, Utah, 1990-2000
  • 18. 2008 Utah’s Health: An Annual Review 16 ©2008 The University of Utah. All Rights Reserved.Widening Racial and Ethnic Disparities in AIDS Incidence health community in Utah to contribute toward their reduc- tion. The Department of Health has highlighted the neces- sity of extending the recent success in reducing HIV/AIDS incidence by developing broader public health strategies to encourage HIV/AIDS prevention and treatment among His- panics and non-Hispanic Blacks in Utah (Utah Department of Health, 2000). For example, after identifying Hispanics as one of their top three HIV prevention priorities, the Utah HIV Prevention Community Planning Committee (CPC) implemented a HIV Prevention Hispanic Needs Assessment in 2005 to help make evidence based decisions concerning the HIV prevention needs of Utah’s Hispanic population (Utah Department of Health, 2007). Physicians can also take measures to ensure that disadvantaged patients – in particular Hispanics and non-Hispanic Blacks – are aware of HIV treatment options that may delay the onset of AIDS. HIV is increasingly a chronic illness; with proper treatment and care, people living with HIV can effectively ward off illness and substantially prolong life. Ensuring that all ra- cial and ethnic groups have information about HIV preven- tion and access to treatment and care is integral to reducing overall disparities in health, both in Salt Lake City-Ogden and in the United States as a whole. References Allen J, Turner E. 2001. “Bridging 1990 and 2000 census race data: fractional assignment of multiracial populations.” Population Research Policy Review 20:513-533. Andersen R, Bozzette S, Shapiro M. 2000. “Access of vulnerable groups to antiretroviral therapy among persons in care for HIV disease in the United States.” Health Services Research 35:389-416. Blair JM, Fleming PL, Karon JM. 2002. “Trends in AIDS incidence and survival among racial/ethnic minority men who have sex with men.” Journal of Acquired Immune Deficiency Syndromes 31(3):339-347. CDC. 2007a. APIDS: AIDS Public Information Data Set. Available online at http://www.cdc.gov/hiv/topics/surveillance/resources/software/apids/index.htm. CDC. 2007b. HIV/AIDS Statistics and Surveillance. Available online at http:// www.cdc.gov/hiv/topics/surveillance/index.htm. CDC. 2005. “HIV prevention in the third decade: Activities of CDC’s Divisions of HIV/AIDS Prevention,” Available online at http://www.cdc.gov/hiv/resources/ reports/hiv3rddecade/index.htm. CDC. 2000. “U.S. HIV and AIDS cases reported through June 2005.” HIV/AIDS Surveillance Report 12(1). Available online at http://www.cdc.gov/HIV/topics/ surveillance/resources/reports/pdf/hasr1201.pdf. CDC. 1992. “1993 revised classification system for HIV infection and expanded surveillance case definition for AIDS among adolescents and adults.” MMWR 41(RR-17):1-19. Ebrahim S, Anderson J, Weidle P, Purcell D. 2004. “Race/ethnic disparities in HIV testing and knowledge about treatment for HIV/AIDS: United States, 2001.” AIDS Patient Care STDS 18(1):27-33. Ferrie JP. 2005. “The end of American exceptionalism? Mobility in the United States Since 1850.” Journal of Economic Perspectives 19:199-215. Karon, John M, Fleming, Patricia L, Steketee Richard W, and De Cock Kevin M. 2001. “HIV in the United States at the turn of the Century: An Epidemic in Transition,” American Journal of Public Health 91(7): 1060. Moore R, Stanton D, Gopalan R, Chaisson R. 1994. “Racial differences in the use of drug therapy for HIV disease in an urban community.” New England Journal of Medicine 330(11):763-768. Palloni, A. 2006. “Reproducing inequalities: Luck, wallets, and the enduring effects of childhood health,” Demography 43(4). Preston S, Heuveline P, Guillot M. 2001. Demography: Measuring and Modeling Population Processes. Malden, Mass: Blackwell Publishers. Ries K. 1999. “The HIV/AIDS Epidemic in Utah, 1998.” Utah’s Health: An Annual Review 6. Robert S, Reither E. 2004. “A multilevel analysis of race, community disadvantage, and body mass index among adults in the US.” Social Science & Medicine 59(12):2421-2434. SinghG,SiahpushM.2002.“Increasinginequalitiesinall-causeandcardiovascular mortality among US adults aged 25–64 years by area socioeconomic status, 1969–1998.” International Journal of Epidemiology 31:600-613. Smith J. 1999. “Healthy bodies and thick wallets: The dual relation between health and economic status.” Journal of Economic Perspectives 13(2):145-166. University of Utah Health Sciences AIDS Center. 1999. Sixth Annual Report, February 1999. US Census Bureau. 2007. American FactFinder. Available online at http:// factfinder.census.gov/home/saff/main.html?_lang=en. US Census Bureau, Housing and Household Economic Statistics Division. 2005. Selected measures of household income dispersion: 1967 to 2001 (Table IE-1). Available online at http://www.census.gov/hhes/www/income/histinc/iel.html. US Department of Health and Human Services. 2000. Healthy People 2010: Understanding and Improving Health. 2nd Ed. Washington DC: US Government Printing Office. Utah Department of Health. 2000. Utah Health Status Update: HIV/AIDS in Utah. Available online at http://health.utah.gov/opha/publications/hsu/0003hiv- aids.pdf. Utah Department of Health. 2006. Preliminary rankings of reportable communicable diseases, by frequency, Utah and US, 2006 (including numbers of cases and historical rankings). Available online at http://health.utah.gov/epi/ anrpt/anrpt06/Top%2025%20List_2006_031207dj.pdf. Utah Department of Health. 2007. Utah HIV Prevention Hispanic Needs Assessment Report. Available online at http://health.utah.gov/cdc/hivprevention/ resources/2005%20Hispanic%20Needs%20Assessment%20Report.pdf.
  • 19. 2008 Utah’s Health: An Annual Review ©2008 The University of Utah. All Rights Reserved. 17The Effect of Palliative Care Inpatients for In-hospital Mortality Rates The Effect of Palliative Care Inpatients on the Agency for Healthcare Research and Quality Inpatient Quality Indicators (AHRQ IQIs) for In-hospital Mortality Rates: A Utah Case Study Author: Carol Masheter, PhD Abstract This study compares the Agency for Healthcare Research and Quality Inpatient Quality Indicator (AHRQ IQI) mortality rates among Utah inpatients when patients with a palliative care code (palliative care discharges) are included and excluded. This study also reports the annual rate of palliative care discharges per 100,000 hospital inpatient hospitalizations for the U.S. and Utah in 2000 through 2005. Seven of the nine AHRQ IQIs examined included palliative care discharges for Utah in 2004 through 2006. For the Stroke IQI, when palliative care discharges are excluded, the observed mortality rate decreased from about the same as the expected mortality rate to significantly lower than the expected mortality rate for three of 39 Utah hospitals and for Utah overall. For the Congestive Heart Failure IQI, similar decreases are observed for two of these three hospitals, but not for Utah overall. All of the deceased patients that two hospitals stated received comfort care did not have a palliative care ICD-9-CM diagnosis code. Further study is needed. Introduction In 2005, Utah State Senate Bill SB 132 (Health Care Consumer Bill)1 mandated that the Utah Health Data Committee publish Utah Hospital Comparison Reports2 using nationally recognized hospital-level indicators on patient safety, quality of care and charges. For the nationally recognized indicators, the report authors have used Agency for Healthcare Research and Quality Inpatient Quality Indicators (AHRQ IQIs)3 . The AHRQ IQI software4 , run on Utah Hospital Discharge Database (Utah Database)5 , provides observed and expected rates of in-hospital mortality for specified conditions and procedures6,7 . The observed mortality rate is the number of patients who died in the hospital divided by the number of patients at risk. For example, the observed rate for stroke is the number of patients who died in the hospital out of all patients admitted for stroke as defined by the AHRQ stroke IQI. The expected mortality rate is the number of patients expected to die from a specified condition or procedure, given the patient’s age, gender and the severity of their illness, divided by the number of patients at risk. The AHRQ IQI software calculates the expected mortality rate for all included Utah hospitals (Utah overall) and for each hospital using regression weights based on each patient’s age, sex, severity of illness and/or risk of mortality6,7,8 . The Utah Hospital Comparison Reports compare observed and expected mortality rates for Utah overall and for each hospital by AHRQ IQI using the Exact 95% Confidence Key Words: Palliative care code, comfort care code, terminal care code, end of life care code, in-hospital mortality, in- hospital deaths, hospital mortality, hospital deaths, hospital quality of care, stroke hospitalization, conges- tive heart failure hospitalization, pneumonia hospitalization, Agency for Healthcare Research and Quality Inpatient Quality Indicators Brief Bio Carol Masheter, PhD, currently works as Epidemiologist II in the Office of Health Care Statistics, Utah Department of Health, Salt Lake City. She has conducted basic research as a chemist in university and medical school settings for 16 years, taught and conducted research at Rutgers University and the Univer- sity of Utah in social science for 10 years, and has worked in public health for six years. Dr. Masheter also is a high-altitude mountaineer and will attempt to climb to the summit of Mt. Everest in May, 2008 Correspondence Carol Masheter, PhD, Epidemiologist Office of Health Care Statistics Utah Department of Health 288 North 1460 West, Salt Lake City, UT 84116-4004 Phone: 801-538-6355 FAX: 801-538-9916 Email: cmasheter@ utah.gov
  • 20. 2008 Utah’s Health: An Annual Review 18 ©2008 The University of Utah. All Rights Reserved.The Effect of Palliative Care Inpatients for In-hospital Mortality Rates Interval as a test for significant difference between these two rates. In response to the mandated Utah Hospital Comparison Reports, Chief Executive Officers (CEOs) from two hospitals have posted online comments explaining that some of their patients were receiving comfort care or had do not resuscitate orders9,10 . In these comments the hospital CEOs suggested that inclusion of such patients in their hospital’s mortality rates was not appropriate, because these patients were near the end of their life and more likely to die in the hospital than patients who received other kinds of care. However, the developers of AHRQ IQIs have stated that hospitals do not indicate palliative care patients consistently, so the AHRQ IQI software does not exclude these patients from their mortality rate indicators11 . Hospital concerns about possible distortion of their mor- tality rate led to this study as a preliminary investigation based on actual hospital discharge data. Currently, the Utah Database does not include do not resuscitate data. However, the Utah Database does include up to nine diagnosis codes per hospitalization. The International Classification of Dis- eases, Ninth Revision, Clinical Modification (ICD-9-CM) includes the diagnosis code V66.7 for “encounter for pallia- tive care”, which could be used to identify inpatients who received palliative care during their hospitalization. According to the ICD-9-CM Coding Clinic, Fourth Quarter 199612 Code V66.7, Encounter for palliative care, has been cre- ated effective October 1, 1996, to classify encounters for end-of-life care, hospice care and terminal care [in conjunction with the principal diagnosis code for the un- derlying disease]. Code V66.7 may be assigned as an ad- ditional code to identify patients who receive palliative care in any health care setting, including a hospital. Palliative care is an alternative to aggressive treatment for patients who are in the terminal phase of their ill- ness. Palliative care is focused towards management of pain and symptoms and is often more appropriate than aggressive hospital treatment for patients dying of incur- able diseases….(pp. 47-48). The Coding Clinic, First Quarter 199813 , adds Code V66.7…. may be used when a patient is brought in for aggressive treatment for a terminal condition and during the encounter it is determined that further ag- Figure 1. Rate of Palliative Care Inpatients* by Year, Utah and U.S., 2000-2006 43.4 58.4 70.8 83.6 99.5 157.7 192.8 152.2 213.0 200.9 217.9 288.2 261.3 0.0 50.0 100.0 150.0 200.0 250.0 300.0 350.0 2000 2001 2002 2003 2004 2005 2006 Year Per100,000Inpatients Utah U.S. Inpatients*: Maternity, and newborn (MDC 14 and MDC 15) patients are excluded.
  • 21. 2008 Utah’s Health: An Annual Review ©2008 The University of Utah. All Rights Reserved. 19The Effect of Palliative Care Inpatients for In-hospital Mortality Rates gressive treatment is no longer appropriate and palliative care is initiated. The physician documentation in the medical record must substantiate that palliative care is being given. Terms such as comfort care, end-of-life care and hospice care are all synonymous with palliative care…. The care provided must be aimed only at relieving pain and dis- comfort for the palliative care code to be applicable (pp. 11-12). The current paper includes three sets of findings related to use of this palliative care code. First, the paper includes trend data on the use of the palliative care code in Utah and the U.S. Second, it compares mortality rates at the state level (Utah overall) and the hospital level when patients with a palliative care code (palliative care discharges) are excluded and when they are included. Third, the paper ex- amines the diagnosis codes, procedure codes and length of hospital stay for deceased patients that hospitals stated were receiving comfort care when they died in the hospital. Methods Definitions Hospitals included in this study (n=39) included all non- specialty acute care hospitals plus one federal hospital and one orthopedic specialty hospital. Other hospitals, such as children’s, psychiatric, rehabilitation and long-term care hospitals, were excluded. Utah overall includes all 39 acute care hospitals combined for a specified AHRQ IQI. Years cited in this study were calendar years, that is, from January 1 through December 31 for each year5 . “Inpatients” are patients that spent at least 24 hours in the hospital5 . “Hospital discharge” or “discharge” is a hospital stay5 , which is the unit of analysis for this study. One person may have had more than one discharge. “Palliative care discharge” was defined as an inpatient hospital stay for which the palliative care ICD-9-CM code (V66.7, “encounter for palliative care”)12 was a secondary diagnosis. Code V66.7 cannot be used as a principal diagnosis. Large hospitals have more than 300 beds. Medium hospitals have between 100 and 300 beds. Small hospitals have less than 100 beds. Data and Analyses For the trend data, the annual national rate of palliative care discharges per 100,000 discharges was obtained through the HCUPnet online query system14 for the National Inpatient Sample (NIS) for the years 2000 through 2005, the most recent years of available NIS data when this paper was written. The annual Utah rate of palliative care discharges per 100,000 discharges was obtained through the HCUPnet online query system for the State Inpatient Databases (SID) for Utah for the years 2000 through 2006, the most recent years of available SID data when this paper was written. As Utah has a high birth rate compared to the rest of the nation and maternity and newborn patients are unlikely to receive palliative care discharges, maternity (Major Diagnosis Category or MDC 14) and newborn (MDC 15) discharges were excluded from both the NIS data and the SID data for Utah. For the AHRQ IQIs, the Utah rate of palliative care dis- charges was determined using the AHRQ IQI software and SAS, Version 9.1, on data from the Utah Database. Some AHRQ IQIs are for relatively rare procedures or condi- tions and have small denominators among Utah inpatients. Hence the three most recent years of available data from the Utah Database, 2004 through 2006, were combined and used as the input data. This study reports findings on the nine AHRQ IQI mortality indicators that had at least 4,800 Utah discharges in the denominator for this three year pe- riod. These AHRQ IQIs exclude maternity, newborn and pediatric discharges. First, the AHRQ IQI software was run on the input data including palliative care discharges. Second, the software was run on the input data excluding palliative care discharges. Third, the resulting numerators, denominators, observed and expected rates for in-hospital deaths were compared by AHRQ IQI for Utah overall and for each hospital. The statistical significance test for differences between the observed and expected mortality rates was the Exact 95% confidence intervals (Exact CI)6 . The Exact CI is more appropriate for small numbers, which the AHRQ IQIs generate for some Utah hospitals for three years of data, than the more commonly used 95% Confidence Interval method. Fourth, the Utah Database data for deceased patients that two hospitals stated had received comfort care were examined for the presence or absence of the palliative care code. Findings The annual rate of palliative care discharges has increased significantly from 2000 through 2005 for the U.S. and Utah (see Figure 1). The rate of palliative care discharges is significantly lower for Utah than in the U.S. for each
  • 22. 2008 Utah’s Health: An Annual Review 20 ©2008 The University of Utah. All Rights Reserved.The Effect of Palliative Care Inpatients for In-hospital Mortality Rates Table 1. Inpatients+ by Agency for Healthcare Research and Quality Inpatient Quality Indicators for In-hospital Mortality, Utah, 2004- 2006 Stroke (IQI 17) Deaths (Num) At Risk Patients (Denom) Observed Rate (Num/Denom) Expected Rate Including Palliative Care Patients 673 6228 10.8% * 11.3% Excluding Palliative Care Patients 619 6149 10.1% * 11.3% Change in Rates 0.7% 0.0% Palliative Care Patients Only 54 79 68.4% Congestive Heart Failure (IQI 16) Including Palliative Care Patients 409 10165 4.0% 4.7% Excluding Palliative Care Patients 385 10131 3.8% 4.7% Change in Rates 0.2% 0.0% Palliative Care Patients Only 24 34 70.6% Pneumonia (IQI 20) Including Palliative Care Patients 579 16278 3.6% 5.3% Excluding Palliative Care Patients 560 16253 3.4% 5.3% Change in Rates 0.1% 0.0% Palliative Care Patients Only 19 25 76.0% Heart Attack (IQI 32) Including Palliative Care Patients 418 6582 6.4% 6.1% Excluding Palliative Care Patients 413 6573 6.3% 6.1% Change in Rates 0.1% 0.0% Palliative Care Patients Only 5 9 55.6% Balloon Angioplasty (IQI 30) Including Palliative Care Patients 250 15839 1.6% 1.6% Excluding Palliative Care Patients 250 15839 1.6% 1.6% Change in Rates 0.0% 0.0% Palliative Care Patients Only 0 0 0.0% Heart Bypass Surgery (IQI 12) Including Palliative Care Patients 181 5112 3.5% 3.7% Excluding Palliative Care Patients 180 5111 3.5% 3.7% Change in Rates 0.0% 0.0% Palliative Care Patients Only 1 1 100.0% Hip Fracture (IQI 19) Hip fracture deaths including palliative care patients Including Palliative Care Patients 149 4973 3.0% 3.0% Excluding Palliative Care Patients 146 4968 2.9% 3.0% Change in Rates 0.1% 0.0% Palliative Care Patients Only 3 5 60.0% Hip Replacement (IQI 14) Hip replacement deaths including palliative care patients Including Palliative Care Patients 10 5703 0.2% 0.2% Excluding Palliative Care Patients 10 5703 0.2% 0.2% Change in Rates 0.0% 0.0% Palliative Care Patients Only 0 0 0.0% Gastrointestinal Hemorrhage (IQI 18) Gastrointestinal hemorrhage deaths including palliative care patients Including Palliative Care Patients 139 7173 1.9% 3.0% Excluding Palliative Care Patients 136 7168 1.9% 3.0% Change in Rates 0.0% 0.0% Palliative Care Patients Only 3 5 60.0% Total 109 158 69.0%
  • 23. 2008 Utah’s Health: An Annual Review ©2008 The University of Utah. All Rights Reserved. 21The Effect of Palliative Care Inpatients for In-hospital Mortality Rates Table 2. Palliative Care Inpatients+ by Agency for Healthcare Research and Quality Inpatient Quality Indicator and Hospital, Utah, 2004-2006 Stroke (IQI 17) Hospital Palliative Care Deaths Palliative Care Discharges Actual Rate Change++ Changed Comparison of Observed Rate With Expected Rate? Stroke (IQI 17) Utah Overall 54 79 1% Yes, from same to observed is lower. Hospital 1 26 37 4% Yes, from same to observed is lower. Hospital 2 8 11 1% Yes, from same to observed is lower. Hospital 3 6 7 1% Yes, from same to observed is lower. Hospital 4 2 5 5% Hospital 5 1 4 0% Hospital 6 2 3 0% Hospital 7 2 3 1% Hospital 8 1 2 2% Hospital 9 1 2 1% Hospital 10 1 1 17% Hospital 11 1 1 1% Hospital 12 1 1 1% Hospital 13 1 1 1% Hospital 14 1 1 1% Congestive Heart Failure (IQI 16) Utah Overall 24 34 0% Hospital 1 7 12 1% Yes, from same to observed is lower. Hospital 7 5 6 1% Hospital 3 2 3 0% Hospital 14 3 3 1% Hospital 12 2 2 1% Hospital 6 1 2 0% Hospital 2 1 2 0% Yes, from same to observed is lower. Hospital 4 1 1 1% Hospital 17 1 1 4% Hospital 16 1 1 0% Hospital 18 0 1 0% Pneumonia (IQI 20) Utah Overall 19 25 0% Hospital 1 11 15 1% Hospital 7 2 3 0% Hospital 9 1 2 0% Hospital 11 1 1 0% Hospital 12 1 1 0% Hospital 15 1 1 1% Hospital 3 1 1 0% Hospital 16 1 1 0%
  • 24. 2008 Utah’s Health: An Annual Review 22 ©2008 The University of Utah. All Rights Reserved.The Effect of Palliative Care Inpatients for In-hospital Mortality Rates year, yet the rate of increase over the years is greater in Utah than in the U.S. from 2004 through 2006. In other words, although the U.S. rate of palliative care discharges is higher than Utah’s, the gap has narrowed. The Utah annual rate increased from 43.4 (CI=30.5 to 56.3) palliative care discharges per 100,000 discharges in 2000 to 192.8 (CI=165.6 to 220.0) palliative care discharges per 100,000 discharges in 2006. The U.S. annual rate increased from 152.2 (CI=152.1 to 152.3) palliative care discharges per 100,000 discharges in 2000 to 261.3 (CI=261.2 to 261.4) palliative care discharges per 100,000 discharges in 2005. For Utah overall, the number and rate of palliative care discharges varied by AHRQ IQI (see Table 1). Of the nine AHRQ IQIs examined in this study, seven indicators included at least one palliative care discharge from 2004 through 2006. The two indicators with no palliative care discharges were Balloon Angioplasty (IQI 12) and Hip Replacement (IQI 19). The majority, but not all, of, palliative care discharges for these seven indicators were deaths (109/158= 69%). discharges were deaths in the hospital. Indicators with the most palliative care discharges for Utah overall were Stroke (IQI 17), Congestive Heart Failure (IQI 16) and Pneumonia (IQI 20), 97 out of 138 (70%) of which were deaths. For Utah overall, the Stroke (IQI 17) discharges included 79 palliative care discharges of which 54 (68%) were deaths. The Congestive Heart Failure (IQI 16) discharges included 34 palliative care discharges of which 24 (71%) were deaths. The Pneumonia (IQI 20) discharges included 25 palliative care discharges of which 19 (76%) were deaths. The palliative care discharges that were not deaths were patients that were discharged to home, hospice or home health care programs or transferred to other health care facilities. Most palliative care discharges were for patients who were 65 years of age or older (546/700 =78% of all Utah palliative care discharges from 2004 through 2006). Because the other six IQIs examined in this study included fewer than 10 palliative care discharges per indicator for Utah overall from 2004 through 2006, further analyses were not reported at the hospital level in this study due to possible unreliability associated with small numbers. Among the 39 Utah hospitals included in this study, Hospital 1 had the most palliative care discharges: 64 (46%) of the 138 palliative care discharges for these three indicators with 37 (47%) of the 79 Utah overall stroke discharges (IQI 17), 12 (35%) of the 34 Utah overall congestive heart failure discharges and 15 (60%) of the 25 Utah overall pneumonia discharges (IQI 20) (see Table 2. Hospital totals for stroke, congestive heart failure and pneumonia are not in Table 2 but are derived from it). Hospital 2 had the second highest number of palliative care discharges: 13 (9%) of the palliative care discharges for Stroke, Congestive Heart Failure and Pneumonia with 11 (14%) for stroke patients and two (9%) for congestive heart failure patients. Hospital 7 had the third highest number of palliative care discharges, 12 (9%) of the palliative care patients for Stroke, Congestive Heart Failure and Pneumonia with three (9%) for stroke patients, six (18%) for congestive heart failure patients and three (12%) for pneumonia patients. All four of these hospitals are urban hospitals. However, they differ in several ways. Two of these hospitals are teaching hospitals, and the other two are not teaching hospitals. Two belong to the same hospital system, one belongs to a different hospital system and the fourth is freestanding. Two are large hospitals. The others are medium hospitals. In short, the four hospitals with the greatest number of palliative care discharges for stroke, congestive heart failure and pneumonia had little in common other than the fact that all four are urban hospitals. When palliative care discharges were excluded, the Stroke, Congestive Heart Failure and Pneumonia IQIs showed the largest decrease in the Utah overall observed mortality rate for those conditions (see Table 1).. Exclusion of palliative care discharges did not change the Utah overall expected mortality rate to seven decimal places for any of the indicators. The number and rate of palliative care discharges varied by AHRQ IQI among the 39 Utah hospitals in this study (see Table 2). Eighteen hospitals had at least one palliative care discharge from 2004 through 2006. Among these 18 hospitals, four hospitals had palliative care discharges for all three indicators: stroke (IQI 17), congestive heart failure (IQI 16) and pneumonia (IQI 20). Seven additional hospitals had palliative care discharges for two of these three indicators. The remaining seven hospitals had palliative care discharges for one of these three indicators. The eighteen hospitals that had palliative care discharges for at least one of these three indicators included urban and rural hospitals, large, medium and small hospitals, teaching and non teaching hospitals, and hospitals from most hospital systems in Utah as well as some freestanding hospitals. Oneimportantquestioniswhetherexclusionofpalliativecare discharges changes the results of the comparison between observed and expected mortality rate, using the Exact CI as the test for statistical significance. The answer is yes, in some cases. For stroke, the Utah overall observed mortality rate shifted from statistically the same as the expected mortality rate to statistically lower than the expected mortality rate, as did the observed mortality rate for Hospitals 1, 2 and 3. For congestive heart failure, the observed mortality rate
  • 25. 2008 Utah’s Health: An Annual Review ©2008 The University of Utah. All Rights Reserved. 23The Effect of Palliative Care Inpatients for In-hospital Mortality Rates shifted from statistically the same as the expected mortality rate to statistically lower than the expected mortality rate for Hospitals 1 and 2. For pneumonia, no shifts occurred when palliative care discharges were excluded. In two online Utah Hospital Comparison Reports, two hospitals posted comments stating that a portion of their in- hospital deaths were patients receiving comfort care. One hospital stated that among the 15 adult pneumonia patients that died at their hospital in 2003 through 2005, 14 were receiving “comfort care.” These patients’ discharge data were identified in the Utah Database which captures up to nine diagnoses and up to six procedures per hospital visit. None of these 15 pneumonia patients’ discharge data had a palliative care code. Fourteen of the pneumonia patients had less than nine diagnosis codes, so the Hospital Database had captured all of these patients’ reported diagnosis codes and may have captured all of the fifteenth patient’s reported codes. Twelve of these fifteen pneumonia patients had no procedure codes. Among the patients that had procedure codes, the first had an intratracheal tube inserted, the second received a transfusion of packed cells and the third received a transfusion of packed cells and a transfusion of platelets. Whether “comfort care” would include such procedures, or if palliative care was chosen after they were performed is unknown. Another hospital stated that among the 17 adult hip fracture patients that died at their hospital in 2002 through 2004, six were receiving comfort care. None of these 17 patients’ records contained a palliative care code. Twelve of these 17 hip fracture patients had less than nine diagnosis codes, so theUtahDatabasehadcapturedallofthesepatients’reported diagnosis codes and may have captured all of the remaining five patient’s reported codes. Two of the 17 patients had no procedure codes. Patients with a hip fracture and no procedure codes may have received comfort care only, or they may have died in the hospital before any procedures could be performed. The data did not permit distinction between these two kinds of patients. As with the pneumonia patients, whether these patients chose palliative care after receiving more aggressive treatment is unknown. Conclusions Hospitals’ concerns about possible distortion of their mortality rate led to this study as a preliminary investigation based on hospital discharge data. Searching for the palliative care diagnosis code (V66.7) seemed like a possible way to identify patients who received comfort care. Some of the findings were as expected. For example, no balloon angioplasty or hip replacement patients had a palliative care code for Utah overall. Only one heart bypass patient had a palliative care code for Utah overall. These findings are not surprising, because patients receiving this kind of treatment were expected to experience improvement in their condition andwerenotexpectedtodieduringorshortlyaftertreatment. In contrast, stroke, congestive heart failure and pneumonia are conditions that often are associated with the end of a person’s life, so finding palliative care discharges among patients with these conditions was not surprising. At first glance, finding that some palliative care patients did not die in the hospital seemed surprising. However some palliative care patients may have had more than one hospital stay for palliative care before they eventually died in the hospital or elsewhere. Finding no palliative care patients among the 32 patients that two hospitals claimed received palliative care was surprising. This finding supports AHRQ’s claim that hospitals do not use the palliative care code consistently. Inconsistent use of this code may be due to several reasons. As stated earlier, physician documentation in the medical record must substantiate that palliative care is being given before medical coding personnel can assign the palliative care code. Possibly the patients that the two hospitals stated had received comfort care did not have sufficient physician documentation to be assigned the palliative care code. If documentation from other health care professionals were present in the hospital’s patient record, the hospital may have considered these patients to be palliative care patients. Alternatively, these patients may have entered the hospital for aggressive treatment and perhaps later during their stay they, or their advocates, chose comfort care. Coders may have neglected to assign the palliative care code to these patients’ discharge records. Because coding is oriented toward hospital charges and reimbursement for care that the hospital provides, coding may not sufficiently describe all patient care. Or some hospitals may specialize in palliative care and attract patients who choose this kind of care. For whatever reasons, the palliative care code does appear to be used sparingly and inconsistently in Utah. This study found a maximum of 302 discharges which used the palliative care code out of approximately 150,000 non-maternity and non-newborn inpatient hospital discharges per year for Utah overall. Reasons for the absence of change in the expected mortality rate when palliative care patients are excluded are unclear. These findings warrant further investigation. These considerations withstanding, this study’s findings suggest that the hospitals’ concerns about the inclusion of patientswithapalliativecarecodeintheirmortalitynumbers andratesarewarranted.Thedegreetowhichthesedischarges affected the statistical comparison between observed and expected mortality rate was significant for Utah overall and for three hospitals for the Stroke IQI 17 and for two of the same three hospitals for the Congestive Heart Failure IQI
  • 26. 2008 Utah’s Health: An Annual Review 24 ©2008 The University of Utah. All Rights Reserved.The Effect of Palliative Care Inpatients for In-hospital Mortality Rates 18. Because the Utah Hospital Comparison Reports include hospital ratings based on this comparison of observed and expected rates of mortality, the appropriate handling of palliative care discharges needs to be addressed through future dialogue with AHRQ and the hospitals. Perhaps the findings from this study can contribute constructively to this dialogue. The goal of this study is to contribute preliminary findings on comparison of AHRQ IQI mortality rates when palliative care discharges were included and excluded. While the study achieved this goal, it raised new questions that need to be addressed. Because of the possible variation in coding among hospitals, possible differences in the portion of patients that seek palliative care by hospital and insufficient clinical detail of ICD-9-CM codes, analysts should use caution when deciding whether they will include or exclude palliative care discharges when using the AHRQ IQIs for mortality rates. Also, the Utah Department of Health may wish to consider do not resuscitate orders as a new required data element when it reviews its required data elements for hospital submission of discharge data. Availability of do not resuscitate orders, as well as consistent use of the palliative care code, would help to further improve the appropriate determination of in-hospital mortality rates. Acknowledgements The author wishes to thank the following colleagues for reviewing this article and making suggestions that improved it: Keely Cofrin Allen, PhD, Paul Hougland, MD, and Wu Xu, PhD, all with the Utah Department of Health. The author also wishes to thank Jan Orton and Cindy Hutchinson for information about the palliative care code. John Morgan explored the lack of change in the expected rates when the palliative care discharges were excluded. References 1. Utah State Senate Bill, SB 132 Health Care Consumer Bill, http://www. le.state.ut.us/~2005/bills/sbillenr/sb0132.htm 2. Utah Hospital Comparison Reports http://health.utah.gov/myhealthcare/ 3. Agency for Healthcare Research and Quality Inpatient Quality Indicators http://www.qualityindicators.ahrq.gov/iqi_overview.htm 4. Agency for Healthcare Research and Quality Inpatient Quality Indicators Download http://www.qualityindicators.ahrq.gov/iqi_download.htm 5. Utah Hospital Inpatient Discharge Data Standard Report I (ST1:06) http://health.utah.gov/hda/Reports/ST1_06.pdf 6. Agency for Healthcare Research and Quality Indicators, Guide to Inpatient Quality Indicators, Version 3.1, March 12, 2007. http://www. qualityindicators.ahrq.gov/downloads/iqi/iqi_guide_v31.pdf 7. Utah Hospital Comparison Reports Technical Document http://health. utah.gov/myhealthcare/reports/2007/heart/2007heartTechnical.pdf 8. Agency for Healthcare Research and Quality Inpatient Quality Indicators, Technical Specifications, Version 3.1 (March 12, 2007) http://www. qualityindicators.ahrq.gov/downloads/iqi/iqi_technical_specs_v31.pdf 9. Hospital comments http://health.utah.gov/myhealthcare/reports/ pneumonia2006/uintahComment.tif 10. Hospitalcommentshttp://health.utah.gov/myhealthcare/reports/hip2006/ comment/timpanogos.pdf 11. Geppert, J. (AHRQ QI Support). Personal communication. May 1, 2007. 12. Coding Clinic, Fourth Quarter 1996. 13. Coding Clinic, First Quarter 1998. 14. Healthcare Cost and Utilization Project http://hcupnet.ahrq.gov/
  • 27. 2008 Utah’s Health: An Annual Review ©2008 The University of Utah. All Rights Reserved. 25Cancer Incidence and Mortality Trends in Utah Cancer Incidence and Mortality Trends in Utah: 1973-2004 Authors: Antoinette M. Stroup, PhD Rosemary Dibble, CTR C. Janna Harrell, MS Abstract Introduction: We examined age-adjusted cancer incidence and mortality data in Utah and evaluated long-term trends from 1973-2004. Methods: This report assesses cancer incidence and mortality from 1973-2004. Long- term trends were analyzed using joinpoint analysis. Results: Prostate and female breast cancers were the leading incident cancers in Utah. The leading mortality rates were for lung cancer and prostate cancer in men, and breast cancer in women. Long-term incidence trends were driven by prostate cancer. Long-term declines in mortality were due to declines in lung, prostate, and colorectal cancers. Conclusion: Utah’s overall cancer incidence and mortality from 2000-2004 continues to be substantially lower than national averages. Unlike national trends, the age- adjusted incidence of female breast cancer in Utah has not changed significantly since 1973. Utah’s long-term cancer mortality rates have been declining at a slower rate and for a longer period of time than national trends. Introduction Utah is best known for its markedly lower cancer mortality compared to the rest of the United States (US). In 2004, the cancer mortality rate in Utah was 139.1 cancer deaths per 100,000.1 This was 25% below the national average.1 The American Cancer Society estimated that Utah will experience a 16% rise in the number of new cancer cases diagnosed from 2006 to 2007 and a 1% rise in the number of cancer deaths for same time period (American Cancer Society, 2007). This contrasts with national estimates, which are only expected to increase by about 3% for new cases and decline by 1% for cancer deaths (American Cancer Society, 2007). Long-term national surveillance data, however, shows a significant downward trend in cancer incidence, dropping at an average annual rate of 0.3% per year from 1992-2004 (Espey, et al., 2007). Cancer mortality is declining at an even faster rate, 1.1% per year from 1993-2002 and 2.1% per year from 2002-2004 (Espey, et al., 2007). If cancer incidence and mortality in Utah typically diverges from national patterns, it’s reasonable to question whether Utah is experiencing the same long-term trends as the rest of the US. In this article, we examine age-adjusted cancer incidence and mortality rates and evaluate long- term trends from 1973-2004. These trends are then compared to the national profile. Keywords Cancer incidence, cancer mortality, Utah Brief Bios Antoinette M. Stroup, PhD has an MS in Family Ecology from the University of Utah and a PhD in Epidemiology from the University of California. She is Co-Principal Investigator and Deputy Director of the Utah Cancer Registry (UCR) She has a faculty appointment in the Division of Clinical Epidemiology, Department of Internal Medicine at the University of Utah. She studies cancer epidemiology and is currently working on collaborative projects in cancer registry informatics. Rosemary Dibble, CTR, is the Director of Operations at the Utah Cancer Registry. She has served on national cancer committees for the National Cancer Institute’s Sur- veillance, Epidemiology, and End Results (SEER) Program, the North American Association of Central Cancer Registries (NAACCR), and the American College of Surgeons. During her more than 20-year tenure as Director of Operations, the Utah Cancer Registry has received 10 NAACCR awards and has consis- tently been one of the top ranked SEER registries in the nation. C. Janna Harrell, MS, is the Senior Research Analyst at the Utah Cancer Registry. She has a Master’s of Science in Family Ecology, a certificate in Demography, a certificate in Global Population and Reproductive Health, and is SAS certified. She has been with the Utah Cancer Registry since 2005.
  • 28. 2008 Utah’s Health: An Annual Review 26 ©2008 The University of Utah. All Rights Reserved.Cancer Incidence and Mortality Trends in Utah Methods This report contains incidence and mortality data for cancer cases and deaths occurring between January 1, 1973 and December 31, 2004, and reported to the Utah Cancer Registry as part of routine cancer surveillance for the Utah Department of Health and the National Cancer Institute’s Surveillance, Epidemiology and End Results (SEER) Program. Incident data are presented for all primary, invasive cancers, and grouped following the conventions of the SEER program, which uses primary site and histology codes defined in the International Classification of Diseases for Oncology (ICD-O), Third Edition (Fritz, et al., 2000). Rates and 95% confidence intervals were generated using SEER*Stat v6.3.1,2 Cancer incidence and death rates are expressed per 100,000 persons and are age-adjusted to the 2000 U.S. standard population. Long-term cancer incidence and mortality trends (1973 through 2004) were analyzed using joinpoint analysis, which is a statistical method that describes changing trends over successive segments of time by selecting the best fitting point or points where the rate of increase or decrease changes significantly. Significant trends were determined using the annual percent change (APC) statistic for each segment and set at p<0.05.3 Results Age-Adjusted Incidence 2000-2004 The age-adjusted cancer incidence from 2000-2004 was 407.0 per 100,000 (Table 1). Cancer incidence for men and women, however, were dramatically different at 487.6 and 345.2 per 100,000, respectively. The leading cancer site among men was the prostate. This was followed by colorectal, lung and bronchus, and urinary bladder cancers. Breast was the most frequent type of cancer among Utah women, followed by colorectal, corpus and uterus, and lung and bronchus cancers. Age-Adjusted Mortality 2000-2004 The age-adjusted cancer mortality rate from 2000-2004 was 144.0 per 100,000 (Table 2). Like the gender differences found in cancer incidence, cancer mortality was higher among men. The two leading causes of cancer deaths among men were cancers of the lung and bronchus and prostate. For Utah women, deaths from breast cancer outranked deaths from lung and colorectal cancers. Long-term Cancer Incidence Trends, 1973-2004 When we examined cancer incidence trends in Utah from 1973 to 2004, four distinct joinpoint segments were found (Table 3). Further analysis showed that this trend was driven by prostate cancer incidence after the widespread adoption of PSA screening in the early 1990s. Prostate cancer incidence increased rapidly, by over 21% per year, from 1989-1992 and abruptly decreased by almost 16% per year from 1992-1995. Prostate cancer incidence continued to rise from 1995-2004, although at a more modest rate. Since 1973 men in Utah have experienced a steady but significant increase in melanoma. Since the mid-1980s they have had a significant decline in colorectal and lung cancers. Female colorectal and uterine cancer incidence has decreased significantly since 1973, while cancer incidence for melanoma has been increasing for the entire time period 1973-2004. From 1973 to 1987, female lung cancer incidence significantly increased at a rate of 5.075% per year, but stabilized from 1987 through 2004. With the decreasing lung cancer incidence in men and the increasing rates among women, we see the gap closing between the men and women (Figure 1). There were no significant joinpoint trends for age-adjusted breast cancer incidence among Utah women. Long-term Cancer Mortality Trends, 1973-2004 After experiencing a significant increase from 1973-1993, Utah’s age-adjusted cancer mortality rate decreased by 1% per year through 2004 (Table 4). After stratifying the analysis by sex, cancer mortality rates remained relatively stable for both women and men until 1993 and 1998, respectively (Figure 2). By 1993, women started to show a slight, but significant decrease in cancer mortality (-0.936 APC); and, although the decline in cancer morality did not begin until 1998, declines for men were more pronounced (-2.336 APC). Long-term trends by sex and cancer site showed that much of the later decline in cancer mortality among men was attributable to declines in prostate, colorectal, and lung cancer mortality. Men, however, also experienced a significant and consistent mortality increase from non- Hodgkin’s lymphoma (+1.387 APC) for the entire period 1973-2004. Women experienced significant, steady declines in mortality due to breast and colorectal cancers. Mortality trends due to lung cancer for women are substantially different than the trends for men. From 1973-1989, lung cancer mortality rose by more than 5% per year among Utah women. Since 1989, however, the lung cancer mortality rate among women has remained stable. Discussion Utah continues to have one of the lowest cancer incidence andmortalityratesintheNation.Whencomparedtonational averages, Utah’s overall cancer incidence from 2000-2004 is approximately 14% and 16% lower for men and women,
  • 29. 2008 Utah’s Health: An Annual Review ©2008 The University of Utah. All Rights Reserved. 27Cancer Incidence and Mortality Trends in Utah Table 1. Utah Average Annual Age-Adjusted Cancer Incidence by Sex 2000-2004 Sex and Rank Site Rate per 100,000 Lower CI Upper CI Both Sexes All Sites 407.0 402.7 411.3 Male All Sites 487.6 480.6 494.7 1 Prostate 186.3 181.9 190.7 2 Colon and Rectum 47.5 45.3 49.8 3 Lung and Bronchus 40.3 38.2 42.4 4 Urinary Bladder 29.4 27.6 31.2 5 Melanoma of the Skin 27.2 25.6 28.9 6 Non-Hodgkin Lymphoma 23.2 21.7 24.7 7 Leukemia 16.2 14.9 17.5 8 Kidney and Renal Pelvis 13.2 12.1 14.4 9 Oral Cavity and Pharynx 11.6 10.6 12.7 10 Pancreas 11.3 10.3 12.5 11 Brain and Other Nervous System 8.0 7.2 8.9 12 Stomach 7.5 6.7 8.4 13 Testis 6.9 6.3 7.7 14 Myeloma 6.9 6.1 7.8 15 Esophagus 5.8 5.1 6.6 Female All Sites 345.2 339.9 350.6 1 Breast 115.7 112.6 118.9 2 Colon and Rectum 35.2 33.5 37.0 3 Corpus and Uterus, NOS 22.8 21.4 24.2 4 Lung and Bronchus 20.9 19.6 22.3 5 Melanoma of the Skin 18.5 17.3 19.7 6 Thyroid 16.1 15.0 17.2 7 Non-Hodgkin Lymphoma 15.7 14.6 16.9 8 Ovary 12.9 11.9 14.0 9 Leukemia 9.5 8.6 10.4 10 Pancreas 7.7 7.0 8.6 11 Kidney and Renal Pelvis 7.6 6.8 8.5 12 Urinary Bladder 6.5 5.8 7.3 13 Cervix Uteri 6.2 5.5 7.0 14 Brain and Other Nervous System 6.0 5.3 6.7 15 Oral Cavity and Pharynx 5.3 4.6 6.0 Source: Surveillance, Epidemiology, and End Results (SEER) Program (www.seer.cancer.gov) SEER*Stat Database: Incidence - SEER 9 Regs Limited-Use, Nov 2006 Sub (1973-2004) - Linked To County Attributes - Total U.S., 1969-2004 Counties, National Cancer Institute, DCCPS, Surveillance Research Program, Cancer Statistics Branch, released April 2007, based on the November 2006 submission. Rates are per 100,000 and age-adjusted to the US Std Population (19 age groups- Census p25-1130) standard. Confidence Intervals (Tiwari mod) are 95% for rates.
  • 30. 2008 Utah’s Health: An Annual Review 28 ©2008 The University of Utah. All Rights Reserved.Cancer Incidence and Mortality Trends in Utah Table 2. Utah Average Annual Age-Adjusted Cancer Mortality by Sex 2000-2004 Sex and Rank Site Rate per 100,000 Lower CI Upper CI Both Sexes All Sites 144.0 141.5 146.7 Male All Sites 176.5 172.1 180.9 1 Lung and Bronchus 34.9 33.0 36.9 2 Prostate 27.6 25.8 29.5 3 Colon and Rectum 17.1 15.7 18.5 4 Pancreas 11.1 10.1 12.3 5 Non-Hodgkin Lymphoma 9.8 8.8 10.9 6 Leukemia 9.3 8.4 10.4 7 Urinary Bladder 6.2 5.3 7.1 8 Brain and Other Nervous System 5.7 5.0 6.5 9 Esophagus 5.5 4.7 6.3 10 Myeloma 5.1 4.4 5.9 11 Kidney and Renal Pelvis 4.4 3.8 5.2 12 Melanoma of the Skin 4.3 3.7 5.0 13 Liver and Intraheptic Bile Duct 4.2 3.6 4.9 14 Stomach 4.0 3.4 4.8 15 Oral Cavity and Pharynx 2.7 2.2 3.2 Female All Sites 120.8 117.6 124.0 1 Breast 23.0 21.6 24.4 2 Lung and Bronchus 17.0 15.8 18.2 3 Colon and Rectum 12.7 11.7 13.7 4 Ovary 8.3 7.4 9.1 5 Pancreas 7.2 6.5 8.0 6 Non-Hodgkin Lymphoma 5.8 5.1 6.5 7 Leukemia 5.4 4.7 6.1 8 Corpus and Uterus, NOS 4.3 3.7 5.0 9 Brain and Other Nervous System 3.4 2.9 4.0 10 Myeloma 3.0 2.5 3.6 11 Stomach 2.3 1.9 2.8 12 Liver and Intraheptic Bile Duct 2.3 1.9 2.8 13 Melanoma of the Skin 2.1 1.7 2.6 14 Kidney and Renal Pelvis 2.0 1.6 2.5 15 Cervix Uteri 1.7 1.3 2.1 Source; Surveillance, Epidemiology, and End Results (SEER) Program (www.seer.cancer.gov) SEER*Stat Database: Mortality - All COD, Public-Use With State, Total U.S. (1969-2004), National Cancer Institute, DCCPS, Surveillance Research Program, Cancer Statistics Branch, released April 2007. Underlying mortality data provided by NCHS (www.cdc.gov/nchs). Rates are per 100,000 and age-adjusted to the US Std Population (19 age groups- Census p25-1130) standard. Confidence Intervals (Tiwari mod) are 95% for rates.
  • 31. 2008 Utah’s Health: An Annual Review ©2008 The University of Utah. All Rights Reserved. 29Cancer Incidence and Mortality Trends in Utah Table 3. Surveillance, Epidemiology, and End Results Cancer Incidence Rate Trends with Joinpoint Analysis° for 1973-2004 for the Top Five Cancers in Utah, by Sex Trend 1 Trend 2 Trend 3 Trend 4 Sex/Cancer Site Years APC1 Years APC1 Years APC1 Years APC1 All Sites 1973-1989 0.842* 1989-1992 4.623 1992-1995 -3.9 1995-2004 0.790* Men 1973-1989 0.974* 1989-1992 7.756* 1992-1995 -7.073* 1995-2004 0.898* Women 1973-2004 0.488* Male Prostate 1973-1989 2.327* 1989-1992 21.389* 1992-1995 -15.857* 1995-2004 1.791* Colon and Rectum 1973-1987 1.23 1987-2004 -1.184* Melanoma of the Skin 1973-2004 3.372* Urinary Bladder 1973-2004 0.368 Lung and Bronchus 1973-1984 0.45 1984-2004 -1.368* Women Breast 1973-1982 -0.105 1982-1986 5.726 1986-2004 0.225 Colon and Rectum 1973-2004 -0.503* Melanoma of the Skin 1973-2004 1.977* Lung and Bronchus 1973-1987 5.075* 1987-2004 0.811 Corpus and Uterus, NOS 1973-2004 -0.907* Source: Surveillance, Epidemiology, and End Results (SEER) Program (www.seer.cancer.gov) SEER*Stat Database: Incidence - SEER 9 Regs Limited-Use, Nov 2006 Sub (1973-2004) - Linked To County Attributes - Total U.S., 1969-2004 Counties, National Cancer Institute, DCCPS, Surveillance Research Program, Cancer Statistics Branch, released April 2007, based on the November 2006 submission. ° Joinpoint Regression Program, Version 3.1.beta. June 2006; Statistical Research and Applications Branch, National Cancer Institute. 1. APC indicates annual percent change and is based on rates that were age-adjusted to the 2000 U.S. standard population (19 age groups; Census, p25-1130). * Annual Percent Change (APC) is statistically significantly different from zero (2 sided P<.05). Figure 1. Utah Incidence Rate Trend with Joinpoint Analysis for 1973-2004 for Lung and Bronchus Cancer, by Sex 0 10 20 30 40 50 60 1973 1975 1977 1979 1981 1983 1985 1987 1989 1991 1993 1995 1997 1999 2001 2003 Year of Diagnosis Women Men Age-AdjustedRate
  • 32. 2008 Utah’s Health: An Annual Review 30 ©2008 The University of Utah. All Rights Reserved.Cancer Incidence and Mortality Trends in Utah respectively.1 This is largely due to lower rates of lung and colorectal cancers. There are a few cancer types, however, in which Utah exceeds national averages. From 2000-2004, the age-adjusted incidence for melanoma in Utah was 30% higher for men and 37% higher for women than the national averages. Prostate cancer was 16% higher in Utah. High melanoma rates are likely due to the more intense sun exposure as a result of the high elevation, and the fact that Utah has a large fair-skinned population who are known to be at greatest risk for melanoma compared to other skin types (Saladi & Persaud, 2005). The higher incidence of prostate cancer may be due to its familiality. Studies of Utah pedigrees have found a significant excess of prostate cancer cases among descendants of a single founder (Neuhausen, et al.,1999). Many of these descendants currently live in Utah. Age-adjusted cancer mortality from 2000-2004 is also substantially lower than national averages. Utah men and women die from cancer-related causes at a rate roughly 25% below the national average.1 A unique aspect of cancer mortality in Utah is that deaths from lung cancer are not the leading cause of cancer deaths among women. Utah women die more frequently from breast cancer, which ranks Table 4. Surveillance, Epidemiology, and End Results Cancer Mortality Rate Trends with Joinpoint° Analysis for 1973-2004 for the Top Five Cancers in Utah, by Sex Trend 1 Trend 2 Sex/Cancer Site Years APC1 Years APC1 All Sites 1973-1993 0.271* 1993-2004 -0.960* Men 1973-1998 0.12 1998-2004 -2.336* Women 1973-1993 0.274 1993-2004 -0.936* Male Prostate 1973-1995 1.387* 1995-2004 -5.595* Colon and Rectum 1973-1991 0.316 1991-2004 -2.828* Pancreas 1973-2004 -0.181 Non-Hodgkin's Lymphoma 1973-2004 1.387* Lung and Bronchus 1973-2004 -0.556* Women Breast 1973-2004 -0.682* Colon and Rectum 1973-2004 -1.379* Pancreas 1973-2004 -0.142 Lung and Bronchus 1973-1989 5.292* 1989-2004 0.855 Ovary 1973-2004 0.115 Source:Surveillance, Epidemiology, and End Results (SEER) Program (www.seer.cancer.gov) SEER*Stat Database: Mortality - All COD, Public-Use With State, Total U.S. (1969-2004), National Cancer Institute, DCCPS, Surveillance Research Program, Cancer Statistics Branch, released April 2007. Underlying mortality data provided by NCHS (www.cdc.gov/nchs). ° Joinpoint Regression Program, Version 3.1.beta. June 2006; Statistical Research and Applications Branch, National Cancer Institute. 1. Annual Percent Change (APC) indicates annual percent change and is based on rates that were age-adjusted to the 2000 U.S. standard population (19 age groups; Census, p25-1130). * APC is statistically significantly different from zero (2 sided P<.05).
  • 33. 2008 Utah’s Health: An Annual Review ©2008 The University of Utah. All Rights Reserved. 31Cancer Incidence and Mortality Trends in Utah Figure 2. Utah Mortality Rate Trend with Joinpoint Analysis for 1973-2004 for All Cancer Sites, by Sex 0 50 100 150 200 250 1973 1975 1977 1979 1981 1983 1985 1987 1989 1991 1993 1995 1997 1999 2001 2003 Year of Death Age-AdjustedRate Women Men second nationally (Espey, et a., 2007). The drastically lower incidence and mortality rates for lung cancer in Utah have been attributed in large part to the lifestyle of most Utahns, , who typically refrain from smoking. According to the Office of Public Health Assessment, only an average of 12% of Utahns eighteen years of age and older smoked cigarettes from 2000-2004 (Office of Public Health, Utah Department of Health). In 2004 alone, the percentage of smokers was substantially lower than the US average (10.5% in Utah, 20.9% US-wide) (Kuiper, Bombard, Maurice, & Jackson, 2007). Unfortunately, the age-adjusted incidence of female breast cancer in Utah has not changed significantly since 1973. This is in stark contrast to national trends wherein breast cancer incidence has been declining at a rate of almost 4% per year from 2001-2004. We will continue to monitor Utah breast cancer incidence trends in the coming years, as the case counts in Utah may be not be enough to show significant changes in a relatively short time period (2001-2004). With regard to long-term cancer mortality, national trends showed sharp declines in the past 12 years (1993-2004). National cancer mortality declines have accelerated from 1.1% per year from 1993-2002 to 2.1% per year from 2002-2004 (Espey, 2007). This reflects significant reductions in deaths from lung, prostate, female breast, and colorectal cancers (Espey, 2007). Utah’s long-term cancer mortality rates, on the other hand, have been declining at a slower rate and for a longer period of time. Lung cancer mortality among men, for example, has been declining at only 0.6% per year since 1973, but significant decreases nationwide did not appear until 1990 (Espey, 2007). Female breast cancer mortality also decreased by more than 2% per year since 1990 nationally (Espey, 2007), but Utah’s decline in female breast cancer mortality has been slow and steady at 0.7% per year since 1973. Additionally, the nation experienced accelerated declines in colorectal cancer mortality since 1987 in men (-1.9% per year from 1987-2002 and -4.9% per year from 2002-2004) and 1984 in women (-1.8% per year from 1984-2002 and -4.5% from 2002-2004) (Espey, 2007), but Utah’s declines have been much more modest (-2.8% for men per year from 1991-2004 and -1.4 for women per year since 1973). Taken as a whole, these findings indicate significant variations in long-term cancer incidence and mortality trends between Utah and the nation. Perhaps the nation has just recently begun the necessary decline required to match Utah’s long-standing reduction in cancer rates. Acknowledgements This research was supported by the Utah Cancer Registry, which is funded by contract N01-PC-35141 from the National Cancer Institute’s SEER program with additional support from the Utah State Department of Health and the University of Utah.