SlideShare a Scribd company logo
1 of 27
Download to read offline
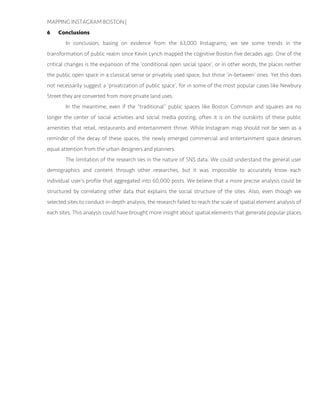
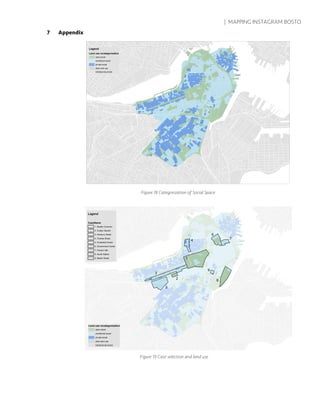
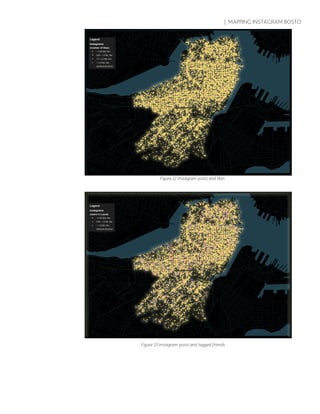
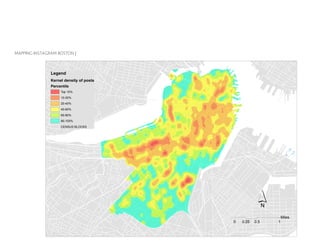
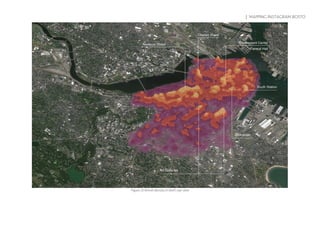
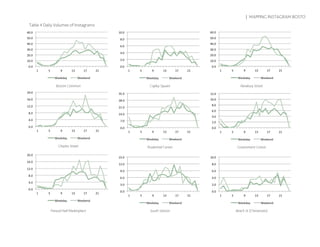
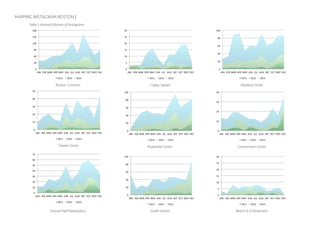
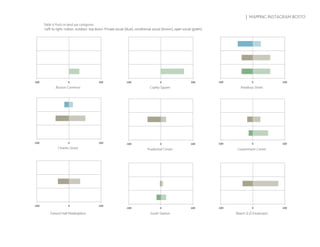
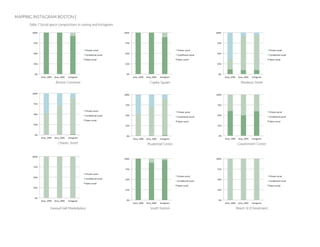
MAPPING BOSTON’S
PUBLIC REALM AS PERCEIVED
Evidence from 60,000 Instagram Posts
Prepared for Territorial Intelligence
Professor Luis Valenzuela
Harvard Graduate School of Design
Fall 2014
Contributors:
Yunjie Li
Chaewon Ahn
| MAPPING INSTAGRAM BOSTO
Abstract: This research seeks to understand public realm of the city through
the human activity captured through social network Instagram data. Owning
to the develop in smart phone and GIS technology, this new vision of the city
first, refuses to understand of the urban public space as a pure construct of a
open access squares and open spaces, but also privately owned commercial
or recreational cases. Second, it overlays the physical urban environment with
layers of social activities and human interactions.
In this research, over 63,333 Instagrams of downtown Boston are retrieved via
API service, before mapped for kernel density in ArcGIS. This was compared
to the cognitive mapping of the same area by Kevin Lynch, 1960. Further
more, 8 cases of different public spaces analyzed, including land use
composition, posting time pattern and the architectural site plan. The results
confirmed that conditional social space (e.g. commercial and recreational
land use) has become a critical ground for social activities, yet not
demonstrating decay of “public space” in a classic sense. The result informs
us that the gravity of conditional social space asks urban planners and
architects to understand and engage in public space and conditional social
space synthetically.
Key Words: public realm, city image, social media, cognitive mapping, GIS
MAPPING INSTAGRAM BOSTON |
Table of Contents
2 INTRODUCTION 4
2.1 BACKGROUND ERROR! BOOKMARK NOT DEFINED.
3 LITERATURE REVIEW 5
3.1 CHANGING CHARACTER OF PUBLIC REALM 5
3.2 NEW METHODOLOGIES TO READ THE CITY 5
3.3 OPPORTUNITIES – SOCIAL MEDIA ERROR! BOOKMARK NOT DEFINED.
4 METHODOLOGY 7
4.1 INSTAGRAM DATA 7
4.2 LAND USE CATEGORIZATION 8
4.3 SPATIAL ANALYSIS 9
5 BOSTON IN GENERAL 10
5.1 GENERAL PICTURE 10
5.2 CASE SELECTION 11
6 CASE STUDIES 13
6.1 BOSTON COMMON AND COPLEY SQUARE 13
6.2 THE THREE SHOPPING DISTRICTS 14
6.3 GOVERNMENT CENTER AND FANEUIL HALL 14
6.4 SOUTH STATION AND BEACH STREET 15
6.5 CASE SUMMARY 16
7 CONCLUSIONS 17
8 APPENDIX 18
9 BIBLIOGRAPHY 28
| MAPPING INSTAGRAM BOSTO
1 Introduction
How do we map human activities? The explosive growth of social
network services, and the open access to information of such services
provides a possibility to collect and compute the information people leave on
social network services. During the last 14 years, the number of web services
that provide open API that allows access to functionalities and information of
various websites grew from one to 2,8001
. Simultaneously, the number of
social network service users grew exponentially, that 67% of Internet users
utilize any kind of social network service2
.
We selected downtown Boston (Central, Back Bay and South End) as
the research site, and conduct the research on two scales. First, we analyze
the Social network service data in a citywide scale to understand the behavior
of the data. Next we select 9 areas to look into the posting density, changes
of user behavior in time, and the physical elements of the site.
1 “What is an API? Your guide to the Internet Business (R)evolution” 2012,
Accessed December 15 2014. http://www.3scale.net/wp-
content/uploads/2012/06/What-is-an-API-1.0.pdf
2 Duggan, Maeve, and Joanna Brenner. The demographics of social media
users, 2012. Vol. 14. Washington, DC: Pew Research Center's Internet & American Life
Project, 2013: 2.
Figure 1 Two phases of analysis
MAPPING INSTAGRAM BOSTON |
2 Literature review
2.1 Changing character of public realm
During the last 50 years, many writers recognized that the public
realm should be defined as an extended meaning including various types of
spaces essential for social actives. In this research, we rely on the
contemporary boundary public space and attempt to utilize user generated
data analysis to see to what extent these observations could be justified.
Jane Jacobs criticized in her book ‘The death and life of great
American cities (1961)’ that both modern planning and detached single-family
houses brought about the disappearances of public sphere where this civitas
happens3
. Ray Oldenburg continues criticism on the public sphere with in his
book ‘The great good place (1989)’ that the balance between the domestic,
productive and sociable realm fosters a vital neighborhood with a sense of
community.
In 2001, Tridib Banerjee published an article in the Journal of the
American planning association entitled “The Future of Public Space: Beyond
Invented Streets and Reinvented Places”. The article describes how
privatization, globalization and the communications revolution have changed
the demand and supply of the public space4
. He argues that planner’s goals
should be based on an expanded vision that includes the mediation between
public, private and non profit space, and support private ‘third spaces’ as well
that contribute to public life.5
In 2012, Kazyz Varnelis published ‘Networked publics’ that collects
writings on how the relationship to place, culture, politics and infrastructure
has changed with the pervasive spread of digital media and network
technologies. ‘Being online in the presence of others is the new place to be’,
so he quoted Brian Niemetz.6
2.2 New methodologies to read the city
3 Ibid., 40
4 Banerjee, Tridib. "The future of public space: beyond invented streets and
reinvented places." Journal of the American Planning Association 67, no. 1 (2001): 9-
24, 9
5 Ibid., 20
6 Varnelis, Kazys. Networked publics. The MIT Press, 2012: 20.
| MAPPING INSTAGRAM BOSTO
‘The image of the city’ (Kevin Lynch, 1961) analyzes the visual quality
of the city by studying the mental image of the city, which is held by its
citizens7
. In his research they interviewed thirty people in Boston and sixteen
of them went for the second session for photograph identification and map
drawing. Still, the time-consuming nature of person-to-person interviews
limits the scale of the research, while subjectivity of the researcher and
designer are likely to influence the subjects’ response.
In this research, we introduce the geo-tagged social media data for
better understanding of the public’s perception of urban spaces. Compared to
Lynch, this data driven approach tends to be more neutral, with significantly
larger the sample pool in terms of number and diversity. Turton polly
describes that data and technology has gotten highlights in areas fields such
as, crowd funding, digital place making for real time city planning, risk and
urban design, and visual analytics to inform design8
. Our research locates in
the last field, which deals with visual analytics to inform design.
There have been several precedents that aimed to analyze the city
through SNS data. In 2012, Vanessa Frias-Martinez published ‘Characterizing
Urban Landscapes using Geolocated Tweets’ on Privacy, Security, Risk and
Trust. Following, ‘Exploiting Foursquare and Cellular Data to Infer User
Activity in Urban Environments’ by Anastasios Noulas, was published in the
2013 that combined a dataset collected from a telecom provider in Spain with
geo-tagged foursquare venues.
7 Lynch, Kevin. The image of the city. Vol. 11. MIT press, 1960: 2.
8 Turton, Polly. “Data, technology and urban design”, Urban Design: Data,
technology and urban design, 132, Autumn 2014: 20–36.
MAPPING INSTAGRAM BOSTON |
3 Methodology
3.1 Instagram Data
We chose to utilize Instagram data to capture the actual social
activities happening in the city. The aggregated information will generate a
macro image of the city of ‘places’ people recognize subconsciously.
Instagram is one of the most fast growing social network services,
which allows users to edit and share photos with their ‘friends’. The user
demographic shows that women, people under 50 years, African-Americans
and Hispanics, urban residents are more likely to use it9
. And according to a
recent image analysis, the content of these Instagrams comprises 8 major
categories, with 46.6% of photos being selifies and friends, followed with 16%
of posts on activities.10
These figures show that Instagram is a fast growing
social network service where people disclose their personal and social
experiences.
This research utilizes metadata embedded in the locations and the
posts. When creating a post on Instagram, users may tag a location. Through
this action, anonymous space becomes a part of moments recorded and
shared. It becomes a place that embeds meaning. And each post contains
metadata of the time, user, tagged user, text, hash tag, likes and comments.
9 Duggan, Maeve, and Joanna Brenner. The demographics of social media
users, 2012. Vol. 14. Washington, DC: Pew Research Center's Internet & American Life
Project, 2013: 6.
10 Hu, Yuheng, Lydia Manikonda, and Subbarao Kambhampati. "What We
Instagram: A First Analysis of Instagram Photo Content and User Types.", 2014: 4.
Figure 2 Information embedded in a point
| MAPPING INSTAGRAM BOSTO
2.3 Acquisition of data
The data is acquired through API (application programming interface),
which is a platform provided by websites for software developers to build an
application that utilizes information or functionalities from the provider’s
web service. And coding in Python language in this research facilitated this
process.
After creating a grid of 1000 meters on each side, we imported the
coordinats of the grid into Python, and parsed the URL that directs the API
service to do the ‘location search’ which is getting ‘location-id’s around each
point we created in a radius of 1000 meters.11
3.2 Land use categorization
Based on the land use map of Boston, we re-categorized the 37
existing land use map of Boston newly into 4 categories according to its social
character. The four categories are Public space, Conditional public space,
Private space and Non-social space. Conditional public space includes
privately owned public space and privatized public space that mainly refers to
commercial space. While ‘Public space’ refers to the traditional public realm,
the ‘Conditional public space’ represents the ‘third space’ recognized by
Oldenburg and Banerjee.
The ratio and spatial distribution of different kinds of public space in
Boston is used as a base map on which the social network service data is
going to be overlapped on. This will allow seeing what kinds of social spaces
are more visited, housing social experiences. And a large-scale visualization
will draw a comparison between the area recognized as ‘public’ and more
‘private’. Also, in the second phase, the same comparison could be different
scale.
11 Location Endpoints. Accessed December 15.
http://instagram.com/developer/endpoints/locations/
Posts 63333
Users 27392
Locations
Ave. posts/ user 2.31
Area 15,332,591
Post per acre 179.93
Ave likes/ post 30.36
Ave comments/ post 1.76
Ave tagged uers/ post 0.29
Start date 10/13/2010
End date 11/29/2014
Figure 3 analyzing the
character through meta data
Table 1 Data Summary
MAPPING INSTAGRAM BOSTON |
3.3 Spatial Analysis
With the Instagram data retrieved through API and various GIS
information available from the city of Boston, we began by importing the
comma separated text data into GIS. For data analysis we focused on three
aspects of the data: spatial density, time pattern, and in what type of social
space the posts are posted.
First, with the help of the spatial analysis toolbox of ArcGIS, we
calculated the kernel density for the point feature the Instagram posts12
. This
allow us to read the spatial distribution of the over 60,000 posts. For
visualization, we classify the map using number of standard deviation(see
Figure 24 Kernel density map of Instagram posts in the Appendix).
Second, we took advantage of the selection by attribute and by
location command in ArcGIS to identity the spatial context of the location. In
particular, we looked at two attributes: the type of land use (as defined
above), and whether it is indoor or outdoor (according to the building foot
print map from the city of Boston). Comparing to census data sources that
focus mainly on information of the residents, these two map layers cover a
better variety of social space and thus a better fit for the research.
Third, we utilize the timestamp recorded in each Instagram post to
understand the user’s group of these locations. By converting the unix
timestamp to human date, we are able to summarize the daily, weekly or
annual pattern of people’s posting habits, and eventually who they are and
why they post.
12
Kernel density calculates a magnitude per unit area from point or polyline features using a
kernel function to fit a smoothly tapered surface to each point or polyline. See more in
http://resources.arcgis.com/en/help/main/10.2/index.html#/How_Kernel_Density_works/00
9z00000011000000/ .
Figure 4 kernel density
| MAPPING INSTAGRAM BOSTO
4 Boston in General
4.1 General Picture
As shown in Figure 24 Kernel density map of Instagram posts, the
density of posting in the three district of downtown Boston vary from place
to place. In general, the Southern half of Back Bay and the band from east of
Boston Commons to Government Center – Faneuil Hall Marketplace and
beyond, are the areas of the densest postings. As the current zoning map of
Boston indicates, these highly active areas mostly fall into the conditional
social category of our land use re-categorization. Some of the most
prominent clusters include Newbury Street, Charles Street, Emerson College
to the south of Boston Common, South Station, and the art galleries of
Another Instagram favorite is the art districts near Harrison Avenue in the
South. Also, the high-end shopping mall of Copley Place remains the one
with greatest number of comments and likes.
As for the urban context of these 63 thousand Instagrams, a break
down of the social space categories shows a mismatch of land area and
volume of posts. According to the zoning map between 1971 and 1999 saw no
significant change in the category composition. Nevertheless, the majority of
the Instagram posts falls into the category of conditional social space, almost
twice in percentage and mainly absorbed from the open social’s. In other
words, these in-between land uses of commercial, spectator sports, etc. are
far more important in a social sense than a physical or architectural sense.
Furthermore, the 48-hour chart in Figure 6 shows the peak hours of
Instagram posts in an average weekday and weekend. Among the land use
types, the trends of conditional social space rise and drop more dramatically.
Throughout the year, the posting grows in volume since spring, peaks in
November, before dropping sharply in December. While outdoor postings are
also more susceptible to this annual fluctuation, they outnumber that the
indoor number in all months and use types.
Figure 5 Land use change
and social media
MAPPING INSTAGRAM BOSTON |
Figure 6 Daily posting volume (weekday / weekend)
Figure 7 Posting in year round (Indoor/ Outdoor)
4.2 Case Selection
Based on the spatial analysis above, we chose 9 nodes of public space
as our cases for close-up analysis. We feel these nine places could best
represent the different characters of the public realm in the territory,
including both historic and classic ones since Kevin Lynch’s map as well as the
newly emerged or transformed locations. The boundaries are drawing in
accordance with census blocks.
| MAPPING INSTAGRAM BOSTO
Figure 8 Case selection and post kernel density
Among them, the Boston Common, Copley Square, Government
Center, Faneuil Hall and South Station are important city nodes back in Kevin
Lynch’s Boston map, while all the latter four went through significant
transformations after the book came out. The cases of Newbury Street,
Prudential Center and Charles Street are added as representatives of newly
emerged shopping districts, while unique in different ways. The two blocks of
Beach Street is Chinatown are selected because of its high volume of posts
during nighttime.
MAPPING INSTAGRAM BOSTON |
5 Case studies
5.1 Boston Common and Copley Square
The first two cases, the Boston Common (including the Public Garden)
and Copley Square remain two of the most important public spaces in Boston
of all times. In the Instagram, however, they are not among the most densely
posted areas.
Being the oldest park in the country, the Boston Common is the
anchor of the green space system of downtown Boston13. However the
density of posting in the 80 acre parks stays low, partly due to its immense
scale. Still, the historic park’s relative high amount of likes and comments
indicates its indisputable popularity, as is shown in Table 2. At the micro scale,
the most favorite spot is the Soldiers and Sailors Monument in the middle,
and also near the Copley station of the red line.
Surrounded by a number of significant historical cultural
architectures, the Copley Square is another classic public square of Boston.
The MBTA green line station also makes it a center of the hustle and bustle of
life in downtown. It is a place that connects different means of
transportation as well as for short visits.
As for the time pattern, postings of Boston Common began at
around sunrise and remain high in the afternoon until 11 at night, with high
volume in general during a weekend day than weekday. The afternoon peak is
not so prominent for Copley Square, in comparison to the general pattern of
Boston and other cases. For the parks, users’ favorite times of a year are
summer and fall. The public square, on the other hand, sees two peaks
between Mar and Jun as well as between September and November. The
latter apparently coincides with the two school semesters, for reasons still
unknown.
13
CityofBoston.gov, Boston Common,
http://www.cityofboston.gov/freedomtrail/bostoncommon.asp
Figure 9 Boston Common
Figure 10 Copley Square
Figure 11 Newbury Street
| MAPPING INSTAGRAM BOSTO
5.2 The Three Shopping Districts
The next three cases, Newbury Street, Charles Street in Beacon Hill
and Prudential Center, are some of the most visited shopping districts in the
downtown area. While none of them appeared in the Kevin Lynch’s Boston
map before 1960, all of them made it within the first standard deviation in
the kernel density map (Figure 8).
Converted from the late 19th
century residential area, Newbury
Street’s popularity is unparalleled among all the cases (with the most average
likes per post of 38.42 and comments of 2.18, and second highest of 0.36
users tagged). The open streets definitely share a large part of the shopping
districts’ vibrancy, as more Instagrams are posted outdoors than indoors for
open and conditional social spaces.
The case of Charles Street went through similar transformation from
residential to commercial use, while the location within the historic district of
Beacon Hill and more high-end choice of retail and restaurants distinguish it
from the other two places. And the Prudential Center completed in 1964
offers the indoor galleria experience of shopping, which houses a lower
activity of Instagram spatially.
As for the time pattern, the daily posting habit of users in these areas
are more influenced by the hours of the stores. While the weekday volume of
Newbury Street and Charles Street are not so different from downtown
Boston in general, they experience a higher peak that starts and ends
relatively earlier. Charles Street in Beacon Hill is particularly popular in lunch
and dinnertime. As for Prudential Center, there is no significant difference
between weekday and weekend. Annually the posting habits vary in the three
cases, except for a shared dormant January and February time. Even if the
total amount of Instagrams in downtown Boston drops dramatically in the
last month of the year, this is definitely not the case for the shopping districts.
5.3 Government Center and Faneuil Hall
Another two classic public spaces in Kevin Lynch’s map are the
Government Center and Faneuil Hall, on both sides of Congress Street.
Located in the more historical part of Central Boston, the two building
Figure 12 Charles Street, Beacon
Hill
Figure 13 Prudential Center
Figure 14 Government Center
(left) and Faneuil Hall (right)
MAPPING INSTAGRAM BOSTON |
complexes are more diverse in function. As they both went through intensive
redevelopment throughout the decades, the two quite vary in spatial
character and social activities.
A historical marketplace and a meeting hall since 174214
, Faneuil Hall
now houses a variety of functions including shopping and dining, exhibition,
street theater as well as government debates. The scattered footprints of
architecture also result in a roughly equal amount of posts both indoor and
outdoor. Across the street, the grand plaza is less busy with activities. Built in
the Urban Renewal era of Boston in the 1960s, the brutalist architecture is
not universally admired. Spatially, the posts are denser in the Southern part
of the plaza, where the scale of buildings and open space is smaller, with the
majority sent outdoor.
5.4 South Station and Beach Street
The last two cases are unique in their functions and characteristics.
As the most important transportation terminal, South Station is a hub of
traffic in and out of Boston, where all kinds of welcome and farewell takes
place. As a matter of fact, the platforms remain the “loneliest” case among
all the nine case studies, with one of the lowest average likes per post (22.17),
comments (1.29) and tagged users (0.15, see Table 2). Also, because trips
from South Station are in many cases short inter-city ones, they might not be
terribly impressive to their Instagram friends. The timing of the posting in
turn is relatively stable, with no significant difference between a weekday and
weekend, and the winter break the absolute annual peak.
The last case is the Instagram cluster that covers mainly two blocks
of Chinatown15
. Mainly restaurants and bars, the marked high density of
posting in this part of Boston could be explained by the unprecedented high
volume of posts between 1 and 3 a.m.. Being one of the few dining places that
stay open after midnight, the Chinatown blocks find its “Instagram niche” in
the early morning. Also, despite the strong relationship with dining and food
in these blocks, we find more posts outdoor than indoor.
14
Cityofboston.gov, Faneuil Hall, http://www.cityofboston.gov/freedomtrail/faneuilhall.asp
15
The blocks are bounded by Beach St, Kneeland St, Harrison Ave and Hudson St. It is named
“Beach Street” only for the purpose of this case study.
Figure 15 South Station
Figure 16 Beach St in Chinatown
| MAPPING INSTAGRAM BOSTO
5.5 Case Summary
In conclusion, we see some trends in the transformation of public
realm since 1960. While newly converted cases like Newbury Street remain
the most active and vibrant in social media, the classic public squares and
parks are recorded and shared their own ways. Also, rather than assumptions
like people simply post less outdoors in winter, the reason why people post in
certain physical and social settings varies.
Table 2 Summary of Instagram posts in each case
Cases
Boston
Common
Copley
Square
Newbury
Street
Charles
Street
Prudential
Center
Government
Center
Faneuil
Hall
South
Station
Beach
Street
Posts 2857 352 2976 921 2056 986 647 842 329
Users 2087 296 1997 635 1517 753 580 764 236
Posts per
user
1.37 1.19 1.49 1.45 1.36 1.31 1.12 1.10 1.39
Area (acres) 80.63 4.37 33.92 12.80 35.54 19.14 9.28 29.68 2.94
Post /acre 35.43 80.59 87.74 71.96 57.85 51.51 69.75 28.37 111.93
Ave. likes 37.25 32.71 38.42 37.41 29.50 21.77 27.37 22.17 24.58
Ave.
comments
1.95 1.44 2.18 1.72 1.68 1.43 1.66 1.29 1.48
Ave. tagged
users
0.31 0.13 0.36 0.31 0.37 0.29 0.36 0.15 0.27
Figure 17 Annual volumes of cases
MAPPING INSTAGRAM BOSTON |
6 Conclusions
In conclusion, basing on evidence from the 63,000 Instagrams, we see some trends in the
transformation of public realm since Kevin Lynch mapped the cognitive Boston five decades ago. One of the
critical changes is the expansion of the ‘conditional open social space’, or in other words, the places neither
the public open space in a classical sense or privately used space, but those ‘in-between’ ones. Yet this does
not necessarily suggest a ‘privatization of public space’, for in some of the most popular cases like Newbury
Street they are converted from more private land uses.
In the meantime, even if the “traditional” public spaces like Boston Common and squares are no
longer the center of social activities and social media posting, often it is on the outskirts of these public
amenities that retail, restaurants and entertainment thrive. While Instagram map should not be seen as a
reminder of the decay of these spaces, the newly emerged commercial and entertainment space deserves
equal attention from the urban designers and planners.
The limitation of the research lies in the nature of SNS data. We could understand the general user
demographics and content through other researches, but it was impossible to accurately know each
individual user’s profile that aggregated into 60,000 posts. We believe that a more precise analysis could be
structured by correlating other data that explains the social structure of the sites. Also, even though we
selected sites to conduct in-depth analysis, the research failed to reach the scale of spatial element analysis of
each sites. This analysis could have brought more insight about spatial elements that generate popular places.
| MAPPING INSTAGRAM BOSTO
7 Appendix
Figure 18 Categorization of Social Space
Figure 19 Case selection and land use
MAPPING INSTAGRAM BOSTON |
Figure 20 The Boston image as derived from verbal interviews (Kevin Lynch, 1960)
Figure 21 The Boston image as derived from Instagram (2014)
| MAPPING INSTAGRAM BOSTO
Figure 22 Instagram posts and likes
Figure 23 Instagram posts and tagged friends
MAPPING INSTAGRAM BOSTON |
Figure 24 Kernel density map of Instagram posts
Legend
Kernel density of posts
Percentile
Top 10%
10-20%
20-40%
40-60%
60-80%
80-100%
CENSUS BLOCKS
´
0 0.5 10.25
Miles
| MAPPING INSTAGRAM BOSTO
Figure 25 Kernel density in bird's eye view
| MAPPING INSTAGRAM BOSTO
Table 4 Daily Volumes of Instagrams
Boston Common Copley Square Newbury Street
Charles Street Prudential Center Government Center
Faneuil Hall Marketplace South Station Beach St (Chinatown)
MAPPING INSTAGRAM BOSTON |
Table 5 Annual Volumes of Instagrams
Boston Common Copley Square Newbury Street
Charles Street Prudential Center Government Center
Faneuil Hall Marketplace South Station Beach St (Chinatown)
| MAPPING INSTAGRAM BOSTO
Table 6 Posts in land use categories
-Left to right: indoor, outdoor; top down: Private social (blue), conditional social (brown), open social (green)
Boston Common Copley Square Newbury Street
Charles Street Prudential Center Government Center
Faneuil Hall Marketplace South Station Beach St (Chinatown)
MAPPING INSTAGRAM BOSTON |
Table 7 Social space compositions in zoning and Instagram
Boston Common Copley Square Newbury Street
Charles Street Prudential Center Government Center
Faneuil Hall Marketplace South Station Beach St (Chinatown)
| MAPPING INSTAGRAM BOSTO
8 Bibliography
Banerjee, Tridib. “The Future of Public Space: Beyond Invented Streets and Reinvented Places.” Journal of the American
Planning Association 67, no. 1 (March 31, 2001): 9–24.
Ben-Joseph, Eran. 2005. The code of the city: standards and the hidden language of place making. Cambridge, Mass: MIT
Press.
Carmona, Matthew, and Filipa Wunderlich. 2012. Capital spaces: the multiple complex public spaces of a global city.
Abingdon, Oxon: Routledge.
Cuthbert, Alexander R. 2011. Understanding cities: method in urban design. London: Routledge.
Dodge, Martin, Rob Kitchin, and Chris Perkins, eds. “Rethinking Maps: New Frontiers in Cartographic Theory”. 1 edition.
New York: Routledge, 2009.
Duggan, Maeve, and Joanna Brenner. The demographics of social media users, 2012. Vol. 14. Washington, DC: Pew
Research Center's Internet & American Life Project, 2013.
Hu, Yuheng, Lydia Manikonda, and Subbarao Kambhampati. "What We Instagram: A First Analysis of Instagram Photo
Content and User Types.", 2014: 4.
Jacobs, Jane. 1961. The death and life of great American cities.
Lefebvre, Henri. 1991. Critique of everyday life. London: Verso.
Liu, Liu. C-IMAGE: city cognitive mapping through geo-tagged photos. Diss. Massachusetts Institute of Technology, 2014.
Loukaitou-Sideris, Anastasia, and Renia Ehrenfeucht. 2009. Sidewalks: conflict and negotiation over public space.
Cambridge, Mass: MIT Press.
Lynch, Kevin. The Image of the City. MIT Press, 1960.
Oldenburg, Ray. The great good place: Cafés, coffee shops, community centers, beauty parlors, general stores, bars,
hangouts, and how they get you through the day. New York: Paragon House, 1989.
Salesses, Philip, Katja Schechtner, and César A. Hidalgo. "The collaborative image of the city: mapping the inequality of
urban perception." PloS one 8.7 (2013): e68400.
Soja, Edward W. 1996. Thirdspace: journeys to Los Angeles and other real-and-imagined places. Cambridge, Mass:
Blackwell.
Turton, Polly. “Data, technology and urban design”, Urban Design: Data, technology and urban design, 132, Autumn 2014:
20–36.
Varnelis, Kazys. Networked publics. The MIT Press, 2012
Whyte, William Hollingsworth. 1980. The social life of small urban spaces. Washington, D.C.: Conservation Foundation.

More Related Content

Similar to Mapping Boston's Public Realm Through Instagram

Using Social Networking Data to Understand Urban Human Mobility
Using Social Networking Data to Understand Urban Human Mobility Using Social Networking Data to Understand Urban Human Mobility
Using Social Networking Data to Understand Urban Human Mobility Yuyun Wabula
 
Maps of the living neighborhoods - a study of Genoa through social media
Maps of the living neighborhoods - a study of Genoa through social mediaMaps of the living neighborhoods - a study of Genoa through social media
Maps of the living neighborhoods - a study of Genoa through social mediaMarna Parodi
 
Dawn of Smart City_web
Dawn of Smart City_webDawn of Smart City_web
Dawn of Smart City_webSchuyler Null
 
Planning Liveable Cities With Big Social Data
Planning Liveable Cities With Big Social DataPlanning Liveable Cities With Big Social Data
Planning Liveable Cities With Big Social DataMatt Low
 
Studying perceptions of urban space and neighbourhood with moblogging
Studying perceptions of urban space and neighbourhood with mobloggingStudying perceptions of urban space and neighbourhood with moblogging
Studying perceptions of urban space and neighbourhood with mobloggingDania Abdel-aziz
 
1st Workshop '(Un)Plugging Data in Smart City-Regions' from the Series 'Bridg...
1st Workshop '(Un)Plugging Data in Smart City-Regions' from the Series 'Bridg...1st Workshop '(Un)Plugging Data in Smart City-Regions' from the Series 'Bridg...
1st Workshop '(Un)Plugging Data in Smart City-Regions' from the Series 'Bridg...Dr Igor Calzada, MBA, FeRSA
 
Communication in the City: Planning and Social Media, May 2015
Communication in the City: Planning and Social Media, May 2015Communication in the City: Planning and Social Media, May 2015
Communication in the City: Planning and Social Media, May 2015Andrew J. Crisp
 
Citilabs paper-jci final
Citilabs paper-jci finalCitilabs paper-jci final
Citilabs paper-jci finalArtur Serra
 
Citilabs paper-jci final
Citilabs paper-jci finalCitilabs paper-jci final
Citilabs paper-jci finalArtur Serra
 
Van Roessel et al. 2018: Extending the Methods of Media and Communication Stu...
Van Roessel et al. 2018: Extending the Methods of Media and Communication Stu...Van Roessel et al. 2018: Extending the Methods of Media and Communication Stu...
Van Roessel et al. 2018: Extending the Methods of Media and Communication Stu...Julius Reimer
 
Let's Chalk Supplementary
Let's Chalk SupplementaryLet's Chalk Supplementary
Let's Chalk Supplementaryslouraine
 
Geodesign: Past, Present, and Future
Geodesign: Past, Present, and FutureGeodesign: Past, Present, and Future
Geodesign: Past, Present, and FutureEsri
 
Dynamic Land-Use Map Based on Twitter Data
Dynamic Land-Use Map Based on Twitter DataDynamic Land-Use Map Based on Twitter Data
Dynamic Land-Use Map Based on Twitter DataYuyun Wabula
 
Participatory GIS, Volunteered Geographic Information and Citizen Science - G...
Participatory GIS, Volunteered Geographic Information and Citizen Science - G...Participatory GIS, Volunteered Geographic Information and Citizen Science - G...
Participatory GIS, Volunteered Geographic Information and Citizen Science - G...Muki Haklay
 
Tsinghua city care
Tsinghua city careTsinghua city care
Tsinghua city careDESIS_milano
 

Similar to Mapping Boston's Public Realm Through Instagram (20)

Using Social Networking Data to Understand Urban Human Mobility
Using Social Networking Data to Understand Urban Human Mobility Using Social Networking Data to Understand Urban Human Mobility
Using Social Networking Data to Understand Urban Human Mobility
 
Urban algorithms
Urban algorithmsUrban algorithms
Urban algorithms
 
Citymatter: UX / UI Design
Citymatter: UX / UI DesignCitymatter: UX / UI Design
Citymatter: UX / UI Design
 
Maps of the living neighborhoods - a study of Genoa through social media
Maps of the living neighborhoods - a study of Genoa through social mediaMaps of the living neighborhoods - a study of Genoa through social media
Maps of the living neighborhoods - a study of Genoa through social media
 
Dawn of Smart City_web
Dawn of Smart City_webDawn of Smart City_web
Dawn of Smart City_web
 
Planning Liveable Cities With Big Social Data
Planning Liveable Cities With Big Social DataPlanning Liveable Cities With Big Social Data
Planning Liveable Cities With Big Social Data
 
Studying perceptions of urban space and neighbourhood with moblogging
Studying perceptions of urban space and neighbourhood with mobloggingStudying perceptions of urban space and neighbourhood with moblogging
Studying perceptions of urban space and neighbourhood with moblogging
 
1st Workshop '(Un)Plugging Data in Smart City-Regions' from the Series 'Bridg...
1st Workshop '(Un)Plugging Data in Smart City-Regions' from the Series 'Bridg...1st Workshop '(Un)Plugging Data in Smart City-Regions' from the Series 'Bridg...
1st Workshop '(Un)Plugging Data in Smart City-Regions' from the Series 'Bridg...
 
Communication in the City: Planning and Social Media, May 2015
Communication in the City: Planning and Social Media, May 2015Communication in the City: Planning and Social Media, May 2015
Communication in the City: Planning and Social Media, May 2015
 
Citilabs paper-jci final
Citilabs paper-jci finalCitilabs paper-jci final
Citilabs paper-jci final
 
Citilabs paper-jci final
Citilabs paper-jci finalCitilabs paper-jci final
Citilabs paper-jci final
 
Van Roessel et al. 2018: Extending the Methods of Media and Communication Stu...
Van Roessel et al. 2018: Extending the Methods of Media and Communication Stu...Van Roessel et al. 2018: Extending the Methods of Media and Communication Stu...
Van Roessel et al. 2018: Extending the Methods of Media and Communication Stu...
 
Let's Chalk Supplementary
Let's Chalk SupplementaryLet's Chalk Supplementary
Let's Chalk Supplementary
 
Lets chalk-supplementary-chi
Lets chalk-supplementary-chiLets chalk-supplementary-chi
Lets chalk-supplementary-chi
 
Geodesign: Past, Present, and Future
Geodesign: Past, Present, and FutureGeodesign: Past, Present, and Future
Geodesign: Past, Present, and Future
 
Adopting a User Modeling Approach to Quantify the City
Adopting a User Modeling Approach to Quantify the CityAdopting a User Modeling Approach to Quantify the City
Adopting a User Modeling Approach to Quantify the City
 
Dynamic Land-Use Map Based on Twitter Data
Dynamic Land-Use Map Based on Twitter DataDynamic Land-Use Map Based on Twitter Data
Dynamic Land-Use Map Based on Twitter Data
 
The Map
The MapThe Map
The Map
 
Participatory GIS, Volunteered Geographic Information and Citizen Science - G...
Participatory GIS, Volunteered Geographic Information and Citizen Science - G...Participatory GIS, Volunteered Geographic Information and Citizen Science - G...
Participatory GIS, Volunteered Geographic Information and Citizen Science - G...
 
Tsinghua city care
Tsinghua city careTsinghua city care
Tsinghua city care
 

Recently uploaded

VIP High Class Call Girls Bikaner Anushka 8250192130 Independent Escort Servi...
VIP High Class Call Girls Bikaner Anushka 8250192130 Independent Escort Servi...VIP High Class Call Girls Bikaner Anushka 8250192130 Independent Escort Servi...
VIP High Class Call Girls Bikaner Anushka 8250192130 Independent Escort Servi...Suhani Kapoor
 
From idea to production in a day – Leveraging Azure ML and Streamlit to build...
From idea to production in a day – Leveraging Azure ML and Streamlit to build...From idea to production in a day – Leveraging Azure ML and Streamlit to build...
From idea to production in a day – Leveraging Azure ML and Streamlit to build...Florian Roscheck
 
{Pooja: 9892124323 } Call Girl in Mumbai | Jas Kaur Rate 4500 Free Hotel Del...
{Pooja:  9892124323 } Call Girl in Mumbai | Jas Kaur Rate 4500 Free Hotel Del...{Pooja:  9892124323 } Call Girl in Mumbai | Jas Kaur Rate 4500 Free Hotel Del...
{Pooja: 9892124323 } Call Girl in Mumbai | Jas Kaur Rate 4500 Free Hotel Del...Pooja Nehwal
 
20240419 - Measurecamp Amsterdam - SAM.pdf
20240419 - Measurecamp Amsterdam - SAM.pdf20240419 - Measurecamp Amsterdam - SAM.pdf
20240419 - Measurecamp Amsterdam - SAM.pdfHuman37
 
Schema on read is obsolete. Welcome metaprogramming..pdf
Schema on read is obsolete. Welcome metaprogramming..pdfSchema on read is obsolete. Welcome metaprogramming..pdf
Schema on read is obsolete. Welcome metaprogramming..pdfLars Albertsson
 
Unveiling Insights: The Role of a Data Analyst
Unveiling Insights: The Role of a Data AnalystUnveiling Insights: The Role of a Data Analyst
Unveiling Insights: The Role of a Data AnalystSamantha Rae Coolbeth
 
Building on a FAIRly Strong Foundation to Connect Academic Research to Transl...
Building on a FAIRly Strong Foundation to Connect Academic Research to Transl...Building on a FAIRly Strong Foundation to Connect Academic Research to Transl...
Building on a FAIRly Strong Foundation to Connect Academic Research to Transl...Jack DiGiovanna
 
EMERCE - 2024 - AMSTERDAM - CROSS-PLATFORM TRACKING WITH GOOGLE ANALYTICS.pptx
EMERCE - 2024 - AMSTERDAM - CROSS-PLATFORM  TRACKING WITH GOOGLE ANALYTICS.pptxEMERCE - 2024 - AMSTERDAM - CROSS-PLATFORM  TRACKING WITH GOOGLE ANALYTICS.pptx
EMERCE - 2024 - AMSTERDAM - CROSS-PLATFORM TRACKING WITH GOOGLE ANALYTICS.pptxthyngster
 
Beautiful Sapna Vip Call Girls Hauz Khas 9711199012 Call /Whatsapps
Beautiful Sapna Vip  Call Girls Hauz Khas 9711199012 Call /WhatsappsBeautiful Sapna Vip  Call Girls Hauz Khas 9711199012 Call /Whatsapps
Beautiful Sapna Vip Call Girls Hauz Khas 9711199012 Call /Whatsappssapnasaifi408
 
Data Warehouse , Data Cube Computation
Data Warehouse   , Data Cube ComputationData Warehouse   , Data Cube Computation
Data Warehouse , Data Cube Computationsit20ad004
 
Low Rate Call Girls Bhilai Anika 8250192130 Independent Escort Service Bhilai
Low Rate Call Girls Bhilai Anika 8250192130 Independent Escort Service BhilaiLow Rate Call Girls Bhilai Anika 8250192130 Independent Escort Service Bhilai
Low Rate Call Girls Bhilai Anika 8250192130 Independent Escort Service BhilaiSuhani Kapoor
 
VIP Call Girls Service Miyapur Hyderabad Call +91-8250192130
VIP Call Girls Service Miyapur Hyderabad Call +91-8250192130VIP Call Girls Service Miyapur Hyderabad Call +91-8250192130
VIP Call Girls Service Miyapur Hyderabad Call +91-8250192130Suhani Kapoor
 
Delhi Call Girls CP 9711199171 ☎✔👌✔ Whatsapp Hard And Sexy Vip Call
Delhi Call Girls CP 9711199171 ☎✔👌✔ Whatsapp Hard And Sexy Vip CallDelhi Call Girls CP 9711199171 ☎✔👌✔ Whatsapp Hard And Sexy Vip Call
Delhi Call Girls CP 9711199171 ☎✔👌✔ Whatsapp Hard And Sexy Vip Callshivangimorya083
 
Customer Service Analytics - Make Sense of All Your Data.pptx
Customer Service Analytics - Make Sense of All Your Data.pptxCustomer Service Analytics - Make Sense of All Your Data.pptx
Customer Service Analytics - Make Sense of All Your Data.pptxEmmanuel Dauda
 
Saket, (-DELHI )+91-9654467111-(=)CHEAP Call Girls in Escorts Service Saket C...
Saket, (-DELHI )+91-9654467111-(=)CHEAP Call Girls in Escorts Service Saket C...Saket, (-DELHI )+91-9654467111-(=)CHEAP Call Girls in Escorts Service Saket C...
Saket, (-DELHI )+91-9654467111-(=)CHEAP Call Girls in Escorts Service Saket C...Sapana Sha
 
RadioAdProWritingCinderellabyButleri.pdf
RadioAdProWritingCinderellabyButleri.pdfRadioAdProWritingCinderellabyButleri.pdf
RadioAdProWritingCinderellabyButleri.pdfgstagge
 

Recently uploaded (20)

VIP Call Girls Service Charbagh { Lucknow Call Girls Service 9548273370 } Boo...
VIP Call Girls Service Charbagh { Lucknow Call Girls Service 9548273370 } Boo...VIP Call Girls Service Charbagh { Lucknow Call Girls Service 9548273370 } Boo...
VIP Call Girls Service Charbagh { Lucknow Call Girls Service 9548273370 } Boo...
 
VIP High Class Call Girls Bikaner Anushka 8250192130 Independent Escort Servi...
VIP High Class Call Girls Bikaner Anushka 8250192130 Independent Escort Servi...VIP High Class Call Girls Bikaner Anushka 8250192130 Independent Escort Servi...
VIP High Class Call Girls Bikaner Anushka 8250192130 Independent Escort Servi...
 
꧁❤ Aerocity Call Girls Service Aerocity Delhi ❤꧂ 9999965857 ☎️ Hard And Sexy ...
꧁❤ Aerocity Call Girls Service Aerocity Delhi ❤꧂ 9999965857 ☎️ Hard And Sexy ...꧁❤ Aerocity Call Girls Service Aerocity Delhi ❤꧂ 9999965857 ☎️ Hard And Sexy ...
꧁❤ Aerocity Call Girls Service Aerocity Delhi ❤꧂ 9999965857 ☎️ Hard And Sexy ...
 
From idea to production in a day – Leveraging Azure ML and Streamlit to build...
From idea to production in a day – Leveraging Azure ML and Streamlit to build...From idea to production in a day – Leveraging Azure ML and Streamlit to build...
From idea to production in a day – Leveraging Azure ML and Streamlit to build...
 
{Pooja: 9892124323 } Call Girl in Mumbai | Jas Kaur Rate 4500 Free Hotel Del...
{Pooja:  9892124323 } Call Girl in Mumbai | Jas Kaur Rate 4500 Free Hotel Del...{Pooja:  9892124323 } Call Girl in Mumbai | Jas Kaur Rate 4500 Free Hotel Del...
{Pooja: 9892124323 } Call Girl in Mumbai | Jas Kaur Rate 4500 Free Hotel Del...
 
Russian Call Girls Dwarka Sector 15 💓 Delhi 9999965857 @Sabina Modi VVIP MODE...
Russian Call Girls Dwarka Sector 15 💓 Delhi 9999965857 @Sabina Modi VVIP MODE...Russian Call Girls Dwarka Sector 15 💓 Delhi 9999965857 @Sabina Modi VVIP MODE...
Russian Call Girls Dwarka Sector 15 💓 Delhi 9999965857 @Sabina Modi VVIP MODE...
 
20240419 - Measurecamp Amsterdam - SAM.pdf
20240419 - Measurecamp Amsterdam - SAM.pdf20240419 - Measurecamp Amsterdam - SAM.pdf
20240419 - Measurecamp Amsterdam - SAM.pdf
 
Schema on read is obsolete. Welcome metaprogramming..pdf
Schema on read is obsolete. Welcome metaprogramming..pdfSchema on read is obsolete. Welcome metaprogramming..pdf
Schema on read is obsolete. Welcome metaprogramming..pdf
 
Unveiling Insights: The Role of a Data Analyst
Unveiling Insights: The Role of a Data AnalystUnveiling Insights: The Role of a Data Analyst
Unveiling Insights: The Role of a Data Analyst
 
Building on a FAIRly Strong Foundation to Connect Academic Research to Transl...
Building on a FAIRly Strong Foundation to Connect Academic Research to Transl...Building on a FAIRly Strong Foundation to Connect Academic Research to Transl...
Building on a FAIRly Strong Foundation to Connect Academic Research to Transl...
 
EMERCE - 2024 - AMSTERDAM - CROSS-PLATFORM TRACKING WITH GOOGLE ANALYTICS.pptx
EMERCE - 2024 - AMSTERDAM - CROSS-PLATFORM  TRACKING WITH GOOGLE ANALYTICS.pptxEMERCE - 2024 - AMSTERDAM - CROSS-PLATFORM  TRACKING WITH GOOGLE ANALYTICS.pptx
EMERCE - 2024 - AMSTERDAM - CROSS-PLATFORM TRACKING WITH GOOGLE ANALYTICS.pptx
 
Beautiful Sapna Vip Call Girls Hauz Khas 9711199012 Call /Whatsapps
Beautiful Sapna Vip  Call Girls Hauz Khas 9711199012 Call /WhatsappsBeautiful Sapna Vip  Call Girls Hauz Khas 9711199012 Call /Whatsapps
Beautiful Sapna Vip Call Girls Hauz Khas 9711199012 Call /Whatsapps
 
Data Warehouse , Data Cube Computation
Data Warehouse   , Data Cube ComputationData Warehouse   , Data Cube Computation
Data Warehouse , Data Cube Computation
 
Low Rate Call Girls Bhilai Anika 8250192130 Independent Escort Service Bhilai
Low Rate Call Girls Bhilai Anika 8250192130 Independent Escort Service BhilaiLow Rate Call Girls Bhilai Anika 8250192130 Independent Escort Service Bhilai
Low Rate Call Girls Bhilai Anika 8250192130 Independent Escort Service Bhilai
 
VIP Call Girls Service Miyapur Hyderabad Call +91-8250192130
VIP Call Girls Service Miyapur Hyderabad Call +91-8250192130VIP Call Girls Service Miyapur Hyderabad Call +91-8250192130
VIP Call Girls Service Miyapur Hyderabad Call +91-8250192130
 
Delhi Call Girls CP 9711199171 ☎✔👌✔ Whatsapp Hard And Sexy Vip Call
Delhi Call Girls CP 9711199171 ☎✔👌✔ Whatsapp Hard And Sexy Vip CallDelhi Call Girls CP 9711199171 ☎✔👌✔ Whatsapp Hard And Sexy Vip Call
Delhi Call Girls CP 9711199171 ☎✔👌✔ Whatsapp Hard And Sexy Vip Call
 
Customer Service Analytics - Make Sense of All Your Data.pptx
Customer Service Analytics - Make Sense of All Your Data.pptxCustomer Service Analytics - Make Sense of All Your Data.pptx
Customer Service Analytics - Make Sense of All Your Data.pptx
 
Saket, (-DELHI )+91-9654467111-(=)CHEAP Call Girls in Escorts Service Saket C...
Saket, (-DELHI )+91-9654467111-(=)CHEAP Call Girls in Escorts Service Saket C...Saket, (-DELHI )+91-9654467111-(=)CHEAP Call Girls in Escorts Service Saket C...
Saket, (-DELHI )+91-9654467111-(=)CHEAP Call Girls in Escorts Service Saket C...
 
RadioAdProWritingCinderellabyButleri.pdf
RadioAdProWritingCinderellabyButleri.pdfRadioAdProWritingCinderellabyButleri.pdf
RadioAdProWritingCinderellabyButleri.pdf
 
Deep Generative Learning for All - The Gen AI Hype (Spring 2024)
Deep Generative Learning for All - The Gen AI Hype (Spring 2024)Deep Generative Learning for All - The Gen AI Hype (Spring 2024)
Deep Generative Learning for All - The Gen AI Hype (Spring 2024)
 

Mapping Boston's Public Realm Through Instagram

  • 1. MAPPING BOSTON’S PUBLIC REALM AS PERCEIVED Evidence from 60,000 Instagram Posts Prepared for Territorial Intelligence Professor Luis Valenzuela Harvard Graduate School of Design Fall 2014 Contributors: Yunjie Li Chaewon Ahn
  • 2. | MAPPING INSTAGRAM BOSTO Abstract: This research seeks to understand public realm of the city through the human activity captured through social network Instagram data. Owning to the develop in smart phone and GIS technology, this new vision of the city first, refuses to understand of the urban public space as a pure construct of a open access squares and open spaces, but also privately owned commercial or recreational cases. Second, it overlays the physical urban environment with layers of social activities and human interactions. In this research, over 63,333 Instagrams of downtown Boston are retrieved via API service, before mapped for kernel density in ArcGIS. This was compared to the cognitive mapping of the same area by Kevin Lynch, 1960. Further more, 8 cases of different public spaces analyzed, including land use composition, posting time pattern and the architectural site plan. The results confirmed that conditional social space (e.g. commercial and recreational land use) has become a critical ground for social activities, yet not demonstrating decay of “public space” in a classic sense. The result informs us that the gravity of conditional social space asks urban planners and architects to understand and engage in public space and conditional social space synthetically. Key Words: public realm, city image, social media, cognitive mapping, GIS
  • 3. MAPPING INSTAGRAM BOSTON | Table of Contents 2 INTRODUCTION 4 2.1 BACKGROUND ERROR! BOOKMARK NOT DEFINED. 3 LITERATURE REVIEW 5 3.1 CHANGING CHARACTER OF PUBLIC REALM 5 3.2 NEW METHODOLOGIES TO READ THE CITY 5 3.3 OPPORTUNITIES – SOCIAL MEDIA ERROR! BOOKMARK NOT DEFINED. 4 METHODOLOGY 7 4.1 INSTAGRAM DATA 7 4.2 LAND USE CATEGORIZATION 8 4.3 SPATIAL ANALYSIS 9 5 BOSTON IN GENERAL 10 5.1 GENERAL PICTURE 10 5.2 CASE SELECTION 11 6 CASE STUDIES 13 6.1 BOSTON COMMON AND COPLEY SQUARE 13 6.2 THE THREE SHOPPING DISTRICTS 14 6.3 GOVERNMENT CENTER AND FANEUIL HALL 14 6.4 SOUTH STATION AND BEACH STREET 15 6.5 CASE SUMMARY 16 7 CONCLUSIONS 17 8 APPENDIX 18 9 BIBLIOGRAPHY 28
  • 4. | MAPPING INSTAGRAM BOSTO 1 Introduction How do we map human activities? The explosive growth of social network services, and the open access to information of such services provides a possibility to collect and compute the information people leave on social network services. During the last 14 years, the number of web services that provide open API that allows access to functionalities and information of various websites grew from one to 2,8001 . Simultaneously, the number of social network service users grew exponentially, that 67% of Internet users utilize any kind of social network service2 . We selected downtown Boston (Central, Back Bay and South End) as the research site, and conduct the research on two scales. First, we analyze the Social network service data in a citywide scale to understand the behavior of the data. Next we select 9 areas to look into the posting density, changes of user behavior in time, and the physical elements of the site. 1 “What is an API? Your guide to the Internet Business (R)evolution” 2012, Accessed December 15 2014. http://www.3scale.net/wp- content/uploads/2012/06/What-is-an-API-1.0.pdf 2 Duggan, Maeve, and Joanna Brenner. The demographics of social media users, 2012. Vol. 14. Washington, DC: Pew Research Center's Internet & American Life Project, 2013: 2. Figure 1 Two phases of analysis
  • 5. MAPPING INSTAGRAM BOSTON | 2 Literature review 2.1 Changing character of public realm During the last 50 years, many writers recognized that the public realm should be defined as an extended meaning including various types of spaces essential for social actives. In this research, we rely on the contemporary boundary public space and attempt to utilize user generated data analysis to see to what extent these observations could be justified. Jane Jacobs criticized in her book ‘The death and life of great American cities (1961)’ that both modern planning and detached single-family houses brought about the disappearances of public sphere where this civitas happens3 . Ray Oldenburg continues criticism on the public sphere with in his book ‘The great good place (1989)’ that the balance between the domestic, productive and sociable realm fosters a vital neighborhood with a sense of community. In 2001, Tridib Banerjee published an article in the Journal of the American planning association entitled “The Future of Public Space: Beyond Invented Streets and Reinvented Places”. The article describes how privatization, globalization and the communications revolution have changed the demand and supply of the public space4 . He argues that planner’s goals should be based on an expanded vision that includes the mediation between public, private and non profit space, and support private ‘third spaces’ as well that contribute to public life.5 In 2012, Kazyz Varnelis published ‘Networked publics’ that collects writings on how the relationship to place, culture, politics and infrastructure has changed with the pervasive spread of digital media and network technologies. ‘Being online in the presence of others is the new place to be’, so he quoted Brian Niemetz.6 2.2 New methodologies to read the city 3 Ibid., 40 4 Banerjee, Tridib. "The future of public space: beyond invented streets and reinvented places." Journal of the American Planning Association 67, no. 1 (2001): 9- 24, 9 5 Ibid., 20 6 Varnelis, Kazys. Networked publics. The MIT Press, 2012: 20.
  • 6. | MAPPING INSTAGRAM BOSTO ‘The image of the city’ (Kevin Lynch, 1961) analyzes the visual quality of the city by studying the mental image of the city, which is held by its citizens7 . In his research they interviewed thirty people in Boston and sixteen of them went for the second session for photograph identification and map drawing. Still, the time-consuming nature of person-to-person interviews limits the scale of the research, while subjectivity of the researcher and designer are likely to influence the subjects’ response. In this research, we introduce the geo-tagged social media data for better understanding of the public’s perception of urban spaces. Compared to Lynch, this data driven approach tends to be more neutral, with significantly larger the sample pool in terms of number and diversity. Turton polly describes that data and technology has gotten highlights in areas fields such as, crowd funding, digital place making for real time city planning, risk and urban design, and visual analytics to inform design8 . Our research locates in the last field, which deals with visual analytics to inform design. There have been several precedents that aimed to analyze the city through SNS data. In 2012, Vanessa Frias-Martinez published ‘Characterizing Urban Landscapes using Geolocated Tweets’ on Privacy, Security, Risk and Trust. Following, ‘Exploiting Foursquare and Cellular Data to Infer User Activity in Urban Environments’ by Anastasios Noulas, was published in the 2013 that combined a dataset collected from a telecom provider in Spain with geo-tagged foursquare venues. 7 Lynch, Kevin. The image of the city. Vol. 11. MIT press, 1960: 2. 8 Turton, Polly. “Data, technology and urban design”, Urban Design: Data, technology and urban design, 132, Autumn 2014: 20–36.
  • 7. MAPPING INSTAGRAM BOSTON | 3 Methodology 3.1 Instagram Data We chose to utilize Instagram data to capture the actual social activities happening in the city. The aggregated information will generate a macro image of the city of ‘places’ people recognize subconsciously. Instagram is one of the most fast growing social network services, which allows users to edit and share photos with their ‘friends’. The user demographic shows that women, people under 50 years, African-Americans and Hispanics, urban residents are more likely to use it9 . And according to a recent image analysis, the content of these Instagrams comprises 8 major categories, with 46.6% of photos being selifies and friends, followed with 16% of posts on activities.10 These figures show that Instagram is a fast growing social network service where people disclose their personal and social experiences. This research utilizes metadata embedded in the locations and the posts. When creating a post on Instagram, users may tag a location. Through this action, anonymous space becomes a part of moments recorded and shared. It becomes a place that embeds meaning. And each post contains metadata of the time, user, tagged user, text, hash tag, likes and comments. 9 Duggan, Maeve, and Joanna Brenner. The demographics of social media users, 2012. Vol. 14. Washington, DC: Pew Research Center's Internet & American Life Project, 2013: 6. 10 Hu, Yuheng, Lydia Manikonda, and Subbarao Kambhampati. "What We Instagram: A First Analysis of Instagram Photo Content and User Types.", 2014: 4. Figure 2 Information embedded in a point
  • 8. | MAPPING INSTAGRAM BOSTO 2.3 Acquisition of data The data is acquired through API (application programming interface), which is a platform provided by websites for software developers to build an application that utilizes information or functionalities from the provider’s web service. And coding in Python language in this research facilitated this process. After creating a grid of 1000 meters on each side, we imported the coordinats of the grid into Python, and parsed the URL that directs the API service to do the ‘location search’ which is getting ‘location-id’s around each point we created in a radius of 1000 meters.11 3.2 Land use categorization Based on the land use map of Boston, we re-categorized the 37 existing land use map of Boston newly into 4 categories according to its social character. The four categories are Public space, Conditional public space, Private space and Non-social space. Conditional public space includes privately owned public space and privatized public space that mainly refers to commercial space. While ‘Public space’ refers to the traditional public realm, the ‘Conditional public space’ represents the ‘third space’ recognized by Oldenburg and Banerjee. The ratio and spatial distribution of different kinds of public space in Boston is used as a base map on which the social network service data is going to be overlapped on. This will allow seeing what kinds of social spaces are more visited, housing social experiences. And a large-scale visualization will draw a comparison between the area recognized as ‘public’ and more ‘private’. Also, in the second phase, the same comparison could be different scale. 11 Location Endpoints. Accessed December 15. http://instagram.com/developer/endpoints/locations/ Posts 63333 Users 27392 Locations Ave. posts/ user 2.31 Area 15,332,591 Post per acre 179.93 Ave likes/ post 30.36 Ave comments/ post 1.76 Ave tagged uers/ post 0.29 Start date 10/13/2010 End date 11/29/2014 Figure 3 analyzing the character through meta data Table 1 Data Summary
  • 9. MAPPING INSTAGRAM BOSTON | 3.3 Spatial Analysis With the Instagram data retrieved through API and various GIS information available from the city of Boston, we began by importing the comma separated text data into GIS. For data analysis we focused on three aspects of the data: spatial density, time pattern, and in what type of social space the posts are posted. First, with the help of the spatial analysis toolbox of ArcGIS, we calculated the kernel density for the point feature the Instagram posts12 . This allow us to read the spatial distribution of the over 60,000 posts. For visualization, we classify the map using number of standard deviation(see Figure 24 Kernel density map of Instagram posts in the Appendix). Second, we took advantage of the selection by attribute and by location command in ArcGIS to identity the spatial context of the location. In particular, we looked at two attributes: the type of land use (as defined above), and whether it is indoor or outdoor (according to the building foot print map from the city of Boston). Comparing to census data sources that focus mainly on information of the residents, these two map layers cover a better variety of social space and thus a better fit for the research. Third, we utilize the timestamp recorded in each Instagram post to understand the user’s group of these locations. By converting the unix timestamp to human date, we are able to summarize the daily, weekly or annual pattern of people’s posting habits, and eventually who they are and why they post. 12 Kernel density calculates a magnitude per unit area from point or polyline features using a kernel function to fit a smoothly tapered surface to each point or polyline. See more in http://resources.arcgis.com/en/help/main/10.2/index.html#/How_Kernel_Density_works/00 9z00000011000000/ . Figure 4 kernel density
  • 10. | MAPPING INSTAGRAM BOSTO 4 Boston in General 4.1 General Picture As shown in Figure 24 Kernel density map of Instagram posts, the density of posting in the three district of downtown Boston vary from place to place. In general, the Southern half of Back Bay and the band from east of Boston Commons to Government Center – Faneuil Hall Marketplace and beyond, are the areas of the densest postings. As the current zoning map of Boston indicates, these highly active areas mostly fall into the conditional social category of our land use re-categorization. Some of the most prominent clusters include Newbury Street, Charles Street, Emerson College to the south of Boston Common, South Station, and the art galleries of Another Instagram favorite is the art districts near Harrison Avenue in the South. Also, the high-end shopping mall of Copley Place remains the one with greatest number of comments and likes. As for the urban context of these 63 thousand Instagrams, a break down of the social space categories shows a mismatch of land area and volume of posts. According to the zoning map between 1971 and 1999 saw no significant change in the category composition. Nevertheless, the majority of the Instagram posts falls into the category of conditional social space, almost twice in percentage and mainly absorbed from the open social’s. In other words, these in-between land uses of commercial, spectator sports, etc. are far more important in a social sense than a physical or architectural sense. Furthermore, the 48-hour chart in Figure 6 shows the peak hours of Instagram posts in an average weekday and weekend. Among the land use types, the trends of conditional social space rise and drop more dramatically. Throughout the year, the posting grows in volume since spring, peaks in November, before dropping sharply in December. While outdoor postings are also more susceptible to this annual fluctuation, they outnumber that the indoor number in all months and use types. Figure 5 Land use change and social media
  • 11. MAPPING INSTAGRAM BOSTON | Figure 6 Daily posting volume (weekday / weekend) Figure 7 Posting in year round (Indoor/ Outdoor) 4.2 Case Selection Based on the spatial analysis above, we chose 9 nodes of public space as our cases for close-up analysis. We feel these nine places could best represent the different characters of the public realm in the territory, including both historic and classic ones since Kevin Lynch’s map as well as the newly emerged or transformed locations. The boundaries are drawing in accordance with census blocks.
  • 12. | MAPPING INSTAGRAM BOSTO Figure 8 Case selection and post kernel density Among them, the Boston Common, Copley Square, Government Center, Faneuil Hall and South Station are important city nodes back in Kevin Lynch’s Boston map, while all the latter four went through significant transformations after the book came out. The cases of Newbury Street, Prudential Center and Charles Street are added as representatives of newly emerged shopping districts, while unique in different ways. The two blocks of Beach Street is Chinatown are selected because of its high volume of posts during nighttime.
  • 13. MAPPING INSTAGRAM BOSTON | 5 Case studies 5.1 Boston Common and Copley Square The first two cases, the Boston Common (including the Public Garden) and Copley Square remain two of the most important public spaces in Boston of all times. In the Instagram, however, they are not among the most densely posted areas. Being the oldest park in the country, the Boston Common is the anchor of the green space system of downtown Boston13. However the density of posting in the 80 acre parks stays low, partly due to its immense scale. Still, the historic park’s relative high amount of likes and comments indicates its indisputable popularity, as is shown in Table 2. At the micro scale, the most favorite spot is the Soldiers and Sailors Monument in the middle, and also near the Copley station of the red line. Surrounded by a number of significant historical cultural architectures, the Copley Square is another classic public square of Boston. The MBTA green line station also makes it a center of the hustle and bustle of life in downtown. It is a place that connects different means of transportation as well as for short visits. As for the time pattern, postings of Boston Common began at around sunrise and remain high in the afternoon until 11 at night, with high volume in general during a weekend day than weekday. The afternoon peak is not so prominent for Copley Square, in comparison to the general pattern of Boston and other cases. For the parks, users’ favorite times of a year are summer and fall. The public square, on the other hand, sees two peaks between Mar and Jun as well as between September and November. The latter apparently coincides with the two school semesters, for reasons still unknown. 13 CityofBoston.gov, Boston Common, http://www.cityofboston.gov/freedomtrail/bostoncommon.asp Figure 9 Boston Common Figure 10 Copley Square Figure 11 Newbury Street
  • 14. | MAPPING INSTAGRAM BOSTO 5.2 The Three Shopping Districts The next three cases, Newbury Street, Charles Street in Beacon Hill and Prudential Center, are some of the most visited shopping districts in the downtown area. While none of them appeared in the Kevin Lynch’s Boston map before 1960, all of them made it within the first standard deviation in the kernel density map (Figure 8). Converted from the late 19th century residential area, Newbury Street’s popularity is unparalleled among all the cases (with the most average likes per post of 38.42 and comments of 2.18, and second highest of 0.36 users tagged). The open streets definitely share a large part of the shopping districts’ vibrancy, as more Instagrams are posted outdoors than indoors for open and conditional social spaces. The case of Charles Street went through similar transformation from residential to commercial use, while the location within the historic district of Beacon Hill and more high-end choice of retail and restaurants distinguish it from the other two places. And the Prudential Center completed in 1964 offers the indoor galleria experience of shopping, which houses a lower activity of Instagram spatially. As for the time pattern, the daily posting habit of users in these areas are more influenced by the hours of the stores. While the weekday volume of Newbury Street and Charles Street are not so different from downtown Boston in general, they experience a higher peak that starts and ends relatively earlier. Charles Street in Beacon Hill is particularly popular in lunch and dinnertime. As for Prudential Center, there is no significant difference between weekday and weekend. Annually the posting habits vary in the three cases, except for a shared dormant January and February time. Even if the total amount of Instagrams in downtown Boston drops dramatically in the last month of the year, this is definitely not the case for the shopping districts. 5.3 Government Center and Faneuil Hall Another two classic public spaces in Kevin Lynch’s map are the Government Center and Faneuil Hall, on both sides of Congress Street. Located in the more historical part of Central Boston, the two building Figure 12 Charles Street, Beacon Hill Figure 13 Prudential Center Figure 14 Government Center (left) and Faneuil Hall (right)
  • 15. MAPPING INSTAGRAM BOSTON | complexes are more diverse in function. As they both went through intensive redevelopment throughout the decades, the two quite vary in spatial character and social activities. A historical marketplace and a meeting hall since 174214 , Faneuil Hall now houses a variety of functions including shopping and dining, exhibition, street theater as well as government debates. The scattered footprints of architecture also result in a roughly equal amount of posts both indoor and outdoor. Across the street, the grand plaza is less busy with activities. Built in the Urban Renewal era of Boston in the 1960s, the brutalist architecture is not universally admired. Spatially, the posts are denser in the Southern part of the plaza, where the scale of buildings and open space is smaller, with the majority sent outdoor. 5.4 South Station and Beach Street The last two cases are unique in their functions and characteristics. As the most important transportation terminal, South Station is a hub of traffic in and out of Boston, where all kinds of welcome and farewell takes place. As a matter of fact, the platforms remain the “loneliest” case among all the nine case studies, with one of the lowest average likes per post (22.17), comments (1.29) and tagged users (0.15, see Table 2). Also, because trips from South Station are in many cases short inter-city ones, they might not be terribly impressive to their Instagram friends. The timing of the posting in turn is relatively stable, with no significant difference between a weekday and weekend, and the winter break the absolute annual peak. The last case is the Instagram cluster that covers mainly two blocks of Chinatown15 . Mainly restaurants and bars, the marked high density of posting in this part of Boston could be explained by the unprecedented high volume of posts between 1 and 3 a.m.. Being one of the few dining places that stay open after midnight, the Chinatown blocks find its “Instagram niche” in the early morning. Also, despite the strong relationship with dining and food in these blocks, we find more posts outdoor than indoor. 14 Cityofboston.gov, Faneuil Hall, http://www.cityofboston.gov/freedomtrail/faneuilhall.asp 15 The blocks are bounded by Beach St, Kneeland St, Harrison Ave and Hudson St. It is named “Beach Street” only for the purpose of this case study. Figure 15 South Station Figure 16 Beach St in Chinatown
  • 16. | MAPPING INSTAGRAM BOSTO 5.5 Case Summary In conclusion, we see some trends in the transformation of public realm since 1960. While newly converted cases like Newbury Street remain the most active and vibrant in social media, the classic public squares and parks are recorded and shared their own ways. Also, rather than assumptions like people simply post less outdoors in winter, the reason why people post in certain physical and social settings varies. Table 2 Summary of Instagram posts in each case Cases Boston Common Copley Square Newbury Street Charles Street Prudential Center Government Center Faneuil Hall South Station Beach Street Posts 2857 352 2976 921 2056 986 647 842 329 Users 2087 296 1997 635 1517 753 580 764 236 Posts per user 1.37 1.19 1.49 1.45 1.36 1.31 1.12 1.10 1.39 Area (acres) 80.63 4.37 33.92 12.80 35.54 19.14 9.28 29.68 2.94 Post /acre 35.43 80.59 87.74 71.96 57.85 51.51 69.75 28.37 111.93 Ave. likes 37.25 32.71 38.42 37.41 29.50 21.77 27.37 22.17 24.58 Ave. comments 1.95 1.44 2.18 1.72 1.68 1.43 1.66 1.29 1.48 Ave. tagged users 0.31 0.13 0.36 0.31 0.37 0.29 0.36 0.15 0.27 Figure 17 Annual volumes of cases
  • 17. MAPPING INSTAGRAM BOSTON | 6 Conclusions In conclusion, basing on evidence from the 63,000 Instagrams, we see some trends in the transformation of public realm since Kevin Lynch mapped the cognitive Boston five decades ago. One of the critical changes is the expansion of the ‘conditional open social space’, or in other words, the places neither the public open space in a classical sense or privately used space, but those ‘in-between’ ones. Yet this does not necessarily suggest a ‘privatization of public space’, for in some of the most popular cases like Newbury Street they are converted from more private land uses. In the meantime, even if the “traditional” public spaces like Boston Common and squares are no longer the center of social activities and social media posting, often it is on the outskirts of these public amenities that retail, restaurants and entertainment thrive. While Instagram map should not be seen as a reminder of the decay of these spaces, the newly emerged commercial and entertainment space deserves equal attention from the urban designers and planners. The limitation of the research lies in the nature of SNS data. We could understand the general user demographics and content through other researches, but it was impossible to accurately know each individual user’s profile that aggregated into 60,000 posts. We believe that a more precise analysis could be structured by correlating other data that explains the social structure of the sites. Also, even though we selected sites to conduct in-depth analysis, the research failed to reach the scale of spatial element analysis of each sites. This analysis could have brought more insight about spatial elements that generate popular places.
  • 18. | MAPPING INSTAGRAM BOSTO 7 Appendix Figure 18 Categorization of Social Space Figure 19 Case selection and land use
  • 19. MAPPING INSTAGRAM BOSTON | Figure 20 The Boston image as derived from verbal interviews (Kevin Lynch, 1960) Figure 21 The Boston image as derived from Instagram (2014)
  • 20. | MAPPING INSTAGRAM BOSTO Figure 22 Instagram posts and likes Figure 23 Instagram posts and tagged friends
  • 21. MAPPING INSTAGRAM BOSTON | Figure 24 Kernel density map of Instagram posts Legend Kernel density of posts Percentile Top 10% 10-20% 20-40% 40-60% 60-80% 80-100% CENSUS BLOCKS ´ 0 0.5 10.25 Miles
  • 22. | MAPPING INSTAGRAM BOSTO Figure 25 Kernel density in bird's eye view
  • 23. | MAPPING INSTAGRAM BOSTO Table 4 Daily Volumes of Instagrams Boston Common Copley Square Newbury Street Charles Street Prudential Center Government Center Faneuil Hall Marketplace South Station Beach St (Chinatown)
  • 24. MAPPING INSTAGRAM BOSTON | Table 5 Annual Volumes of Instagrams Boston Common Copley Square Newbury Street Charles Street Prudential Center Government Center Faneuil Hall Marketplace South Station Beach St (Chinatown)
  • 25. | MAPPING INSTAGRAM BOSTO Table 6 Posts in land use categories -Left to right: indoor, outdoor; top down: Private social (blue), conditional social (brown), open social (green) Boston Common Copley Square Newbury Street Charles Street Prudential Center Government Center Faneuil Hall Marketplace South Station Beach St (Chinatown)
  • 26. MAPPING INSTAGRAM BOSTON | Table 7 Social space compositions in zoning and Instagram Boston Common Copley Square Newbury Street Charles Street Prudential Center Government Center Faneuil Hall Marketplace South Station Beach St (Chinatown)
  • 27. | MAPPING INSTAGRAM BOSTO 8 Bibliography Banerjee, Tridib. “The Future of Public Space: Beyond Invented Streets and Reinvented Places.” Journal of the American Planning Association 67, no. 1 (March 31, 2001): 9–24. Ben-Joseph, Eran. 2005. The code of the city: standards and the hidden language of place making. Cambridge, Mass: MIT Press. Carmona, Matthew, and Filipa Wunderlich. 2012. Capital spaces: the multiple complex public spaces of a global city. Abingdon, Oxon: Routledge. Cuthbert, Alexander R. 2011. Understanding cities: method in urban design. London: Routledge. Dodge, Martin, Rob Kitchin, and Chris Perkins, eds. “Rethinking Maps: New Frontiers in Cartographic Theory”. 1 edition. New York: Routledge, 2009. Duggan, Maeve, and Joanna Brenner. The demographics of social media users, 2012. Vol. 14. Washington, DC: Pew Research Center's Internet & American Life Project, 2013. Hu, Yuheng, Lydia Manikonda, and Subbarao Kambhampati. "What We Instagram: A First Analysis of Instagram Photo Content and User Types.", 2014: 4. Jacobs, Jane. 1961. The death and life of great American cities. Lefebvre, Henri. 1991. Critique of everyday life. London: Verso. Liu, Liu. C-IMAGE: city cognitive mapping through geo-tagged photos. Diss. Massachusetts Institute of Technology, 2014. Loukaitou-Sideris, Anastasia, and Renia Ehrenfeucht. 2009. Sidewalks: conflict and negotiation over public space. Cambridge, Mass: MIT Press. Lynch, Kevin. The Image of the City. MIT Press, 1960. Oldenburg, Ray. The great good place: Cafés, coffee shops, community centers, beauty parlors, general stores, bars, hangouts, and how they get you through the day. New York: Paragon House, 1989. Salesses, Philip, Katja Schechtner, and César A. Hidalgo. "The collaborative image of the city: mapping the inequality of urban perception." PloS one 8.7 (2013): e68400. Soja, Edward W. 1996. Thirdspace: journeys to Los Angeles and other real-and-imagined places. Cambridge, Mass: Blackwell. Turton, Polly. “Data, technology and urban design”, Urban Design: Data, technology and urban design, 132, Autumn 2014: 20–36. Varnelis, Kazys. Networked publics. The MIT Press, 2012 Whyte, William Hollingsworth. 1980. The social life of small urban spaces. Washington, D.C.: Conservation Foundation.