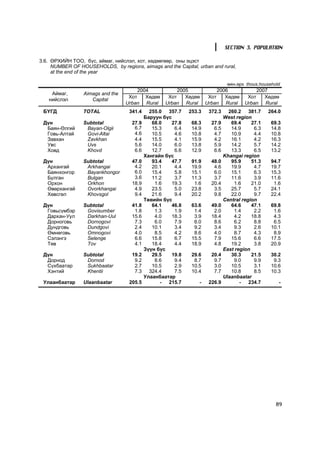
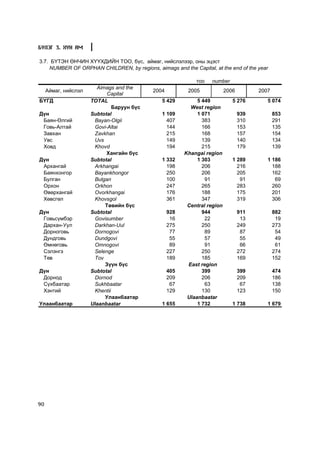
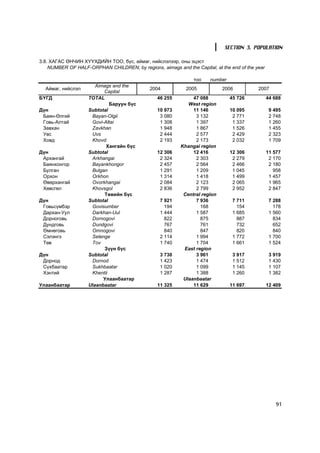
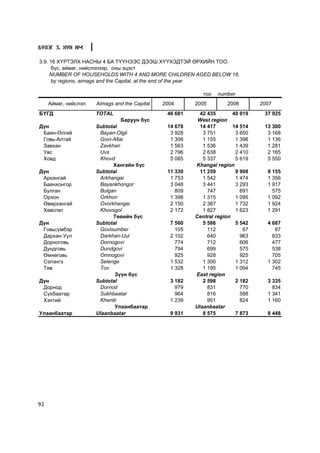
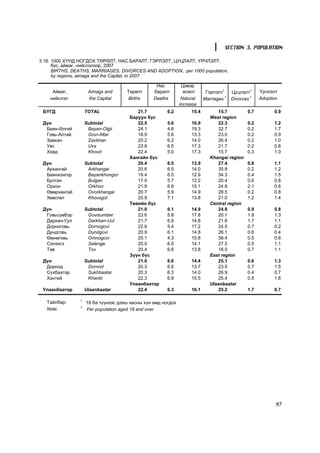
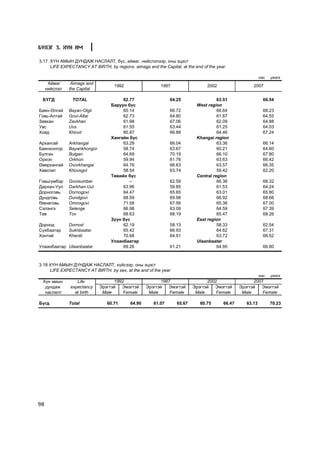
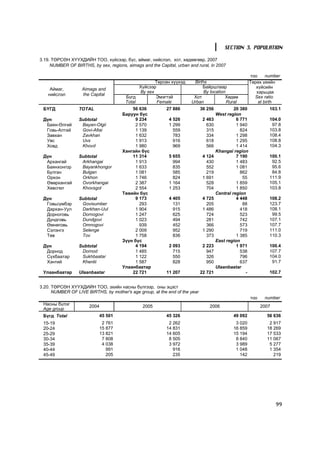
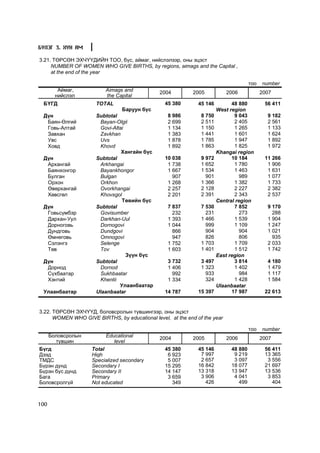
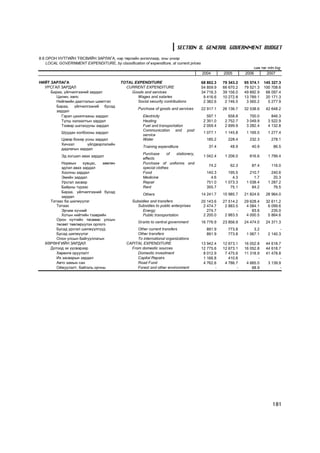
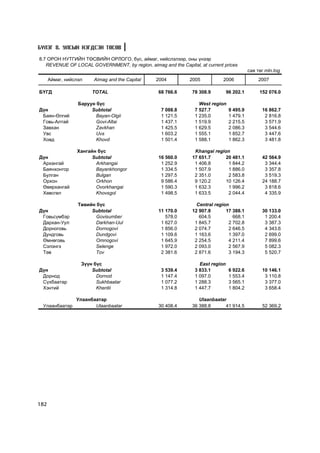
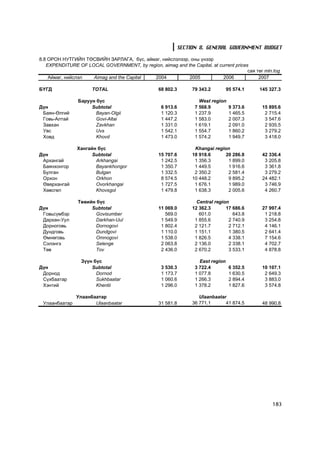
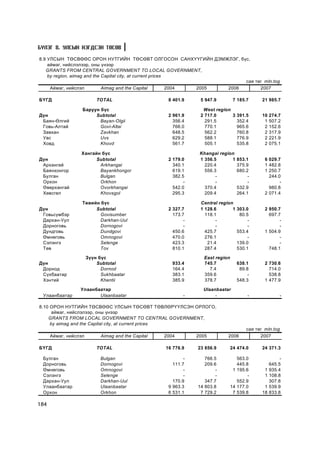
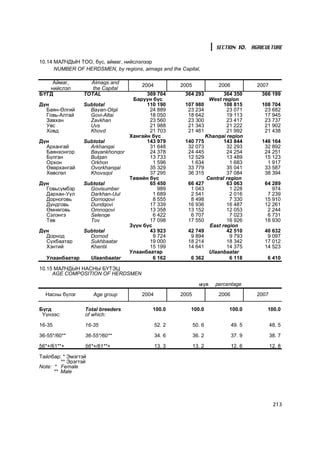
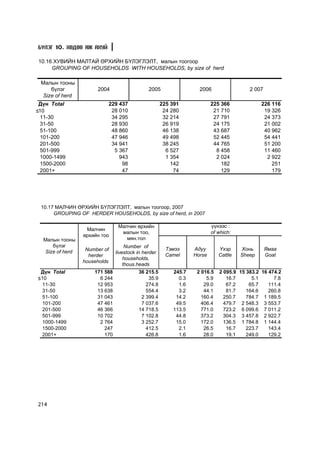
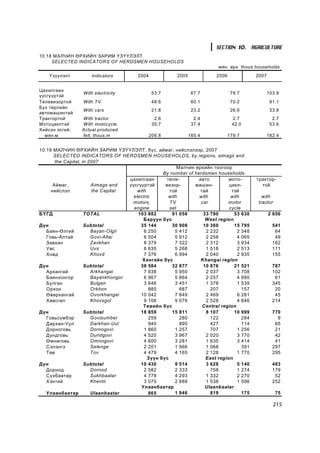
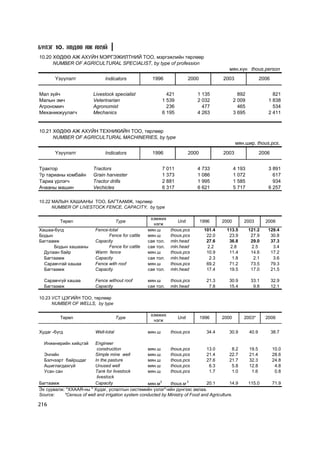
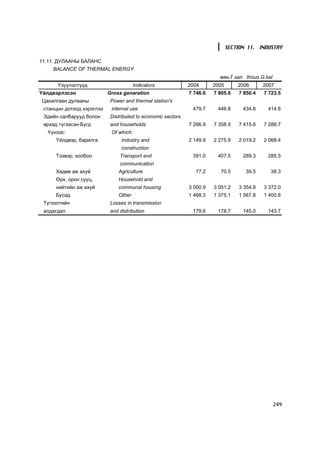
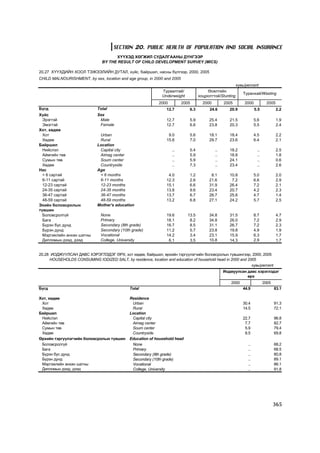
This document provides a preface to the Statistical Yearbook of Mongolia. It discusses how the National Statistical Office has been producing the yearbook since 1960 to show social and economic indicators and their time series for Mongolia. It notes that the framework of indicators has expanded with Mongolia's socio-economic development. It also mentions steps being taken to harmonize statistical indicators and methodologies with international standards. The preface explains that the yearbook includes explanations of methodologies and technical terms to make it accessible to users. It lists some additional indicators and surveys that are included in the 2007 yearbook. It encourages users to access other statistical publications and the website for more information. In closing, it welcomes any comments or requests for more
Статистика нейросенсорной тугоухости в числе профзаболеваний, связанных с воз...Охрана Труда
Нейросенсорная тугоухость – это потеря слуха, вызванная поражением структур внутреннего уха, преддверно-улиткового нерва или центральных отделов слухового анализатора (в стволе и слуховой коре головного мозга). Профессиональная нейросенсорная тугоухость – постепенное снижение остроты слуха, обусловленное длительным (многолетним) воздействием производственного шума (преимущественно высокочастотного). В России профессиональная тугоухость в структуре профессиональной патологии составляет 9-12% и занимает 3-е место после поражения нервной системы и опорно–двигательного аппарата и профессиональной пылевой патологии.
Длительное воздействие производственного шума на организм работающих характеризуется специфическим поражением слухового анализатора и неспецифическим поражением нервной, сердечно–сосудистой, пищеварительной и эндокринной систем и полиморфностью клинической картины.
К числу шумоопасных производств относятся добывающая, дерево-, металло-, камнеобрабатывающая промышленность, ткацкое производство, машино-, авиа-, судостроение и другие. Шумоопасные профессии: высокая степень тугоухости встречается у кузнецов, обрубщиков, чеканщиков, медников, авиационных мотористов. К числу шумоопасных профессий относятся также горнорабочие, проходчики, шахтеры, клепальщики, шлифовщики, полировщики, бетонщики, наждачники, заточники, слесари, котельщики, молотобойцы, жестянщики, листоправы и другие. Также в настоящее время профессиональное снижение слуха возможно у работников таких достаточно новых профессий, как диджеи, операторы call-центров и т.д.
Источниками шума являются двигатели, насосы, компрессоры, турбины, пневматические инструменты, молоты, дробилки, станки и др.
Действие производственного шума во многих случаях сочетается с воздействием вибрации, пыли, токсических и раздражающих веществ, неблагоприятных факторов микро– и макроклимата, с вынужденным неудобным, неустранимым рабочим положением тела, физическим перенапряжением, повышенным вниманием, нервно–эмоциональным перенапряжением, что ускоряет развитие патологии и обусловливает полиморфизм клинической картины. Сочетание обоих неблагоприятных факторов дает н
Affordable Stationery Printing Services in Jaipur | Navpack n PrintNavpack & Print
Looking for professional printing services in Jaipur? Navpack n Print offers high-quality and affordable stationery printing for all your business needs. Stand out with custom stationery designs and fast turnaround times. Contact us today for a quote!
[Note: This is a partial preview. To download this presentation, visit:
https://www.oeconsulting.com.sg/training-presentations]
Sustainability has become an increasingly critical topic as the world recognizes the need to protect our planet and its resources for future generations. Sustainability means meeting our current needs without compromising the ability of future generations to meet theirs. It involves long-term planning and consideration of the consequences of our actions. The goal is to create strategies that ensure the long-term viability of People, Planet, and Profit.
Leading companies such as Nike, Toyota, and Siemens are prioritizing sustainable innovation in their business models, setting an example for others to follow. In this Sustainability training presentation, you will learn key concepts, principles, and practices of sustainability applicable across industries. This training aims to create awareness and educate employees, senior executives, consultants, and other key stakeholders, including investors, policymakers, and supply chain partners, on the importance and implementation of sustainability.
LEARNING OBJECTIVES
1. Develop a comprehensive understanding of the fundamental principles and concepts that form the foundation of sustainability within corporate environments.
2. Explore the sustainability implementation model, focusing on effective measures and reporting strategies to track and communicate sustainability efforts.
3. Identify and define best practices and critical success factors essential for achieving sustainability goals within organizations.
CONTENTS
1. Introduction and Key Concepts of Sustainability
2. Principles and Practices of Sustainability
3. Measures and Reporting in Sustainability
4. Sustainability Implementation & Best Practices
To download the complete presentation, visit: https://www.oeconsulting.com.sg/training-presentations
Discover the innovative and creative projects that highlight my journey throu...dylandmeas
Discover the innovative and creative projects that highlight my journey through Full Sail University. Below, you’ll find a collection of my work showcasing my skills and expertise in digital marketing, event planning, and media production.
Attending a job Interview for B1 and B2 Englsih learnersErika906060
It is a sample of an interview for a business english class for pre-intermediate and intermediate english students with emphasis on the speking ability.
Implicitly or explicitly all competing businesses employ a strategy to select a mix
of marketing resources. Formulating such competitive strategies fundamentally
involves recognizing relationships between elements of the marketing mix (e.g.,
price and product quality), as well as assessing competitive and market conditions
(i.e., industry structure in the language of economics).
Kseniya Leshchenko: Shared development support service model as the way to ma...Lviv Startup Club
Kseniya Leshchenko: Shared development support service model as the way to make small projects with small budgets profitable for the company (UA)
Kyiv PMDay 2024 Summer
Website – www.pmday.org
Youtube – https://www.youtube.com/startuplviv
FB – https://www.facebook.com/pmdayconference
LA HUG - Video Testimonials with Chynna Morgan - June 2024Lital Barkan
Have you ever heard that user-generated content or video testimonials can take your brand to the next level? We will explore how you can effectively use video testimonials to leverage and boost your sales, content strategy, and increase your CRM data.🤯
We will dig deeper into:
1. How to capture video testimonials that convert from your audience 🎥
2. How to leverage your testimonials to boost your sales 💲
3. How you can capture more CRM data to understand your audience better through video testimonials. 📊
Digital Transformation and IT Strategy Toolkit and TemplatesAurelien Domont, MBA
This Digital Transformation and IT Strategy Toolkit was created by ex-McKinsey, Deloitte and BCG Management Consultants, after more than 5,000 hours of work. It is considered the world's best & most comprehensive Digital Transformation and IT Strategy Toolkit. It includes all the Frameworks, Best Practices & Templates required to successfully undertake the Digital Transformation of your organization and define a robust IT Strategy.
Editable Toolkit to help you reuse our content: 700 Powerpoint slides | 35 Excel sheets | 84 minutes of Video training
This PowerPoint presentation is only a small preview of our Toolkits. For more details, visit www.domontconsulting.com
RMD24 | Retail media: hoe zet je dit in als je geen AH of Unilever bent? Heid...BBPMedia1
Grote partijen zijn al een tijdje onderweg met retail media. Ondertussen worden in dit domein ook de kansen zichtbaar voor andere spelers in de markt. Maar met die kansen ontstaan ook vragen: Zelf retail media worden of erop adverteren? In welke fase van de funnel past het en hoe integreer je het in een mediaplan? Wat is nu precies het verschil met marketplaces en Programmatic ads? In dit half uur beslechten we de dilemma's en krijg je antwoorden op wanneer het voor jou tijd is om de volgende stap te zetten.
2. PREFACE
The National Statistical Office has been producing Statistical Yearbook of Mongolia,
showing social and economic indicators of Mongolia along with their respective time series,
since 1960. Due to the development of the socio-economic situation of Mongolia, the framework
of indicators for the yearbook has been expanded.
Steps to harmonize statistical indicators and methodologies with international common
standards are being undertaken.
In order to make the yearbook accessible and available to the users, there are
explanations of methodologies and technical terms on core indicators for each section. In addition,
some additional notes are included in the yearbook.
Human development indexes, some new indicators from child development survey and
employment survey, Input and Output Table and Supply and Use Table complied for 2005, and
on financial market are also included in the yearbook of 2007.
Apart from the Statistical Yearbook, a number of statistical publications and reports of
specialized surveys, namely Mongolia in the Market Economy for 1998-2002, Population of
Mongolia in the 20th century, Monthly Bulletins and Statistical Reviews on Mongolian Social
and Economic situation, 2002-2003 Reports on Labour Force Survey and Child Labour Survey,
Household Income and Expenditure Survey, and Living Standard Measurement Survey, 2004
Disability Registration – a sample survey, 2003 Reproductive Health Survey, 2006 Participatory
Poverty Assessment in Mongolia, 2006 Report on Establishment Census, 2005 Child
Development Survey, and 2007 Report on Internal Migration of Mongolia have been published.
There is a publication published by using results and findings from the livestock census,
the core source for identifying scope of production of livestock which is one of major economic
industries of Mongolia. Moreover, it is pleasant to mention that all users are provided access to
their interested information through monthly bulletins and statistical yearbooks, and our website
containing other main indicators of the economics.
We would welcome any comments and recommendations regarding the statistical
yearbook and any requests for detailed information of interest on relevant statistical surveys
and data.
P.BYAMBATSEREN
CHAIRMAN OF THE NATIONAL STATISTICAL OFFICE OF MONGOLIA
4
11. CONTENTS
Preface 3
Contents 6
Overview 47
MAIN INDICATORS 72
SECTION 1. ADMINISTRATIVE UNITS AND TERRITORY 72
1.1 Administrative units, by regions, aimags and the Capital 73
1.2 Distance between the cities, km 74
1.3 Mountains 75
1.4 Rivers 75
1.5 Lakes 75
SECTION 2. ELECTION 77
2.1 Popular vote cast Mongolian president 78
2.2 Election of state great hural and local citizens' hural 79
2.3 Members of state great hural, by age group 80
2.4 Members of state great hural, by professions 80
2.5 Voters participation 80
SECTION 3. POPULATION 83
3.1 Resident population, by sex, urban and rural, at the end of the year 85
3.2 Resident population, by age group and sex, at the end of the year 85
3.3 Resident population, by regions, aimags and the Capital, at the end of the year 86
3.4 Urban and rural population percentage of resident population, by regions, aimags and the Capital, at 87
the end of the year 88
3.5 Number of households, by regions, aimags and the Capital, at the end of the year 89
3.6 Number of households, by regions, aimags and the Capital, urban and rural, at the end of the year 90
3.7 Number of orphan children, by regions, aimags and the Capital, at the end of the year 91
3.8 Number of half-orphan, by regions, aimags and the Capital, at the end of the year 92
3.9 Number of households with 4 and more children aged below 16, by regions, aimags and the Capital,
93
at the end of the year
3.10 Number of female-headed households, by regions, aimags and the Capital, at the end of the year 94
3.11 Single woman, with children aged below 16, by regions, aimags and the Capital, at the end of the
94
year
3.12 Births, deaths, marriages and divorces, at the end of the year 95
3.13 Births, deaths, marriages, divorces per 1000 population, at the end of the year 95
3.14 Birth rates, by age group, at the end of the year 96
3.15 Births, deaths, marriages, divorces and adoption, by regions, aimags and the Capital, in 2007 97
3.16 Births, deaths, marriages, divorces and adoptions, per 1000 population, by regions, aimags and the
98
Capital, in 2007
3.17 Life expectancy at birth, by regions, aimags and the Capital, at the end of the year 98
3.18 Life expectancy at birth, by sex, at the end of the year 99
3.19 Number of births, by sex, regions, aimags and the Capital, urban and rural, in 2007 99
3.20 Number of live births, by mother's age group, at the end of the year 100
3.21 Number of women who give births, by regions, aimags and the Capital, at the end of the year 100
3.22 Women who give births, by educational level, at the end of the year 101
3.23 Number of women who give births, by marital status, regions, aimags and the Capital, urban and
102
rural, in 2007
3.24 Crude birth rate, by regions, aimags and the Capital 102
3.25 Number of people died, by educational level, at the end of the year 103
3.26 Number of people died, by age group, at the end of the year 104
3.27 Number of people died, by sex, regions, aimag and the Capital, urban and rural, in 2007 105
14
12. 3.28 Crude death rate,by regions, aimag and the Capital 106
3.29 Age specific death rate, at the end of the year 106
3.30 Registered marriages, by sex and age group, at the end of the year 107
3.31 Divorce, by duration of marriage, at the end of the year 107
3.32 Adoption, by child age group, at the end of the year
SECTION 4. LABOUR FORCE 111
4.1 Employment, at the end of the year 112
4.2 Economically active population, by region, aimags and the Capital, at the end of the year 113
4.3 Employees, by divisions, at the end of the year 114
4.4 Employees, by region, aimags and the Capital, at the end of the year 115
4.5 Unemployment, by sex, educational level, regions, aimags and the Capital, at the end of the year 116
4.6 Unemployment rate, by regions, aimags and the Capital 122
4.7 Labour force status of the population aged 15 years and over 124
4.8 Employment of the population aged 15 years and above8 by some indicators 124
4.9 Number of Government employees of Mongolia, by classificattion of government service, 1 st of
125
January of selected years
4.10 Number of Government employees of Mongolia*, by regions, aimags and the Capital, 1 st of
125
January of selected years
4.11 Number of public administration Government employees of Mongolia*, by classification of officers,
126
1 st of January of selected years
4.12 Monthly average wages and salaries, by divisions 127
4.13 Monthly average wages and salaries, by type of legal status 128
4.14 Monthly average wages and salaries, by classification of occupation 128
4.15 Monthly average wages and salaries, by type ownership 129
SECTION 5. GROSS DOMESTIC PRODUCT 132
5.1 Gross domestic product, by divisions, at current prices 134
5.2 Gross domestic product, by divisions, at 2005 constant prices 135
5.3 Gross National Income 136
5.4 Annual change of gross domestic product, by divisions 136
5.5 Industrial composition of gross domestic product, at current prices 137
5.6 Private sector share in GDP, by divisions, at current prices 138
5.7 Composition of gross domestic product, by income approach, at current prices 138
5.8 Composition of GDP, by expenditure approach, at current prices 139
5.9 Gross domestic product, by region, aimags and the Capytal, by divisions, at current prices 140
5.10 Gross domestic product, by quarter, by divisions, at 2005 constant prices 141
5.11 Input-Output table, 2005, at basic prices (14x14 industries) 142
5.12 Supply table, 2005, at basic prices (14x14 industries) 144
5.13 Use table, 2005, at basic prices (14x14 industries) 146
SECTION 6. CONSUMER PRICE INDEX 149
6.1 Consumer price index of goods and service 150
6.2 Inflation rate, annual average, 2001-2007 150
6.3 Consumer price index of certain goods and services, by groups 151
6.4 Consumer price index of certain goods and services, monthly changes, by groups 152
6.5 Annual average prices of main goods and services, in Ulaanbaatar 153
6.6 Consumer price index goods and services, by groups, by aimags 155
6.7 Average price of main selected goods, by aimags 157
SECTION 7. MONEY, CREDIT, STOCK 161
7.1 Money supply 163
7.2 Foreign net reserves 163
7.3 Loans oustanding 163
7.4 Interest rate 164
7.5 Loans oustanding, by regions, aimags and the Capital city 165
7.6 Individial deposits outstanding, by regions, aimags and the Capital city 166
7.7 Non-performing loans outstanding, by regions aimags and the Capital, at the end of the year 167
7.8 Exchange rates 168
7.9 Main indicators of Stock market summary 169
7.10 30 leading companies in market capitalization in 2007 170
15
13. 7.11 30 companies with the most active traded stocks in 2007 171
7.12 Indicators of Trading stock 171
7.13 Trading of Government bond 172
7.14 Trading of company bond 172
7.15 Main indicators of insurance intitutions 173
7.16 Main indicators of insurance institutions 173
7.17 Main indicators of saving and credit cooperative 173
SECTION 8. BUDGET 175
8.1 Mongolian general government revenue, by classification of revenue, at current prices 176
8.2 Revenue of central government, by classification of revenue, at current prices 177
8.3 Local government revenue, by classification of revenue, at current prices 178
8.4 Mongolian general government expenditure, by classification of expenditure, at current prices 179
8.5 Expenditure of central government, by classification of expenditure, at current prices 180
8.6 Local government expenditure, by classification of expenditure, at current prices 181
8.7 Revenue of local government, by region, aimag and the Capital, at current prices 182
8.8 Expenditure of local government, by region, aimag and the Capital, at current prices 183
8.9 Grants from central government to local government, by region, aimag and the Capital city, at current
184
prices
8.10 Grants from local government to central government, by aimag and the Capital city, at current prices 184
8.11 Expenditure of general government, by portfolio of Ministers, at current prices 185
SECTION 9. INVESTMENT AND CONSTRUCTION 188
9.1 Investment, by technological composition, financial resources, at current prices 189
9.2 Total amount of construction and capital repair, maintenance, at current price 189
9.3 Structure of construction and capital repair, maintenance, by types 190
9.4 Given for exploitation buildings basic fund 190
9.5 Total amount of construction and capital repair done by domestic construction units, by regions,
191
aimag and the Capital, at current prices
9.6 Grouping of construction units 191
9.7 Price of building materials, by countries, quarterly average, annual average 192
SECTION 10. AGRICULTURE 195
10.1 Gross agricultural output 197
10.2 Output of main agricultural products 197
10.3 Main agricultural production per capita 198
10.4 Number of livestock & household animals 198
10.5 Number of livestock, by regions, aimags and the Capital and by type 199
10.6 Number of breeding stock, by regions, aimags and the Capital and by type 206
10.7 Highest number of livestock, by type of livestock and years 207
10.8 Number of freshbred, crossbred, thoroughbred and improved breed, livestock, by type 207
10.9 Rearing of young animals, by type 208
10.10 Losses of adult animals, by type 208
10.11 Total livestock for consumption, by type 209
10.12 Rank of first five aimags and soums by number of livestock, in 2007, by type oflivestock 210
10.13 Number of herder households, by regions, aimags and the Capital 212
10.14 Number of herdsmen, by regions, aimags and the Capital 213
10.15 Age composition of herdsmen 213
10.16 Grouping of households with households, by size of herd 214
10.17 Grouping of herder households, by size of herd, in 2007 214
10.18 Selected indicators of herdsmen households 215
10.19 Selected indicators of herdsmen households, by regions, aimags and the Capital, in 2007 215
10.20 Number of agricultural specialist, by type of profession 216
10.21 Number of agricultural machineries, by type 216
10.22 Number of livestock fence, capacity, by type 216
10.23 Number of wells, by type 216
10.24 Number of livestock covered by precaution activities from infectious diseases and expenditure 217
10.25 Number of livestock suffered from infectious and diseases and survived 217
10.26 Agricultural areas 218
10.27 Sown areas, by regions, aimags and the Capital, by type of plants 218
10.28 Total crops, by type of plants 223
16
14. 10.29 Yields of staple agricultural crops per hectar, by type of plants 223
10.30 Total crops, by regions, aimags and the Capital, by type of plants 224
10.31 Yields of cereals, potatoes per hectar, by regions, aimags and the Capital 228
10.32 Gross hay harvest and laying-in of fodder, by type 230
10.33 Fodder, by regions, aimags and the Capital, in terms of fodder unit 230
10.34 Fodder, by regions, aimags and the Capital, by type 231
SECTION 11. INDUSTRY 237
11.1 Gross industrial output, by divisions and subdivisions, at current prices 238
11.2 Composition of gross industrial output, by divisions and subdivisions 239
11.3 Gross industrial output, by employment size class, at current prices 240
11.4 Gross industrial output, by divisions and subdivisions, at constant prices of 2000 240
11.5 Sales of industrial products, by aimags and the Capital, at current prices 241
11.6 Output of selected industrial commodities 242
11.7 Some industrial production per capita 245
11.8 Value added per employee in industry, (Labour productivity), by divisions and subdivisions, at 2005
246
prices
11.9 Balance sheet of electricity 247
11.9 Balance sheet of coal 248
11.10 Balance of thermal energy 249
SECTION 12. TRANSPORTATION 251
12.1 Main indicators of transport, by types 252
12.2 Number of vehicles, by types 252
12.3 Number of vehicles, by region, aimags and the Capital 253
12.4 Main indicators of railway transportation 254
12.5 Main indicators of road transpotation 254
12.6 Main indicators of civil air transportation 255
12.7 Improved auto road, km 255
SECTION 13. COMMUNICATION 257
13.1 Main indicators of communication division 258
13.2 Communication and postal service indicators, by kind 259
13.3 Number of telephones lines, by regions, aimags and the Capital 259
SECTION 14. FOREIGN TRADE 263
14.1 Total turnover, by countries, at current prices 265
14.2 Exports, by countries, at current prices 266
14.3 Imports, by countries, at current prices 267
14.4 Exports and imports, by region, at current prices 268
14.5 Main export commodities 269
14.6 Main import commodities 270
14.7 Composition of Export, by groups of commodities 274
14.8 Composition of Import, by groups of commodities 275
14.9 Price indexes of Foreign Trade, by main groups of commodities 276
14.10 Indexes of Foreign Trade and terms of trade 276
14.11 Volume indexes of Foreign Trade, by main groups of commodities 277
14.12 Export and import, by some group of commodities, by SITC 277
14.13 Balance of payments 279
SECTION 15. TRADE, RESTAURANT AND HOTELS 281
15.1 Total sales and output of trade sector, at current price 282
15.2 Number of population per commercial unit, by regions, aimags and the Capital, at the end of the 282
15.3 Total output of restaurant and hotel sector, at current price 283
15.4 Total number of employees of hotel and restaurant sector, end of the year 283
SECTION 16. HOUSING, COMMUNITY SERVICE 285
16.1 Housing 286
16.2 Numbers of facilities for community services, by region, aimags and the Capital 287
17
15. SECTION 17. TOURISM 290
17.1 Number of inbound and outbound passengers, by immigration post 291
17.2 Number of inbound passengers, by purpose of visit, as of 2007 292
17.3 Number of inbound tourists through the border of mongolia, by country 292
17.4 Number of inbound and outbound foreign passengers through the border of Mongolia, by country 293
17.5 Arrivals of foreign passengers from abroad , by purpose of visit, geographical region, as of 2007 293
17.6 Outbound domestic passengers, by immigration posts, purpose of visit, as of 2007 294
17.7 Number of enterprises of tourism activity and employees, end of the year 294
SECTION 18. HOUSEHOLD INCOME AND EXPENDITURE AND LIVING STANDARD 297
18.1 Monthly average total and monetary income per household, at the current price 299
18.2 Composition of monthly average total and monetary income per household 299
18.3 Monthly average total expenditure per household, by urban and rural, at current price 300
18.4 Composition of monthly average expenditure per household 300
18.5 Monthly foodstuff consumption per adult equivalent, by urban and rural 301
18.6 Calorie and composition of daily foodstuff consumption per adult equivalent, by urban and rural 301
18.7 Minimum subsistance level of population, per capita a month, by regions 302
18.8 Poverty measures, by urban and rural, LSMS, HIES 302
18.9 Poverty measures, by urban, rural, location and region, HIES, 2006 302
18.10 Investments for the improvement of the health, education and infrastructure in rural areas in the
304
framework of "Sustainable livelihoods project", by regions and aimags
18.11 Investments for the pastural risk management the framework of "Sustainable livelihoods project",
308
by aimags
18.12 Loans provided by the micro finance development fund, with in framework of "Sustainable
310
livelihoods project", by regions and aimags
SECTION 19. EDUCATION, SCIENCE, CULTURE AND ARTS 312
19.1 Number of educational institutions, at the beginning of the academic year 313
19.2 Number of pupils and students in educational institutions, at the beginning of the academic year 313
19.3 Number of graduates in educational institutions, at the beginning of the academic year 314
19.4 Number of teachers in educational institutions, at the beginning of the academic year 314
19.5 Some indicators of general educational schools 315
19.6 Students and graduates of domestic higher educational institutions, by fields of education 316
19.7 Number of general educational schools, by regions, aimags and the Capital 317
19.8 Number of pupils in general educational schools, by regions, aimags and the Capital 318
19.9 Proportion of teachers in general educational schools, by regions, aimags and the Capital 319
19.10 Number of teachers in general educational schools, by regions, aimags and the Capital 320
19.11 Number of graduates of general educational schools, by regions, aimags and the Capital 321
19.12 Number of pupils enrolled in 1st grade of general educational schools, by regions, aimags and the
322
Capital
19.13 Number of dormitory pupils of general educational schools, by regions, aimags and the Capital 323
19.14 Number of pre-school institutions and children, at the beginning of the academic year 324
19.15 Number of pupils and students in educational institutions, per 1000 population 324
19.16 Gross enrolment ratio, by regions, aimags and the Capital , at the 2004-2005 academic year 325
19.17 Number of kindergartens and teacher in kindergartens, by regions, aimags and the Capital 326
19.18 Number of children in creches and kindergartens, by regions, aimags and the Capital 327
19.19 Expenditure of educational sector, at current prices 327
19.20 Main indicators of science and research sector 328
19.21 Full-time employees wnith scientific degree, at the end of the year 328
19.22 Number of research works, funded from central budget 328
19.23 Public libraries 328
19.24 Public libraries number, by regions, aimags and the Capital 329
19.25 Number of employees of state art and culture intitutions, by type, at the end of the year 329
19.26 Total seat number of public libraries, by regions, aimags and the Capital 330
19.27 Total number of ppermanent readars of public library, by regions, aimags and the Capital 331
19.28 Performance of professional arts organization, by regions, aimags and the Capital 332
19.29 Exhibit of museum, number of visitors, by regions, aimags and the Capital 333
19.30 Number of cultural centres, by regions, aimags and the Capital 334
18