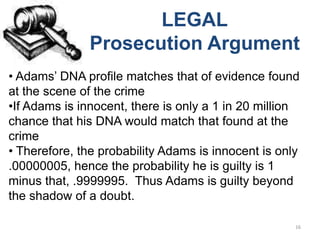
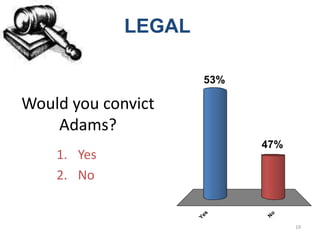
Based on the information provided, I would not convict Adams. While the DNA evidence places him in a very small group of potential suspects, there are reasonable doubts raised by the defense arguments regarding the accuracy of the victim's identification and Adams' alibi. Statistical evidence alone is not enough to determine guilt beyond a reasonable doubt in this case.
Homework #1SOCY 3115Spring 20Read the Syllabus and FAQ on ho.docxpooleavelina
Homework #1
SOCY 3115
Spring 20
Read the Syllabus and FAQ on how to do your homework before beginning the assignment!
To get consideration for full credit, you must:
· Follow directions;
· Show all work required to arrive at answer (statistical calculations often require multiple steps, so you need to write these down, not just skip to the final answer)
· Use appropriate statistical notation at all times (e.g. if you are calculating a population mean, begin with the equation for population mean)
· Use units in your answer, where appropriate (e.g. a mean time would be “6.5 hours” rather than just “6.5”)
Understanding the Structure of Data
1. For the following rectangular dataset:
Id
Highest degree
Works full-time
Annual income cat
1
Did not grad HS
Yes
Low
2
HS dip
Yes
Low
3
HS dip
No
Med
4
BA
No
Low
5
BA
Yes
Med
6
MA
Yes
High
7
HS dip
Yes
Med
a. What is the unit-of-analysis of the dataset?
b. How many variables are in the dataset?
c. How many observations/cases are in the dataset?
d. For eachvariable that is not named “id”:
i. What is the variable name?
ii. What is the level-of-measurement?
iii. What are the values for the variable?
iv. If you had to make a guess, what do you think the “question” was that was asked of the unit-of-analysis to get these data? (for example, if we had a continuous variable called “num_pets” the question might be “How many pets live in your household?”)
2. For the following rectangular dataset:
Id
num_bdrms
num_bthrms
sqft
Ranch
1
4
3
3200
Yes
2
2
1.5
2800
Yes
3
2
1
1200
Yes
4
3
2
1500
No
5
2
2
1100
No
a. What is the unit-of-analysis of the dataset?
b. How many variables are in the dataset?
c. How many observations/cases are in the dataset?
d. For each variable that is not named “id”:
i. What is the variable name?
ii. What is the level-of-measurement? Before answering, be sure to consult the slide called “Level of measurement – language to use”. Use the formal language!
iii. What are the values for the variable?
iv. If you had to make a guess, what do you think the “question” was that was asked of the unit-of-analysis to get these data? (for example, if we had a continuous variable called “num_pets” the question might be “How many pets live in your household?”)
3. For each of the following questions (1) construct a dataset with one variable and three observations (2) add data that could have theoretically been collected (just make up the actual responses to the question); and (3) indicate the level-of-measurement of the variable. I’ve done two examples for you.
Example#1:
What is your current age? (individual is the unit-of-analysis)
idage
1 25
2 32
3 61
The age variable is continuous/interval ratio.
Example#2:
What is the size of this hospital based on number of beds? (hospital is the unit-of-analysis)? Answers can be small (1-100 beds), medium (101-500 beds), large (501 beds to 1000 beds), extra large (1001+ beds)
idhosp_size
1 med
2 med
3 ext ...
The fundamental problem of Forensic StatisticsGiulia Cereda
When using Y-chromosome DNA profiles, it often happens that a DNA profile found on a crime scene and matching the suspect’s profile does not appear in the relevant data-base. This creates a big challenge to the analyst who is required to supply a likelihood ratio (LR) or match-probability in order to quantify the evidential value of the match. Sensible estimation of the LR seems to rely on sensible estimation of the population frequency of this previously unseen haplotype.
There are three existing proposals of quite different nature: Roewer et al. (2000), based on Bayesian estimation of the haplotype frequency with a Beta prior; Brenner (2010), based on the number of singletons observed in the database; and Andersen et al. (2013) using a mixture of independent discrete Laplace distributions as a parametric approximation of the distribution of allelic frequencies.
We add two new methods. One is similar to Brenner’s, and like Brenner’s is strongly related to the Good-Turing estimator. A second method is based on Anevski, Gill and Zohren’s (arXiv.org/math.ST:1312.1200) study of a non-parametric maximum-likelihood estimator. It is somehow intermediate between the parametric approach of Andersen and non-parametric methods based on Good-Turing estimators. We believe that it avoids the disadvantages of those while moreover providing a supplementary means of evaluating their accuracy.
For all methods it is imperative to assess two more levels of uncertainty, beyond the uncertainty about which hypothesis is true given the evidence, which would hold if we knew everything about the population probability distribution. LR is a ratio of probabilities which are usually based on a model which is at best only a good approximation to the truth. Moreover we only estimate parameters of that model by fitting it to the data in our database.
DNA Guide - Tech Summary Mapping Genomes w GISDNA Compass
Genetic Testing, DNA Guide, Genome Mapping, Privacy, GIS, Personalized Medicine, Health IT, GIS, ESRI, Gene Patents, Big Data, Molecular Diagnostics, Alice Rathjen, Mike Hargreaves, Electronic Health Records, Next Generation Sequencing, Point of Care, iPAD, Mobile
Meetup slides by Dr. Ricardo Silva at UCL, presented at Lloyds Register on 20th October 2015.
http://www.meetup.com/London-Bayesian-network-Meetup-Group/events/224945904/
State of ICS and IoT Cyber Threat Landscape Report 2024 previewPrayukth K V
The IoT and OT threat landscape report has been prepared by the Threat Research Team at Sectrio using data from Sectrio, cyber threat intelligence farming facilities spread across over 85 cities around the world. In addition, Sectrio also runs AI-based advanced threat and payload engagement facilities that serve as sinks to attract and engage sophisticated threat actors, and newer malware including new variants and latent threats that are at an earlier stage of development.
The latest edition of the OT/ICS and IoT security Threat Landscape Report 2024 also covers:
State of global ICS asset and network exposure
Sectoral targets and attacks as well as the cost of ransom
Global APT activity, AI usage, actor and tactic profiles, and implications
Rise in volumes of AI-powered cyberattacks
Major cyber events in 2024
Malware and malicious payload trends
Cyberattack types and targets
Vulnerability exploit attempts on CVEs
Attacks on counties – USA
Expansion of bot farms – how, where, and why
In-depth analysis of the cyber threat landscape across North America, South America, Europe, APAC, and the Middle East
Why are attacks on smart factories rising?
Cyber risk predictions
Axis of attacks – Europe
Systemic attacks in the Middle East
Download the full report from here:
https://sectrio.com/resources/ot-threat-landscape-reports/sectrio-releases-ot-ics-and-iot-security-threat-landscape-report-2024/
Le nuove frontiere dell'AI nell'RPA con UiPath Autopilot™UiPathCommunity
In questo evento online gratuito, organizzato dalla Community Italiana di UiPath, potrai esplorare le nuove funzionalità di Autopilot, il tool che integra l'Intelligenza Artificiale nei processi di sviluppo e utilizzo delle Automazioni.
📕 Vedremo insieme alcuni esempi dell'utilizzo di Autopilot in diversi tool della Suite UiPath:
Autopilot per Studio Web
Autopilot per Studio
Autopilot per Apps
Clipboard AI
GenAI applicata alla Document Understanding
👨🏫👨💻 Speakers:
Stefano Negro, UiPath MVPx3, RPA Tech Lead @ BSP Consultant
Flavio Martinelli, UiPath MVP 2023, Technical Account Manager @UiPath
Andrei Tasca, RPA Solutions Team Lead @NTT Data
Essentials of Automations: Optimizing FME Workflows with ParametersSafe Software
Are you looking to streamline your workflows and boost your projects’ efficiency? Do you find yourself searching for ways to add flexibility and control over your FME workflows? If so, you’re in the right place.
Join us for an insightful dive into the world of FME parameters, a critical element in optimizing workflow efficiency. This webinar marks the beginning of our three-part “Essentials of Automation” series. This first webinar is designed to equip you with the knowledge and skills to utilize parameters effectively: enhancing the flexibility, maintainability, and user control of your FME projects.
Here’s what you’ll gain:
- Essentials of FME Parameters: Understand the pivotal role of parameters, including Reader/Writer, Transformer, User, and FME Flow categories. Discover how they are the key to unlocking automation and optimization within your workflows.
- Practical Applications in FME Form: Delve into key user parameter types including choice, connections, and file URLs. Allow users to control how a workflow runs, making your workflows more reusable. Learn to import values and deliver the best user experience for your workflows while enhancing accuracy.
- Optimization Strategies in FME Flow: Explore the creation and strategic deployment of parameters in FME Flow, including the use of deployment and geometry parameters, to maximize workflow efficiency.
- Pro Tips for Success: Gain insights on parameterizing connections and leveraging new features like Conditional Visibility for clarity and simplicity.
We’ll wrap up with a glimpse into future webinars, followed by a Q&A session to address your specific questions surrounding this topic.
Don’t miss this opportunity to elevate your FME expertise and drive your projects to new heights of efficiency.
Encryption in Microsoft 365 - ExpertsLive Netherlands 2024Albert Hoitingh
In this session I delve into the encryption technology used in Microsoft 365 and Microsoft Purview. Including the concepts of Customer Key and Double Key Encryption.
DevOps and Testing slides at DASA ConnectKari Kakkonen
My and Rik Marselis slides at 30.5.2024 DASA Connect conference. We discuss about what is testing, then what is agile testing and finally what is Testing in DevOps. Finally we had lovely workshop with the participants trying to find out different ways to think about quality and testing in different parts of the DevOps infinity loop.
Smart TV Buyer Insights Survey 2024 by 91mobiles.pdf91mobiles
91mobiles recently conducted a Smart TV Buyer Insights Survey in which we asked over 3,000 respondents about the TV they own, aspects they look at on a new TV, and their TV buying preferences.
UiPath Test Automation using UiPath Test Suite series, part 3DianaGray10
Welcome to UiPath Test Automation using UiPath Test Suite series part 3. In this session, we will cover desktop automation along with UI automation.
Topics covered:
UI automation Introduction,
UI automation Sample
Desktop automation flow
Pradeep Chinnala, Senior Consultant Automation Developer @WonderBotz and UiPath MVP
Deepak Rai, Automation Practice Lead, Boundaryless Group and UiPath MVP
Generative AI Deep Dive: Advancing from Proof of Concept to ProductionAggregage
Join Maher Hanafi, VP of Engineering at Betterworks, in this new session where he'll share a practical framework to transform Gen AI prototypes into impactful products! He'll delve into the complexities of data collection and management, model selection and optimization, and ensuring security, scalability, and responsible use.
The Art of the Pitch: WordPress Relationships and SalesLaura Byrne
Clients don’t know what they don’t know. What web solutions are right for them? How does WordPress come into the picture? How do you make sure you understand scope and timeline? What do you do if sometime changes?
All these questions and more will be explored as we talk about matching clients’ needs with what your agency offers without pulling teeth or pulling your hair out. Practical tips, and strategies for successful relationship building that leads to closing the deal.
PHP Frameworks: I want to break free (IPC Berlin 2024)Ralf Eggert
In this presentation, we examine the challenges and limitations of relying too heavily on PHP frameworks in web development. We discuss the history of PHP and its frameworks to understand how this dependence has evolved. The focus will be on providing concrete tips and strategies to reduce reliance on these frameworks, based on real-world examples and practical considerations. The goal is to equip developers with the skills and knowledge to create more flexible and future-proof web applications. We'll explore the importance of maintaining autonomy in a rapidly changing tech landscape and how to make informed decisions in PHP development.
This talk is aimed at encouraging a more independent approach to using PHP frameworks, moving towards a more flexible and future-proof approach to PHP development.
SAP Sapphire 2024 - ASUG301 building better apps with SAP Fiori.pdfPeter Spielvogel
Building better applications for business users with SAP Fiori.
• What is SAP Fiori and why it matters to you
• How a better user experience drives measurable business benefits
• How to get started with SAP Fiori today
• How SAP Fiori elements accelerates application development
• How SAP Build Code includes SAP Fiori tools and other generative artificial intelligence capabilities
• How SAP Fiori paves the way for using AI in SAP apps
Dev Dives: Train smarter, not harder – active learning and UiPath LLMs for do...UiPathCommunity
💥 Speed, accuracy, and scaling – discover the superpowers of GenAI in action with UiPath Document Understanding and Communications Mining™:
See how to accelerate model training and optimize model performance with active learning
Learn about the latest enhancements to out-of-the-box document processing – with little to no training required
Get an exclusive demo of the new family of UiPath LLMs – GenAI models specialized for processing different types of documents and messages
This is a hands-on session specifically designed for automation developers and AI enthusiasts seeking to enhance their knowledge in leveraging the latest intelligent document processing capabilities offered by UiPath.
Speakers:
👨🏫 Andras Palfi, Senior Product Manager, UiPath
👩🏫 Lenka Dulovicova, Product Program Manager, UiPath
UiPath Test Automation using UiPath Test Suite series, part 4DianaGray10
Welcome to UiPath Test Automation using UiPath Test Suite series part 4. In this session, we will cover Test Manager overview along with SAP heatmap.
The UiPath Test Manager overview with SAP heatmap webinar offers a concise yet comprehensive exploration of the role of a Test Manager within SAP environments, coupled with the utilization of heatmaps for effective testing strategies.
Participants will gain insights into the responsibilities, challenges, and best practices associated with test management in SAP projects. Additionally, the webinar delves into the significance of heatmaps as a visual aid for identifying testing priorities, areas of risk, and resource allocation within SAP landscapes. Through this session, attendees can expect to enhance their understanding of test management principles while learning practical approaches to optimize testing processes in SAP environments using heatmap visualization techniques
What will you get from this session?
1. Insights into SAP testing best practices
2. Heatmap utilization for testing
3. Optimization of testing processes
4. Demo
Topics covered:
Execution from the test manager
Orchestrator execution result
Defect reporting
SAP heatmap example with demo
Speaker:
Deepak Rai, Automation Practice Lead, Boundaryless Group and UiPath MVP
GDG Cloud Southlake #33: Boule & Rebala: Effective AppSec in SDLC using Deplo...James Anderson
Effective Application Security in Software Delivery lifecycle using Deployment Firewall and DBOM
The modern software delivery process (or the CI/CD process) includes many tools, distributed teams, open-source code, and cloud platforms. Constant focus on speed to release software to market, along with the traditional slow and manual security checks has caused gaps in continuous security as an important piece in the software supply chain. Today organizations feel more susceptible to external and internal cyber threats due to the vast attack surface in their applications supply chain and the lack of end-to-end governance and risk management.
The software team must secure its software delivery process to avoid vulnerability and security breaches. This needs to be achieved with existing tool chains and without extensive rework of the delivery processes. This talk will present strategies and techniques for providing visibility into the true risk of the existing vulnerabilities, preventing the introduction of security issues in the software, resolving vulnerabilities in production environments quickly, and capturing the deployment bill of materials (DBOM).
Speakers:
Bob Boule
Robert Boule is a technology enthusiast with PASSION for technology and making things work along with a knack for helping others understand how things work. He comes with around 20 years of solution engineering experience in application security, software continuous delivery, and SaaS platforms. He is known for his dynamic presentations in CI/CD and application security integrated in software delivery lifecycle.
Gopinath Rebala
Gopinath Rebala is the CTO of OpsMx, where he has overall responsibility for the machine learning and data processing architectures for Secure Software Delivery. Gopi also has a strong connection with our customers, leading design and architecture for strategic implementations. Gopi is a frequent speaker and well-known leader in continuous delivery and integrating security into software delivery.
GDG Cloud Southlake #33: Boule & Rebala: Effective AppSec in SDLC using Deplo...
STATISTICS
1.
2. A type of mathematical analysis
involving the use of quantified
representations, models and
summaries for a given set of empirical
data or real world observations.
Statistical analysis involves the process
of collecting and analyzing data and then
summarizing the data into a numerical
form.
3. Statistics is a general term used to summarize a
process that an analyst, mathematician or
statistician can use to characterize a data set. If
the data set is based on a sample of a larger
population, then the analyst can extend
inferences onto the population based on the
statistical results from the sample.
Some statistical measures include regression
analysis, mean, kurtosis, skewness, analysis of
variance and variance.
4. Gottfried Achenwall used the word statistik at a German University in 1749 which
means that political science of different countries. In 1771 W. Hooper
(Englishman) usedthe word statistics in his translation of Elements of Universal
Erudition written by Baron B.F Bieford, in his book statistics has been defined as
the science that teaches us what is the political arrangement of all the modern
states of the known world. There is a big gap between the old statistics and the
modern statistics, but old statistics also used as a part of the present statistics.
During the 18th century the English writer have used the word statistics in their
works, so statistics has developed gradually during last few centuries. A lot of work
has been done in the end of the nineteenth century.
At the beginning of the 20th century, William S Gosset was developed the
methods for decision making based on small set of data. During the 20th century
several statistician are active in developing new methods, theories and application
of statistics. Now these days the availability of electronics computers is certainly a
major factor in the modern development of statistics.
5. Types of Data:
Attribute:
Discrete data. Data values can only be integers. Counted data or
attribute data. Examples include:
How many of the products are defective?
How often are the machines repaired?
How many people are absent each day?
Variable:
Continuous data. Data values can be any real number.
Measured data.
Examples include:
How long is each item?
How long did it take to complete the task?
What is the weight of the product?
Length, volume, time
6. MEAN MEDIAN MODE
• The quotient of the • Denoting or • The mode in a list
sum of several relating to a value of numbers refers
quantities and their or quantity lying at to the list of
number; an the midpoint of a numbers that occur
average. frequency most frequently.
distribution of
observed values or
quantities
8. Grouped frequency distributions
Can be used when the range of values
in the data set is very large. The data
must be grouped into classes that are
more than one unit in width.
Examples - the life of boat batteries in
hours.
9. Ungrouped frequency distributions
Ungrouped frequency distributions - can be used
for data that can be enumerated and when the
range of values in the data set is not large.
Examples - number of miles your instructors
have to travel from home to campus, number of
girls in a 4-child family etc.
11. FINANCE
•What do you want to
learn from this data?
• How do you
summarize the data?
• How do you visualize
the signal behind the
noise?
11
12. MEDICAL
• How do you test whether a new drug is
effective?
• Ideally, we perform a controlled clinical trial, by
randomly assign one group of people to take the
drug, and another group to take a placebo.
• It needs to be double blinded.
• When such an experiment is not possible due to
practical or ethical issues, what can go wrong?
12
13. MEDICAL
Kidney stone treatment
C. R. Charig, D. R. Webb, S. R. Payne, O. E. Wickham (March 1986)
Br Med J (Clin Res Ed) 292 (6524): 879–882.
Treatment A Treatment B Treatment A Treatment B
78% 83% Small 93% 87%
(273/350) (289/350) Stone (81/87) (234/270)
Treatment B is better, right? Large 73% 69%
Stone (192/263) (55/80)
WRONG!
Simpson’s Paradox
13
14. LEGAL
• How is statistics an important part of our legal
system?
• How might we use a statistic or probability as
evidence in a trial?
• How are statistics often misinterpreted by
lawyers and juries?
14
15. LEGAL
You have just been selected for jury duty. In 1996 in
England, Denis Adams was suspect in a rape trial.
Listen closely to the details of the case and the
arguments presented before deciding your verdict.
(We have simplified the actual case/arguments for the
purpose of this illustration.)
15
16. LEGAL
Prosecution Argument
• Adams’ DNA profile matches that of evidence found
at the scene of the crime
•If Adams is innocent, there is only a 1 in 20 million
chance that his DNA would match that found at the
crime
• Therefore, the probability Adams is innocent is only
.00000005, hence the probability he is guilty is 1
minus that, .9999995. Thus Adams is guilty beyond
the shadow of a doubt.
16
17. LEGAL
Defense Argument
• If the odds of a DNA match for any person is
1/ 20,000,000, since there are 60 million people in
England, there are on average 3 other people with this
DNA type (in 1996).
•Since it is equally likely to be any of these others, the
probability of Adams’ guilt is 1/3 = .33, which is not
enough certainty to convict.
17
18. LEGAL
Defense Argument
• In an identity line up, victim failed to pick out Adams
• Victim describes an attacker in his 20’s
• Adams is 37
• Victim guessed Adams to be about 40
• Adams had an alibi for the night of the crime (he
spent the night with his girlfriend)
18
19. LEGAL
53%
Would you convict
Adams?
47%
1. Yes
2. No
s
o
Ye
N
19