Download as PDF, PPTX

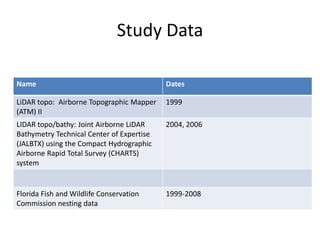

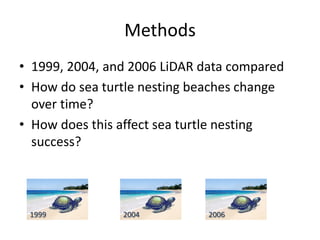
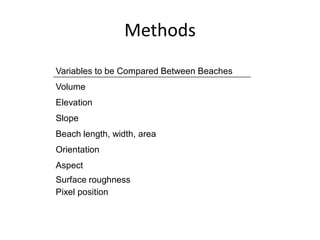
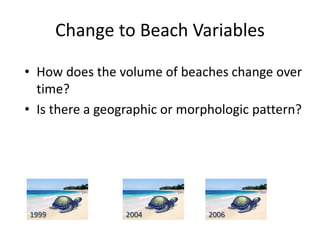
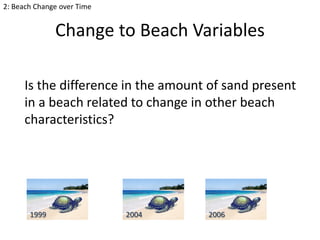
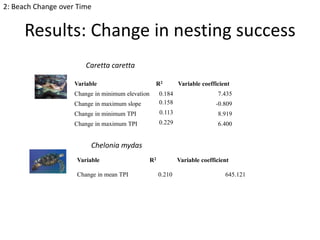

1) The study used LiDAR data from 1999, 2004, and 2006 to measure changes in morphology of sea turtle nesting beaches over time and examine the effects on nesting success. 2) Beach volume and characteristics like elevation, slope, and roughness varied individually between beaches and years with weak correlations between changes. 3) Changes in minimum elevation, maximum slope, and roughness were linked to some effects on loggerhead and green sea turtle nesting success but relationships were small. 4) Beach morphology changes did not wholly impact sea turtle nesting success and beaches behaved individually rather than following geographic or orientation patterns.


