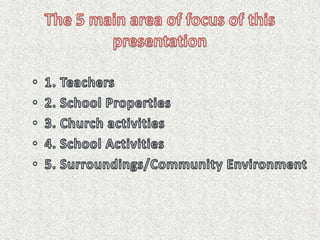
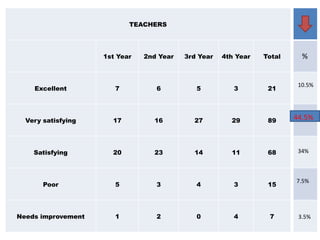
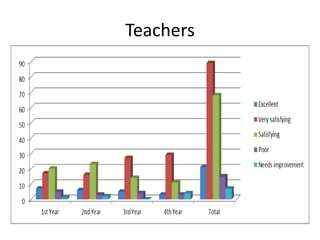
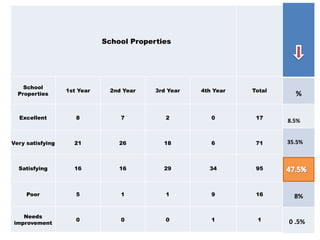
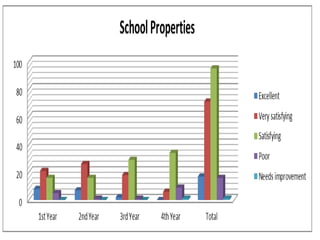
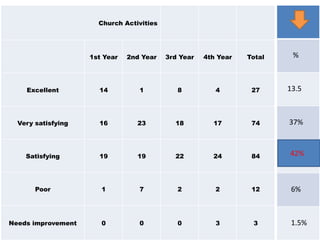
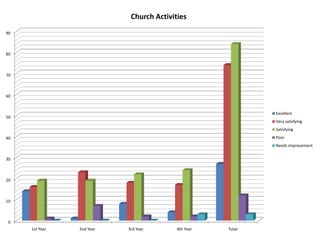
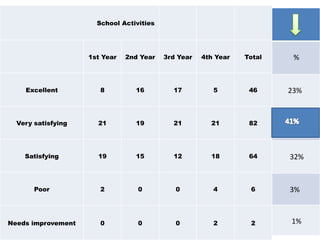
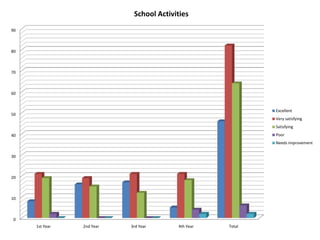
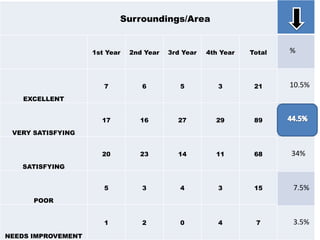
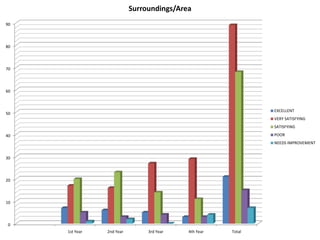
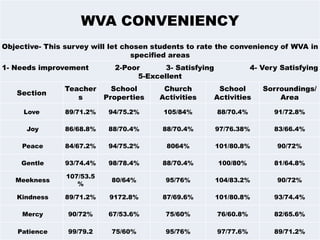
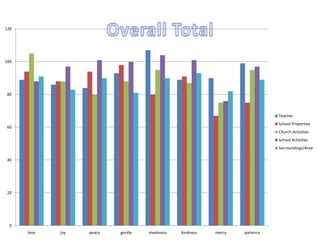
Objective- This survey will let chosen students to rate the
conveniences of WVA in specified areas
Prepared by:
Stephen JE Ventura
And Ainee louise
Jamolin
TEACHERS
1st Year 2nd Year 3rd Year 4th Year Total
Excellent 7 6 5 3 21
Very satisfying 17 16 27 29 89
Satisfying 20 23 14 11 68
Poor 5 3 4 3 15
Needs improvement 1 2 0 4 7
%
10.5%
34%
7.5%
3.5%
44.5%
Teachers
School Properties
School
Properties
1st Year 2nd Year 3rd Year 4th Year Total
Excellent 8 7 2 0 17
Very satisfying 21 26 18 6 71
Satisfying 16 16 29 34 95
Poor 5 1 1 9 16
Needs
improvement
0 0 0 1 1
%
8.5%
35.5%
8%
0 .5%
Church Activities
1st Year 2nd Year 3rd Year 4th Year Total
Excellent 14 1 8 4 27
Very satisfying 16 23 18 17 74
Satisfying 19 19 22 24 84
Poor 1 7 2 2 12
Needs improvement 0 0 0 3 3
%
13.5
37%
6%
1.5%
42%
0
10
20
30
40
50
60
70
80
90
1st Year 2nd Year 3rd Year 4th Year Total
Church Activities
Excellent
Very satisfying
Satisfying
Poor
Needs improvement
School Activities
1st Year 2nd Year 3rd Year 4th Year Total
Excellent 8 16 17 5 46
Very satisfying 21 19 21 21 82
Satisfying 19 15 12 18 64
Poor 2 0 0 4 6
Needs improvement 0 0 0 2 2
%
23%
32%
3%
1%
0
10
20
30
40
50
60
70
80
90
1st Year 2nd Year 3rd Year 4th Year Total
School Activities
Excellent
Very satisfying
Satisfying
Poor
Needs improvement
Surroundings/Area
1st Year 2nd Year 3rd Year 4th Year Total
EXCELLENT
7 6 5 3 21
VERY SATISFYING
17 16 27 29 89
SATISFYING
20 23 14 11 68
POOR
5 3 4 3 15
NEEDS IMPROVEMENT
1 2 0 4 7
%
10.5%
34%
7.5%
3.5%
0
10
20
30
40
50
60
70
80
90
1st Year 2nd Year 3rd Year 4th Year Total
Surroundings/Area
EXCELLENT
VERY SATISFYING
SATISFYING
POOR
NEEDS IMPROVEMENT
WVA CONVENIENCY
Objective- This survey will let chosen students to rate the conveniency of WVA in
specified areas
1- Needs improvement 2-Poor 3- Satisfying 4- Very Satisfying
5-Excellent
Section
Teacher
s
School
Properties
Church
Activities
School
Activities
Sorroundings/
Area
Love 89/71.2% 94/75.2% 105/84% 88/70.4% 91/72.8%
Joy 86/68.8% 88/70.4% 88/70.4% 97/76.38% 83/66.4%
Peace 84/67.2% 94/75.2% 8064% 101/80.8% 90/72%
Gentle 93/74.4% 98/78.4% 88/70.4% 100/80% 81/64.8%
Meekness
107/53.5
%
80/64% 95/76% 104/83.2% 90/72%
Kindness 89/71.2% 9172.8% 87/69.6% 101/80.8% 93/74.4%
Mercy 90/72% 67/53.6% 75/60% 76/60.8% 82/65.6%
Patience 99/79.2 75/60% 95/76% 97/77.6% 89/71.2%
0
20
40
60
80
100
120
love joy peace gentle meekness kindness mercy patience
Teacher
School Properties
Church Activities
School Activities
Sorroundings/Area
Conclusion:

Wva conveniency

  • 1.
    Objective- This surveywill let chosen students to rate the conveniences of WVA in specified areas Prepared by: Stephen JE Ventura And Ainee louise Jamolin
  • 5.
    TEACHERS 1st Year 2ndYear 3rd Year 4th Year Total Excellent 7 6 5 3 21 Very satisfying 17 16 27 29 89 Satisfying 20 23 14 11 68 Poor 5 3 4 3 15 Needs improvement 1 2 0 4 7 % 10.5% 34% 7.5% 3.5% 44.5%
  • 6.
  • 9.
    School Properties School Properties 1st Year2nd Year 3rd Year 4th Year Total Excellent 8 7 2 0 17 Very satisfying 21 26 18 6 71 Satisfying 16 16 29 34 95 Poor 5 1 1 9 16 Needs improvement 0 0 0 1 1 % 8.5% 35.5% 8% 0 .5%
  • 13.
    Church Activities 1st Year2nd Year 3rd Year 4th Year Total Excellent 14 1 8 4 27 Very satisfying 16 23 18 17 74 Satisfying 19 19 22 24 84 Poor 1 7 2 2 12 Needs improvement 0 0 0 3 3 % 13.5 37% 6% 1.5% 42%
  • 14.
    0 10 20 30 40 50 60 70 80 90 1st Year 2ndYear 3rd Year 4th Year Total Church Activities Excellent Very satisfying Satisfying Poor Needs improvement
  • 17.
    School Activities 1st Year2nd Year 3rd Year 4th Year Total Excellent 8 16 17 5 46 Very satisfying 21 19 21 21 82 Satisfying 19 15 12 18 64 Poor 2 0 0 4 6 Needs improvement 0 0 0 2 2 % 23% 32% 3% 1%
  • 18.
    0 10 20 30 40 50 60 70 80 90 1st Year 2ndYear 3rd Year 4th Year Total School Activities Excellent Very satisfying Satisfying Poor Needs improvement
  • 21.
    Surroundings/Area 1st Year 2ndYear 3rd Year 4th Year Total EXCELLENT 7 6 5 3 21 VERY SATISFYING 17 16 27 29 89 SATISFYING 20 23 14 11 68 POOR 5 3 4 3 15 NEEDS IMPROVEMENT 1 2 0 4 7 % 10.5% 34% 7.5% 3.5%
  • 22.
    0 10 20 30 40 50 60 70 80 90 1st Year 2ndYear 3rd Year 4th Year Total Surroundings/Area EXCELLENT VERY SATISFYING SATISFYING POOR NEEDS IMPROVEMENT
  • 24.
    WVA CONVENIENCY Objective- Thissurvey will let chosen students to rate the conveniency of WVA in specified areas 1- Needs improvement 2-Poor 3- Satisfying 4- Very Satisfying 5-Excellent Section Teacher s School Properties Church Activities School Activities Sorroundings/ Area Love 89/71.2% 94/75.2% 105/84% 88/70.4% 91/72.8% Joy 86/68.8% 88/70.4% 88/70.4% 97/76.38% 83/66.4% Peace 84/67.2% 94/75.2% 8064% 101/80.8% 90/72% Gentle 93/74.4% 98/78.4% 88/70.4% 100/80% 81/64.8% Meekness 107/53.5 % 80/64% 95/76% 104/83.2% 90/72% Kindness 89/71.2% 9172.8% 87/69.6% 101/80.8% 93/74.4% Mercy 90/72% 67/53.6% 75/60% 76/60.8% 82/65.6% Patience 99/79.2 75/60% 95/76% 97/77.6% 89/71.2%
  • 25.
    0 20 40 60 80 100 120 love joy peacegentle meekness kindness mercy patience Teacher School Properties Church Activities School Activities Sorroundings/Area
  • 26.