Download to read offline
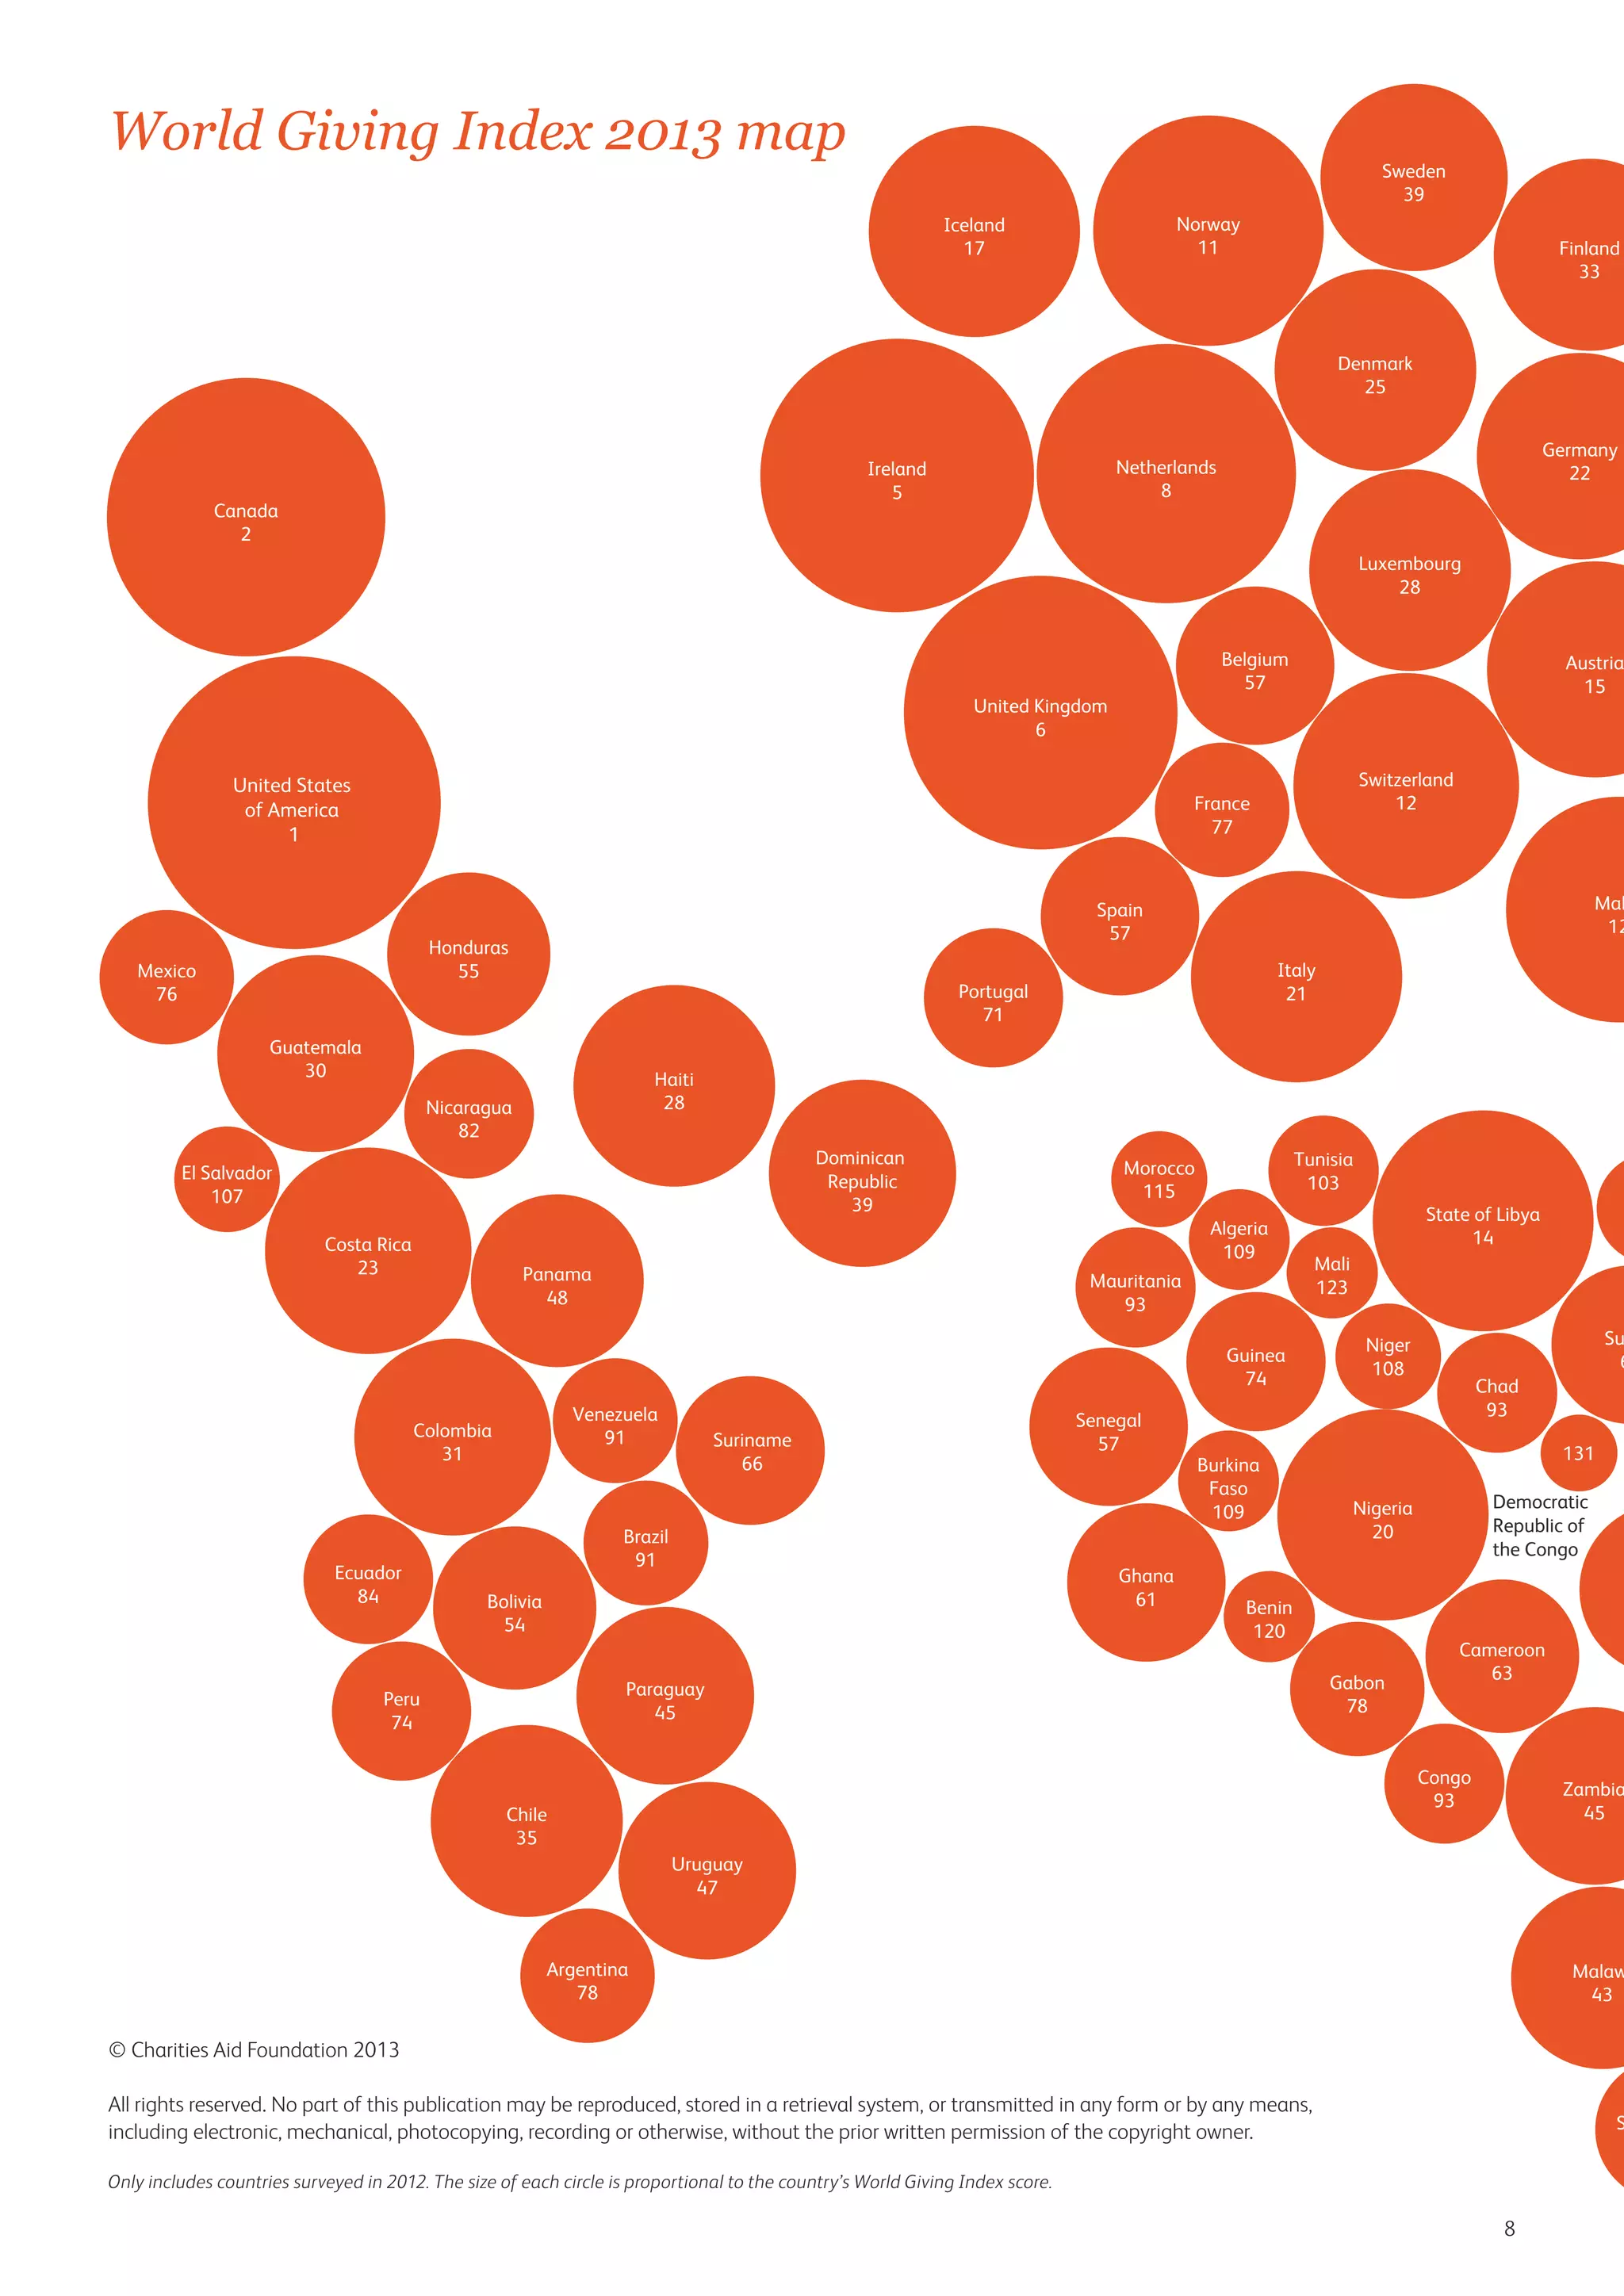
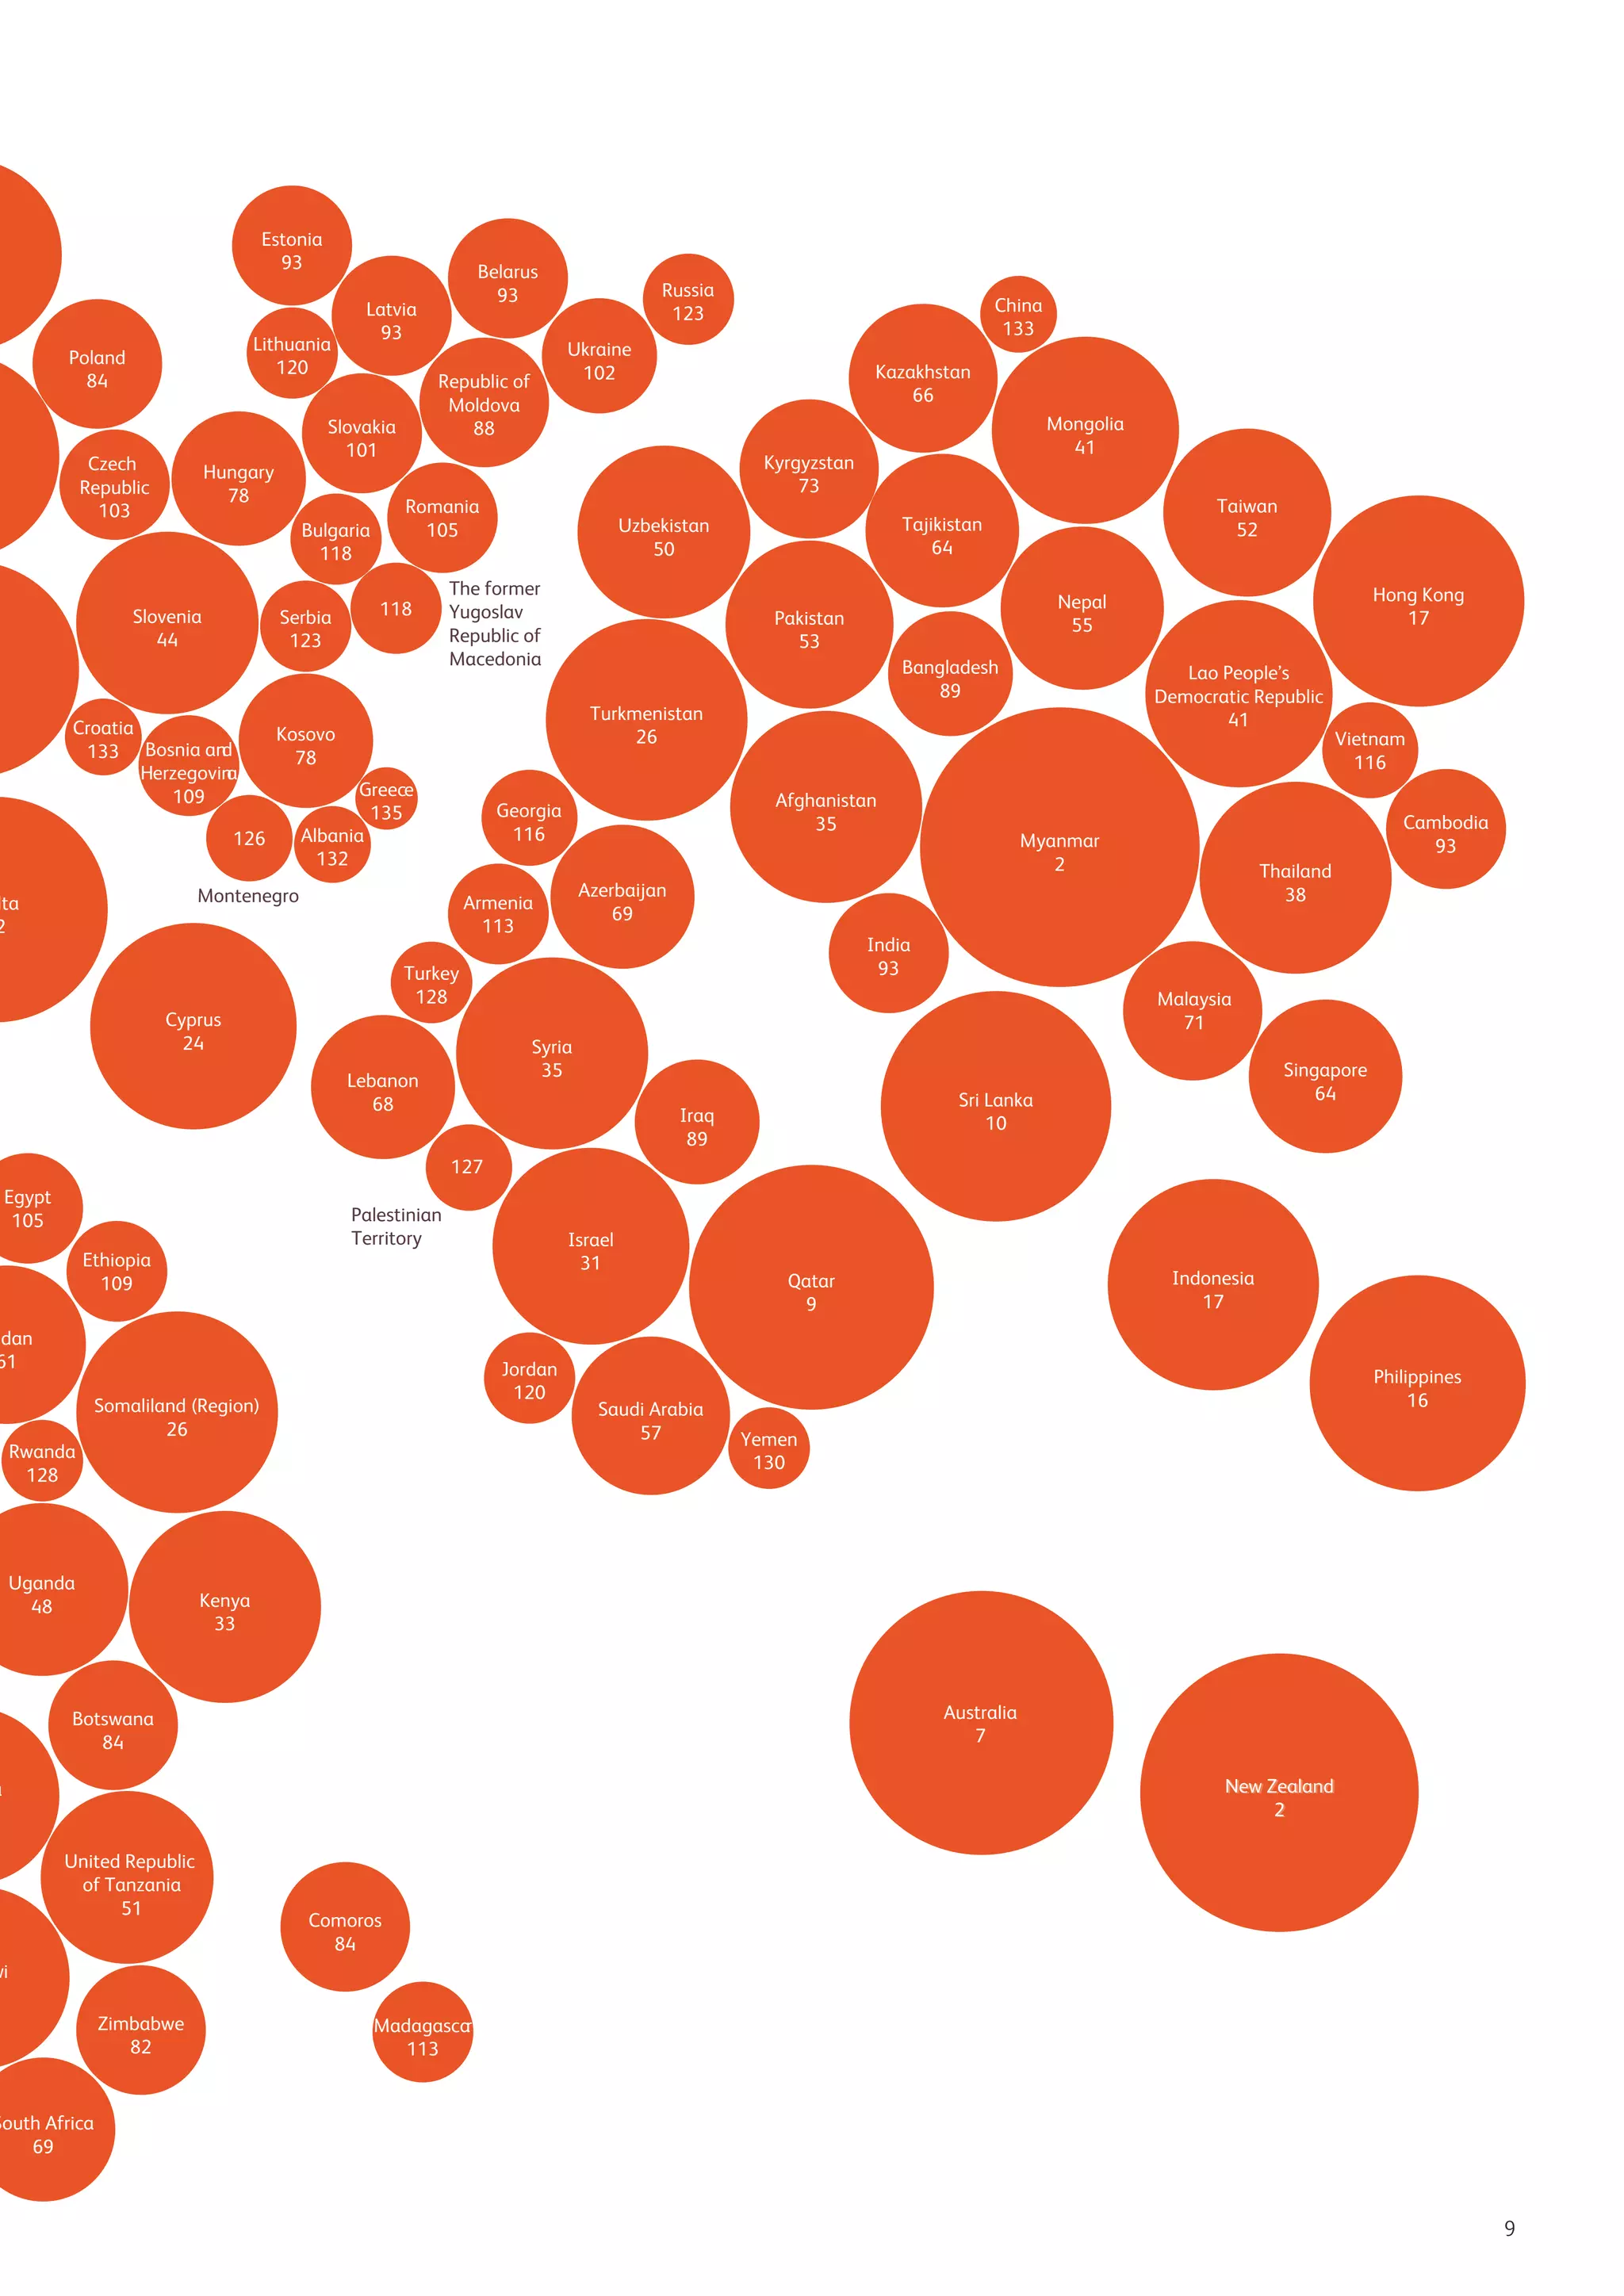
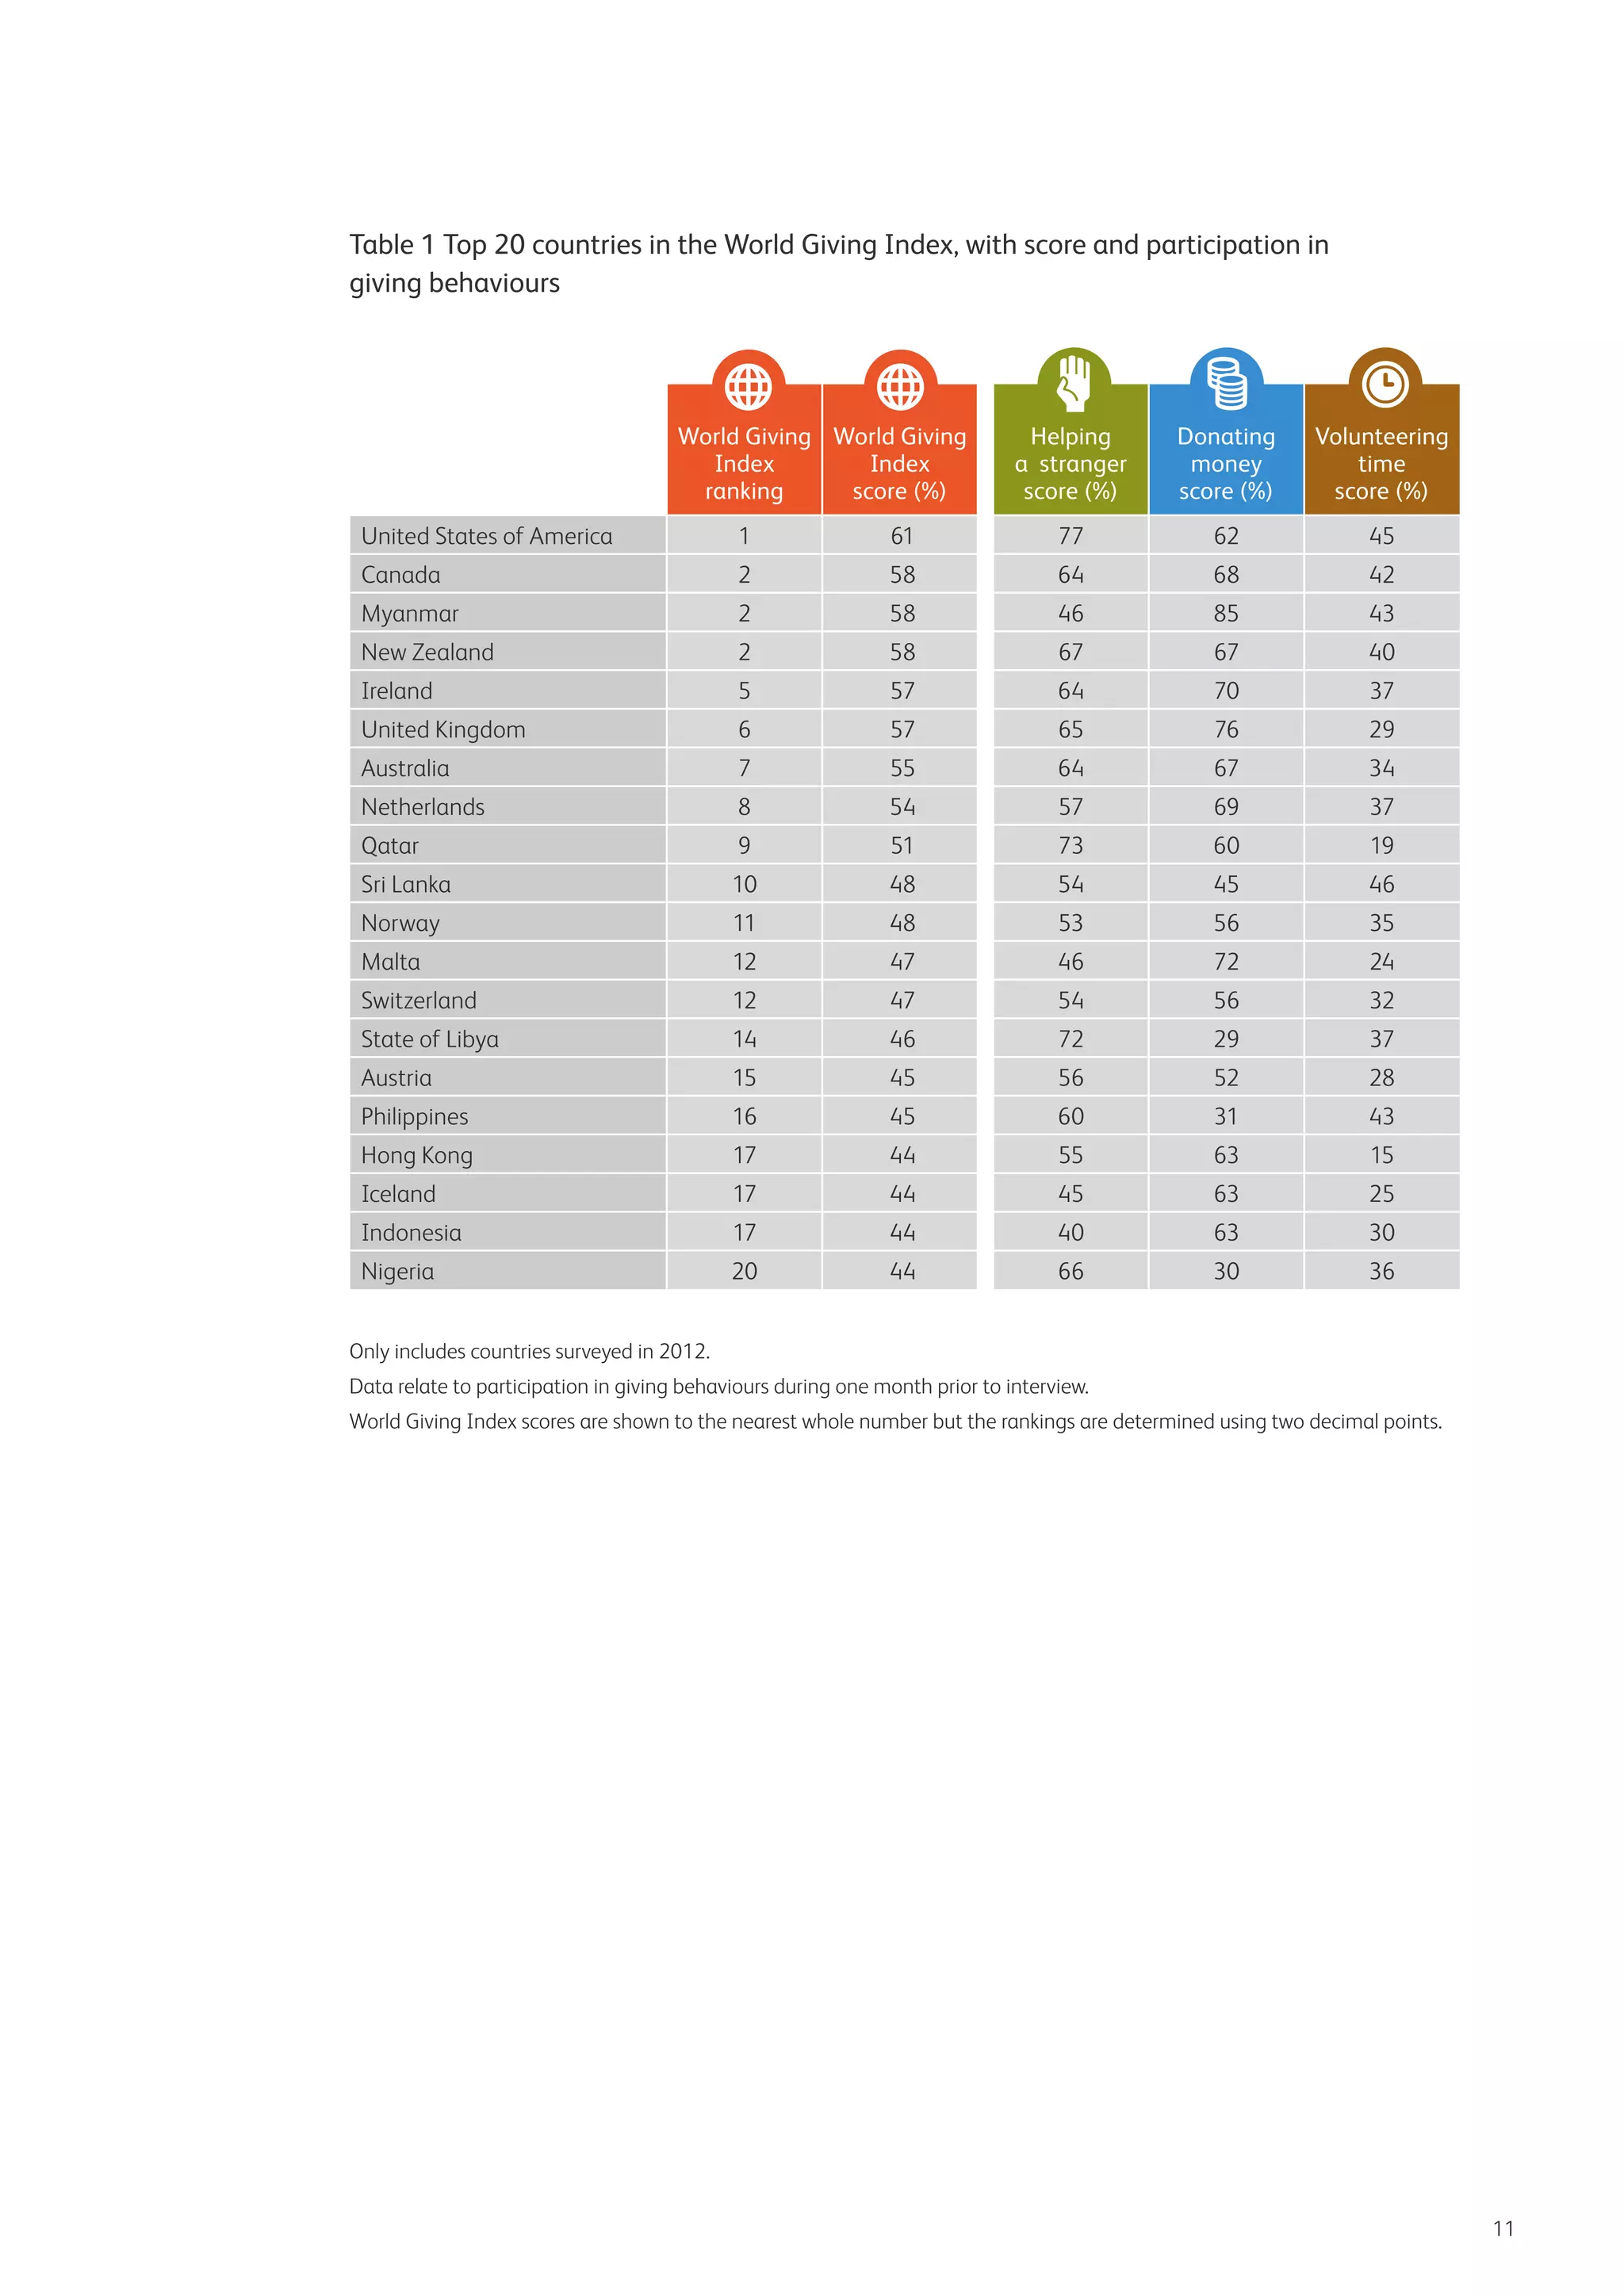

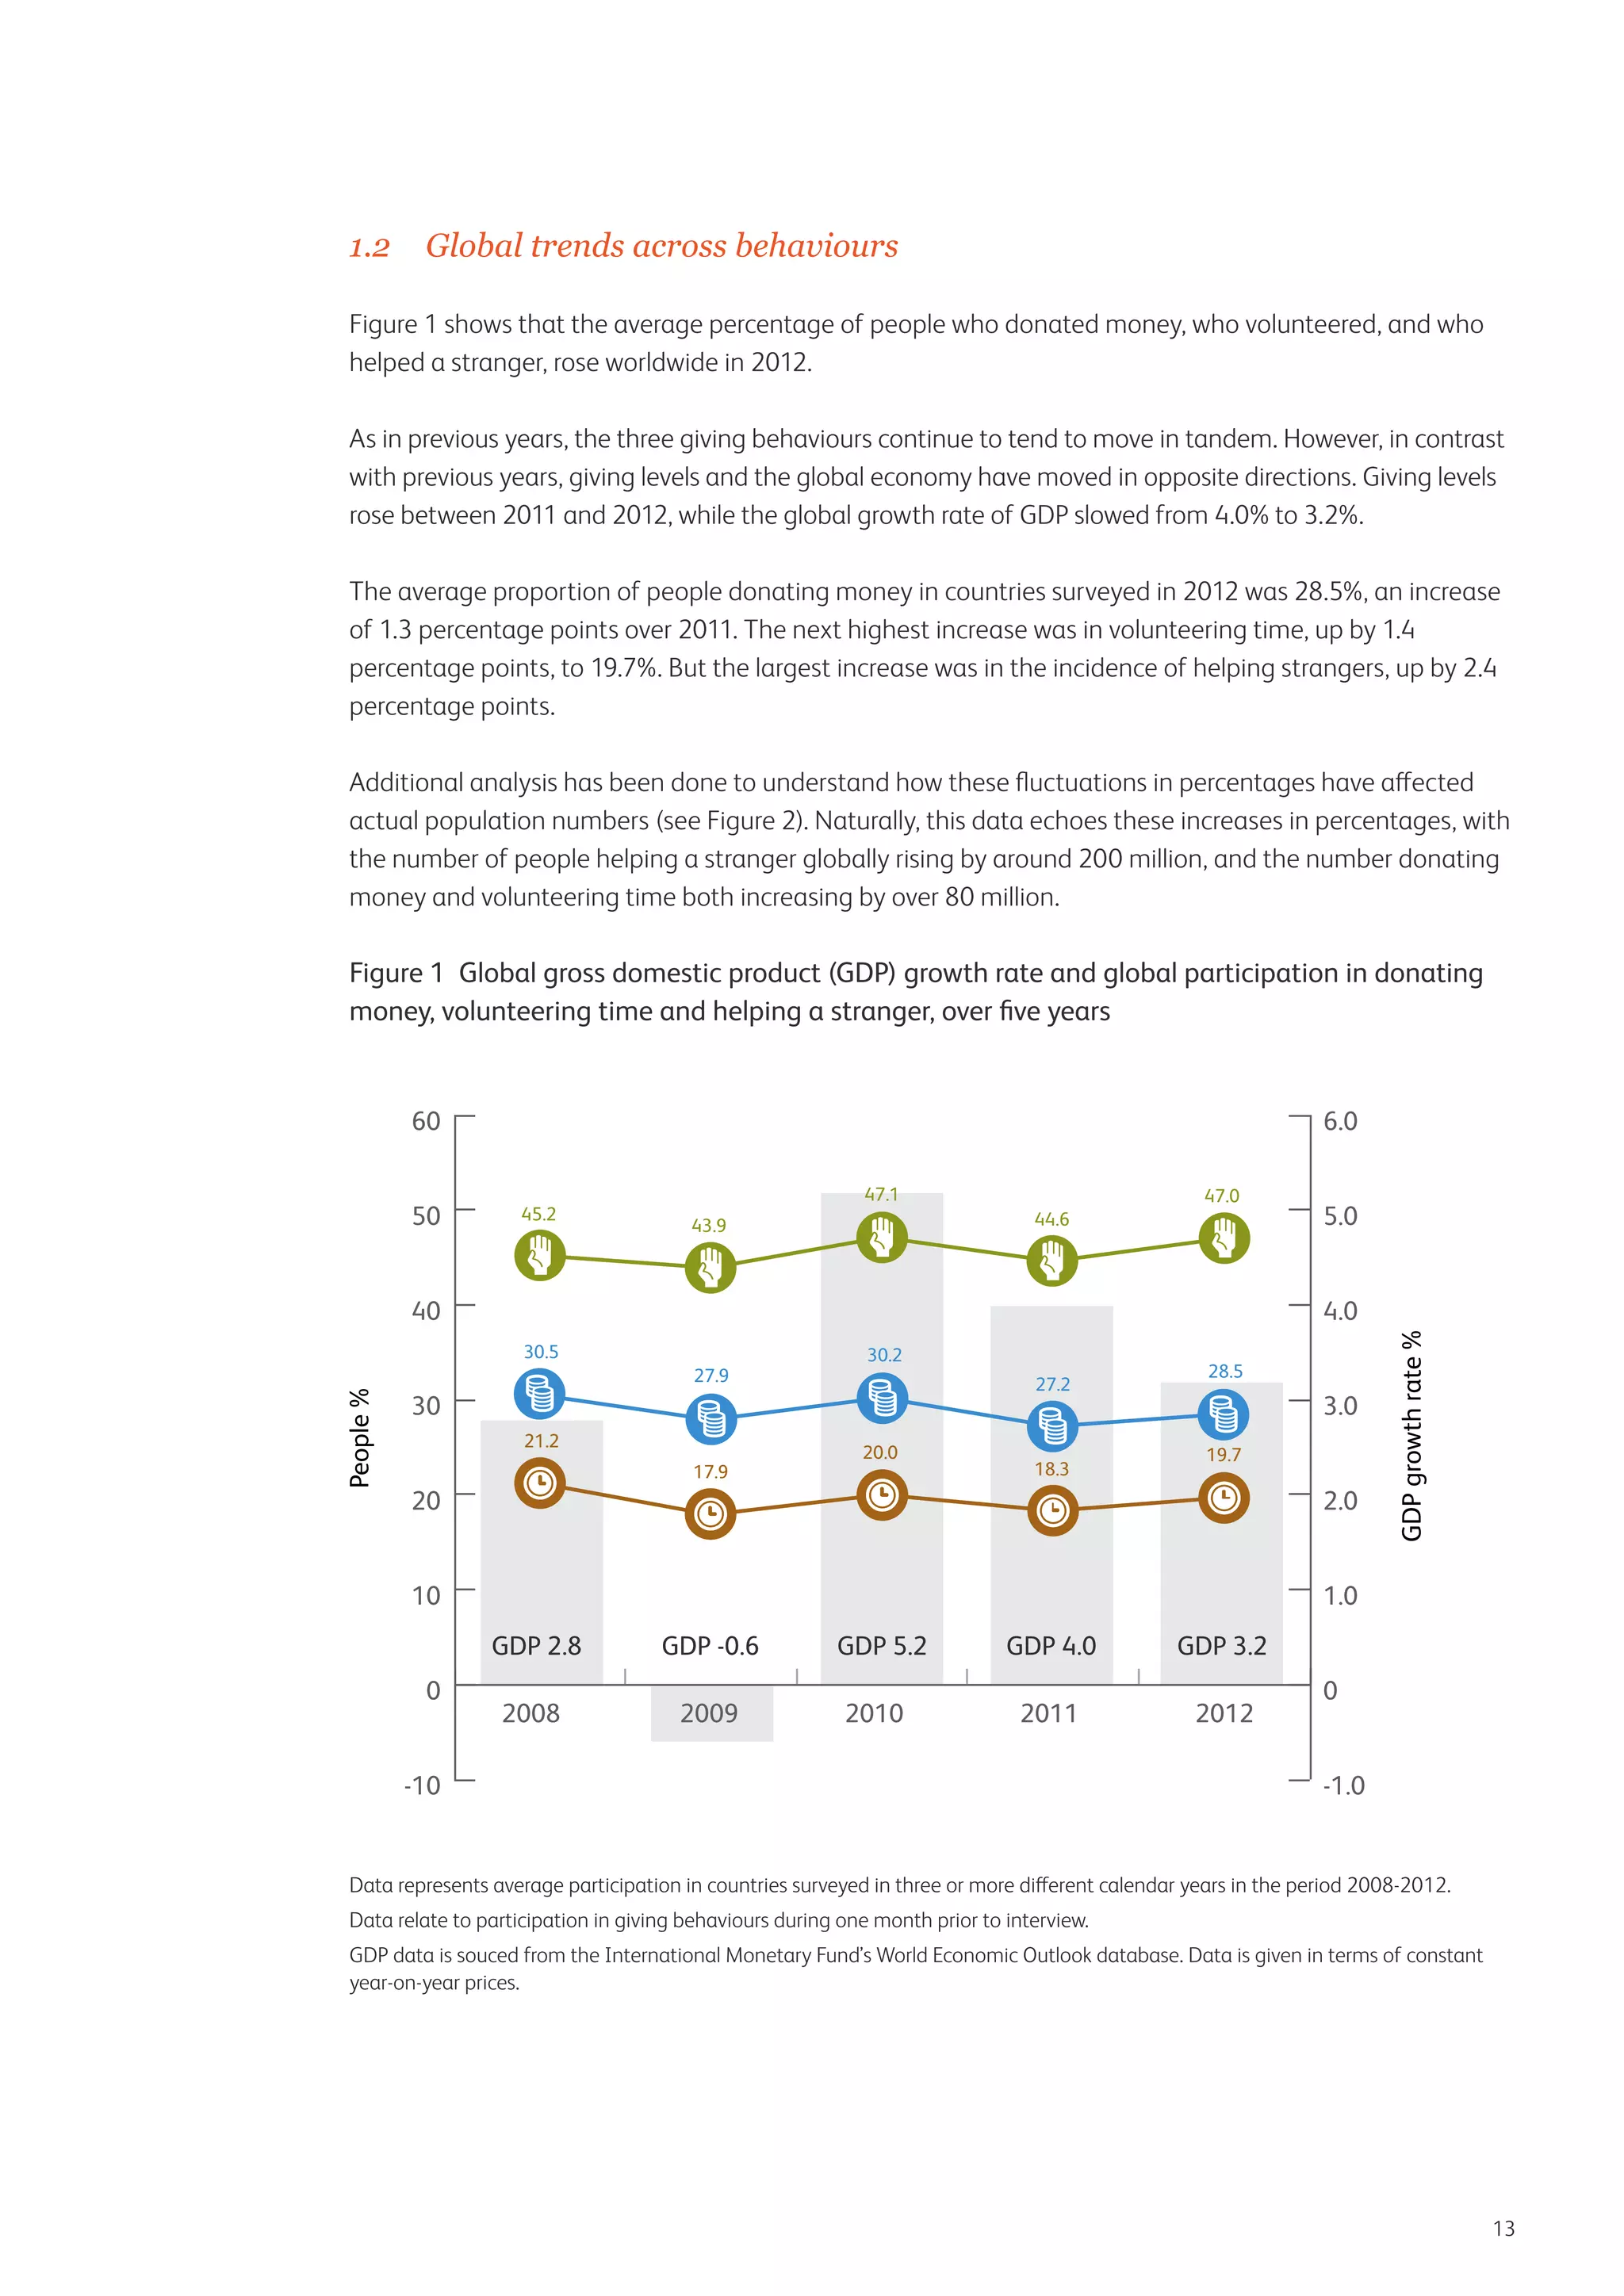


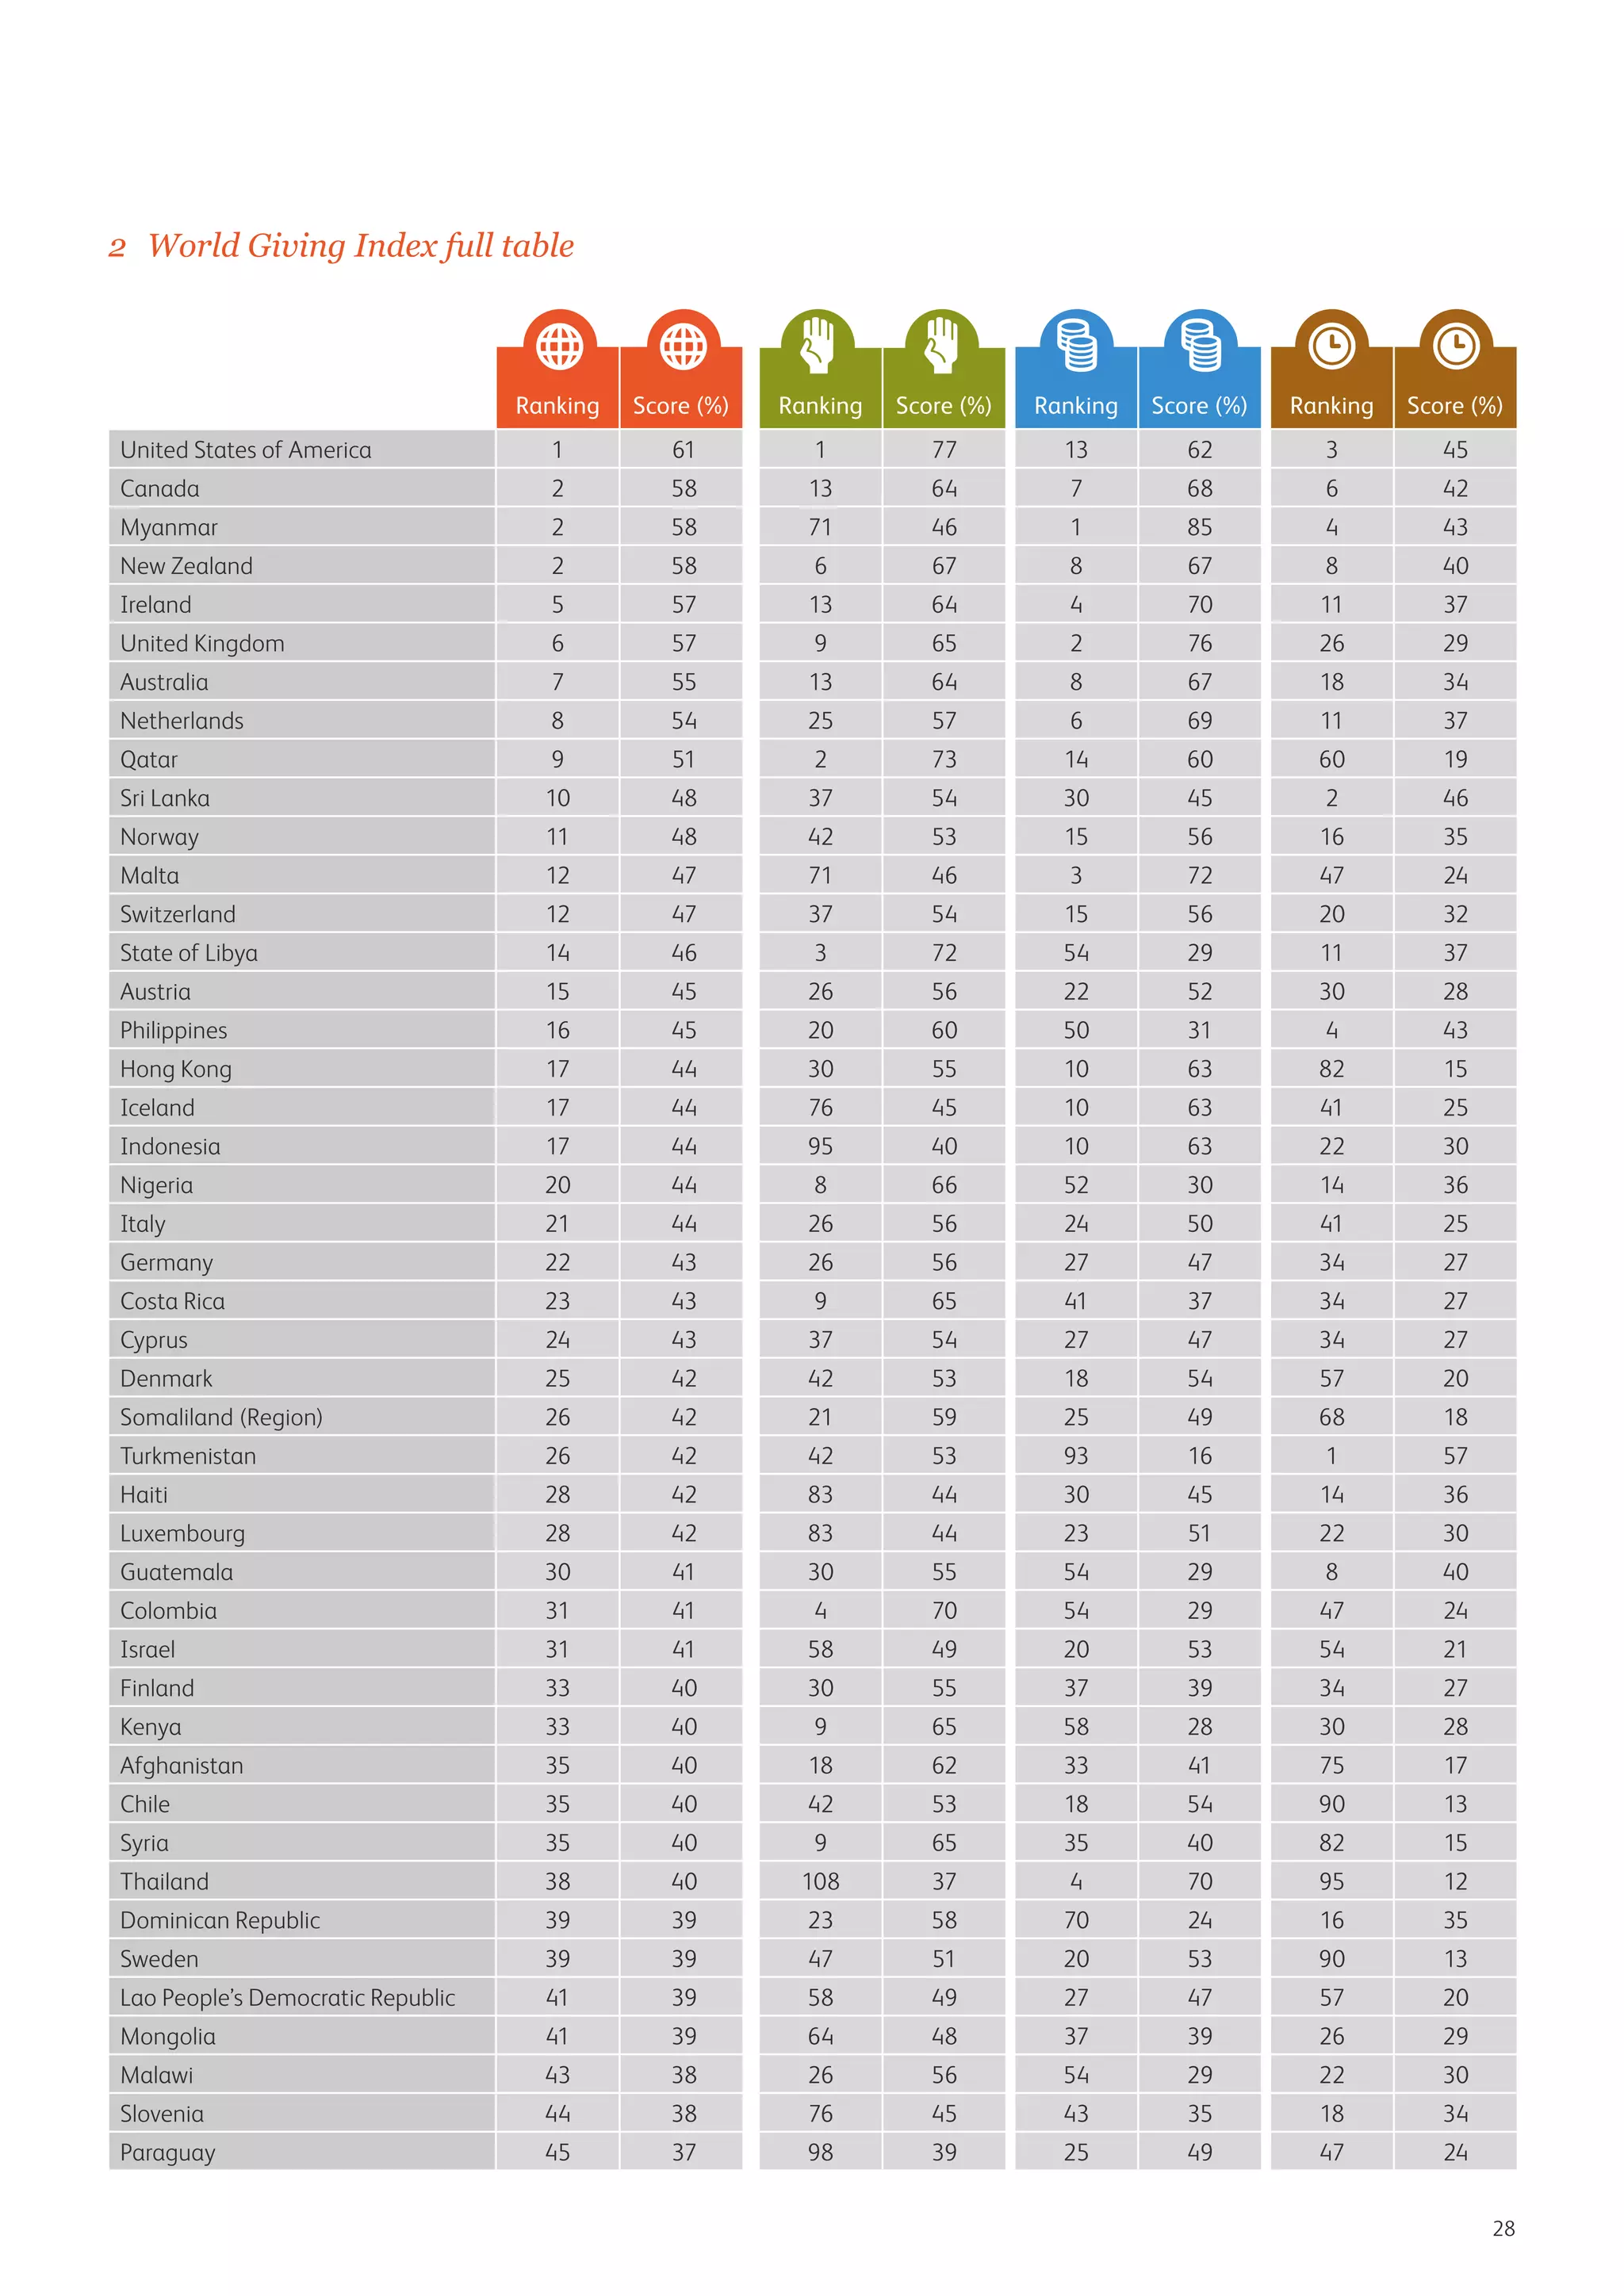
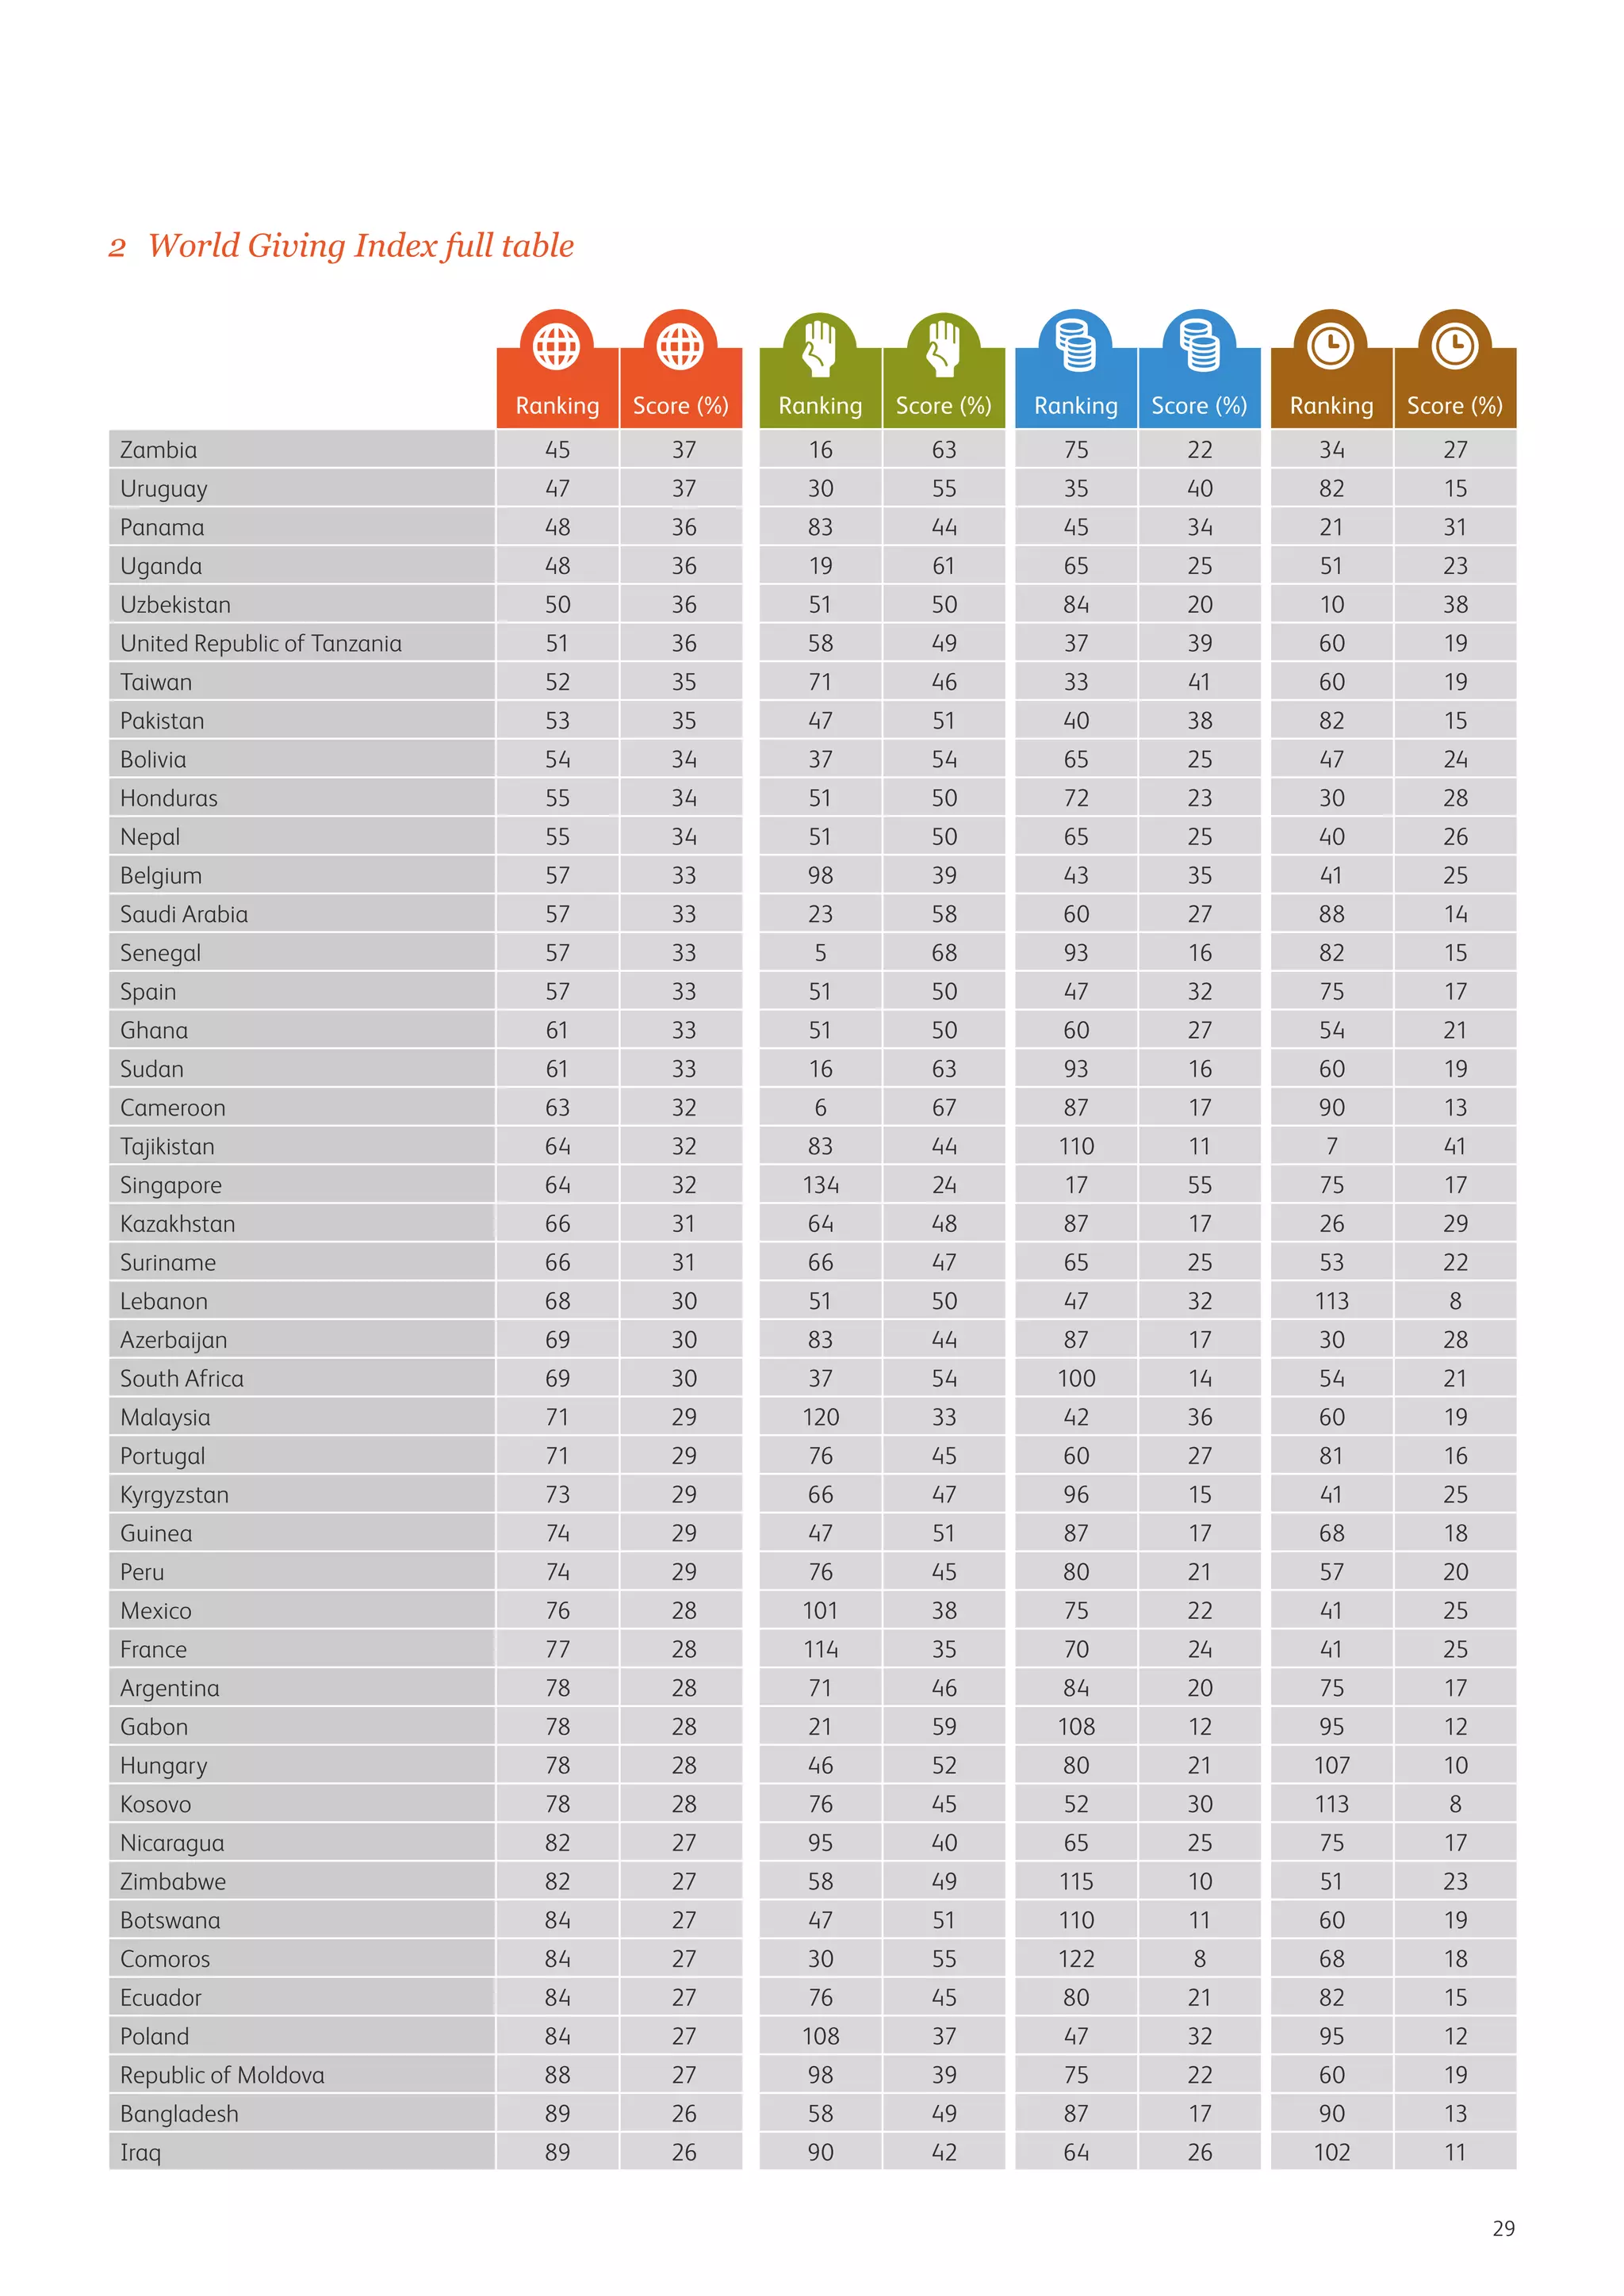

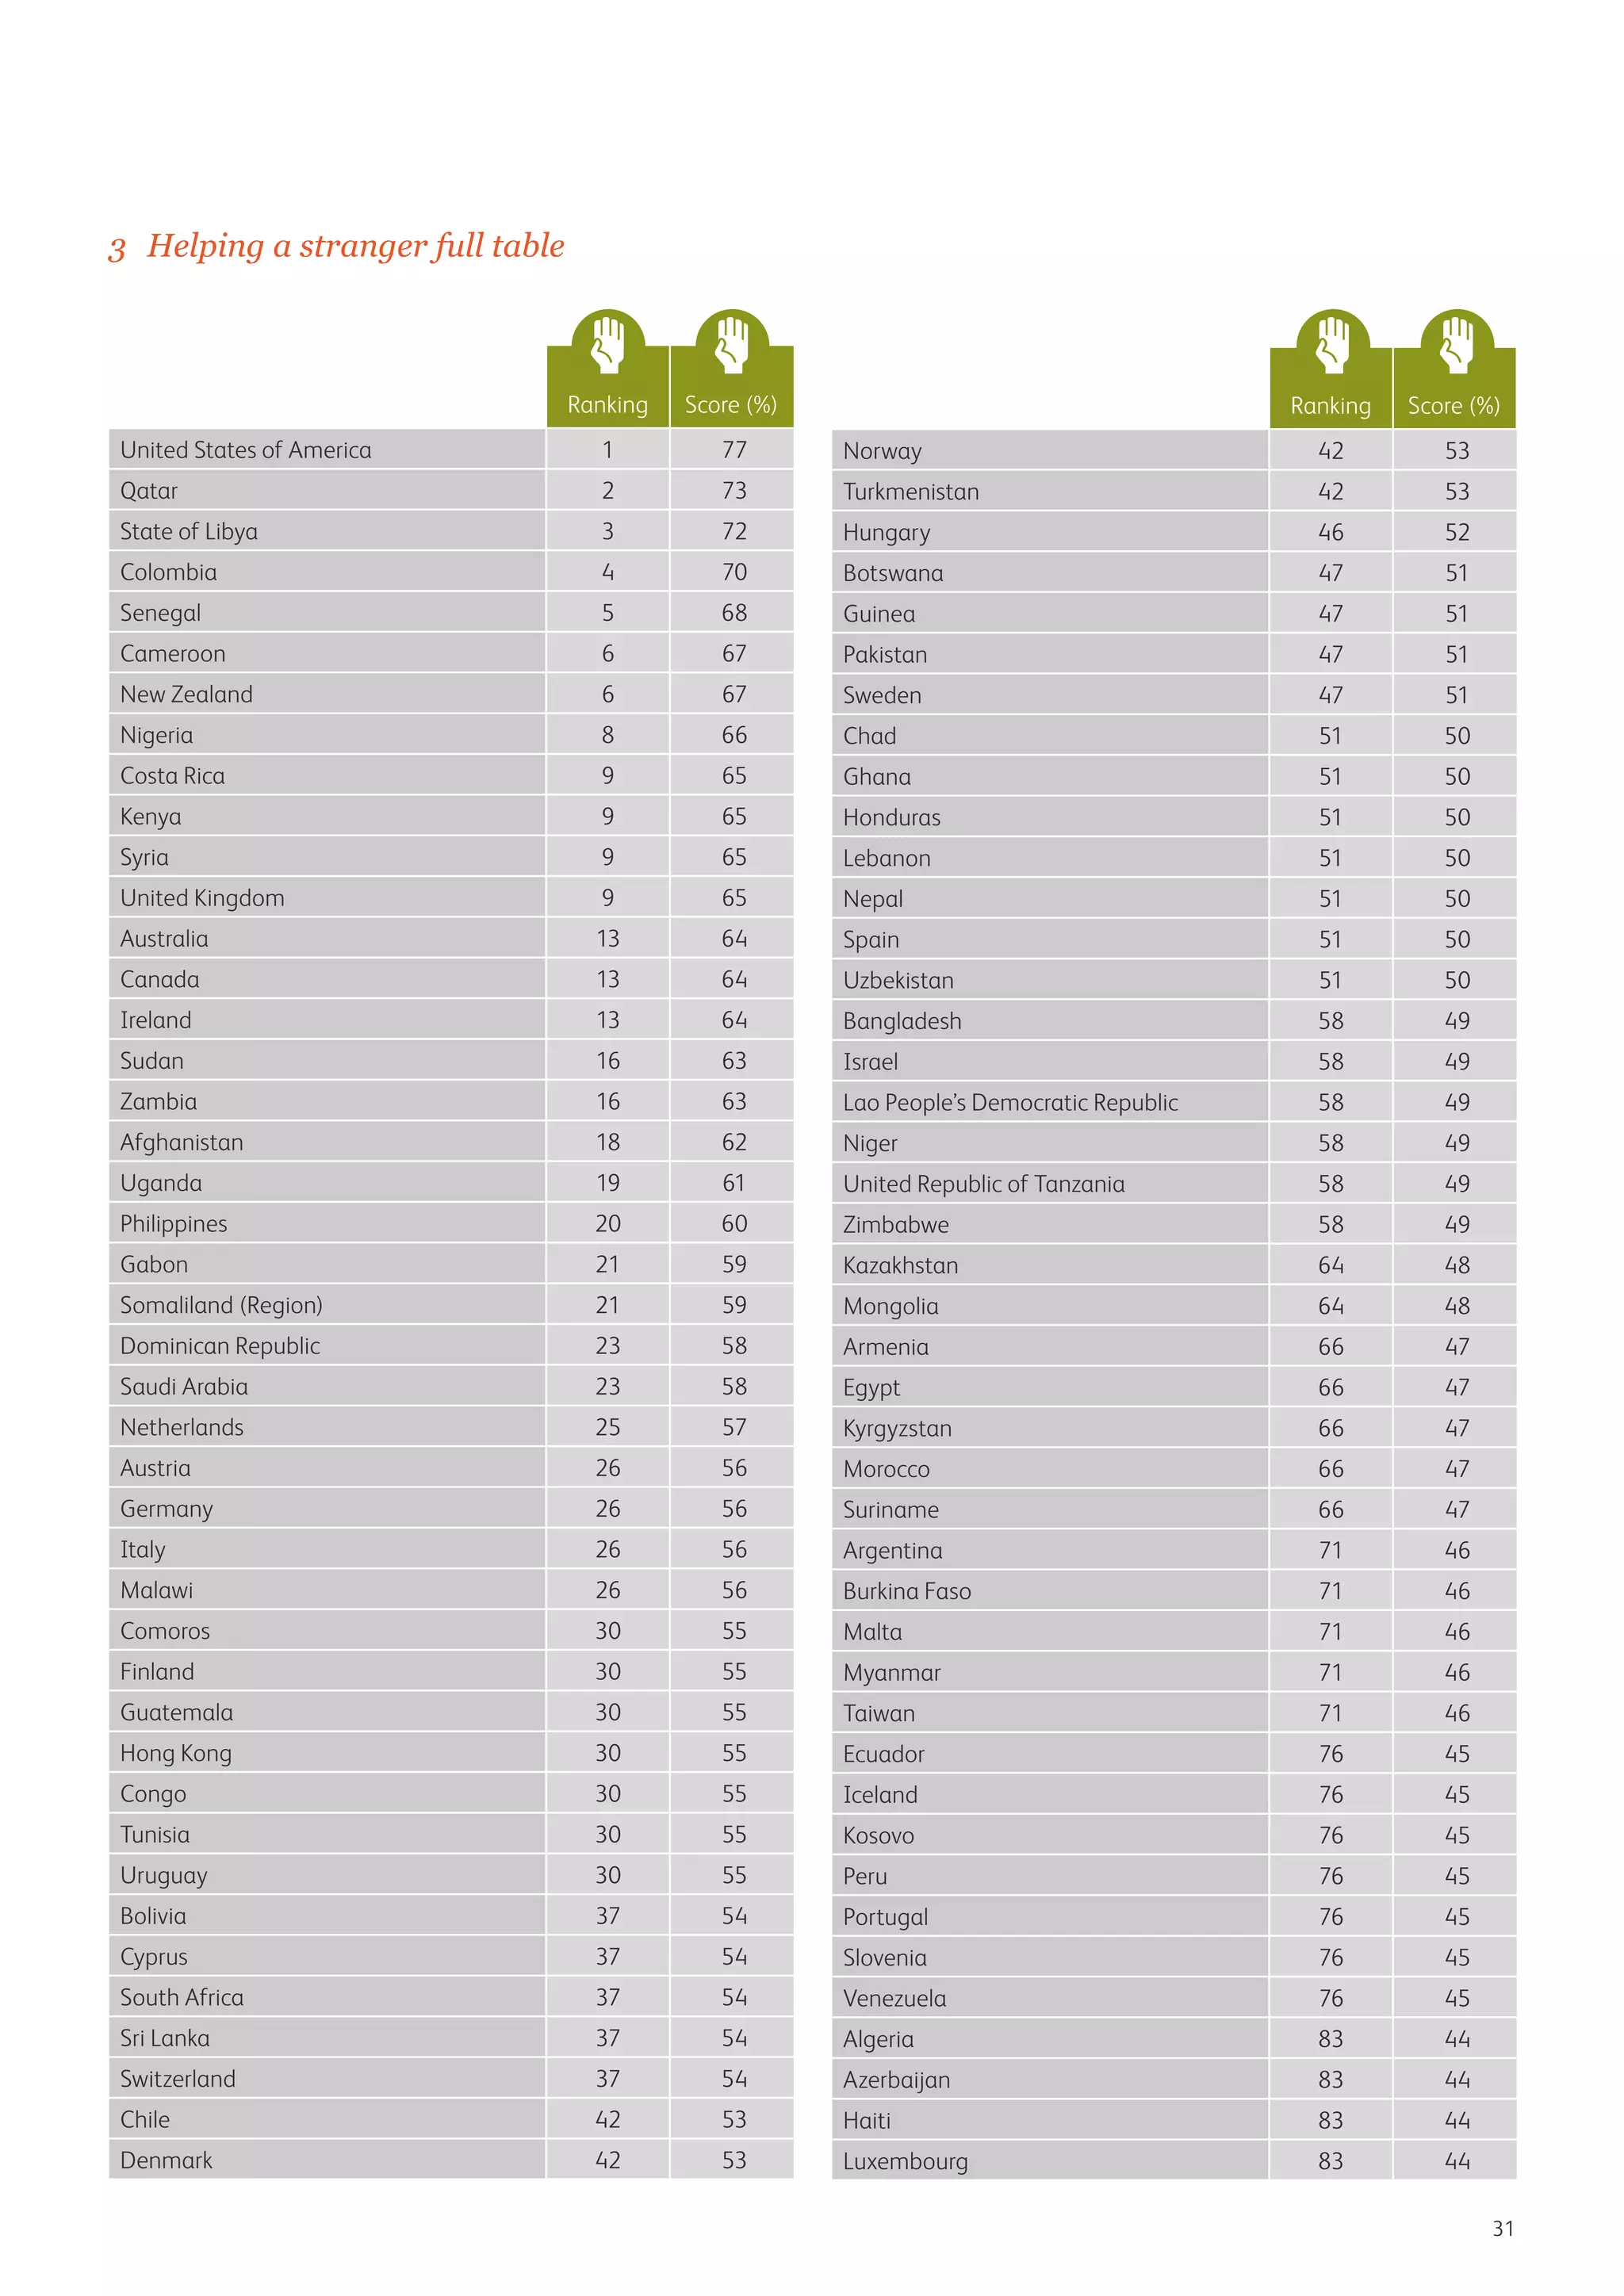
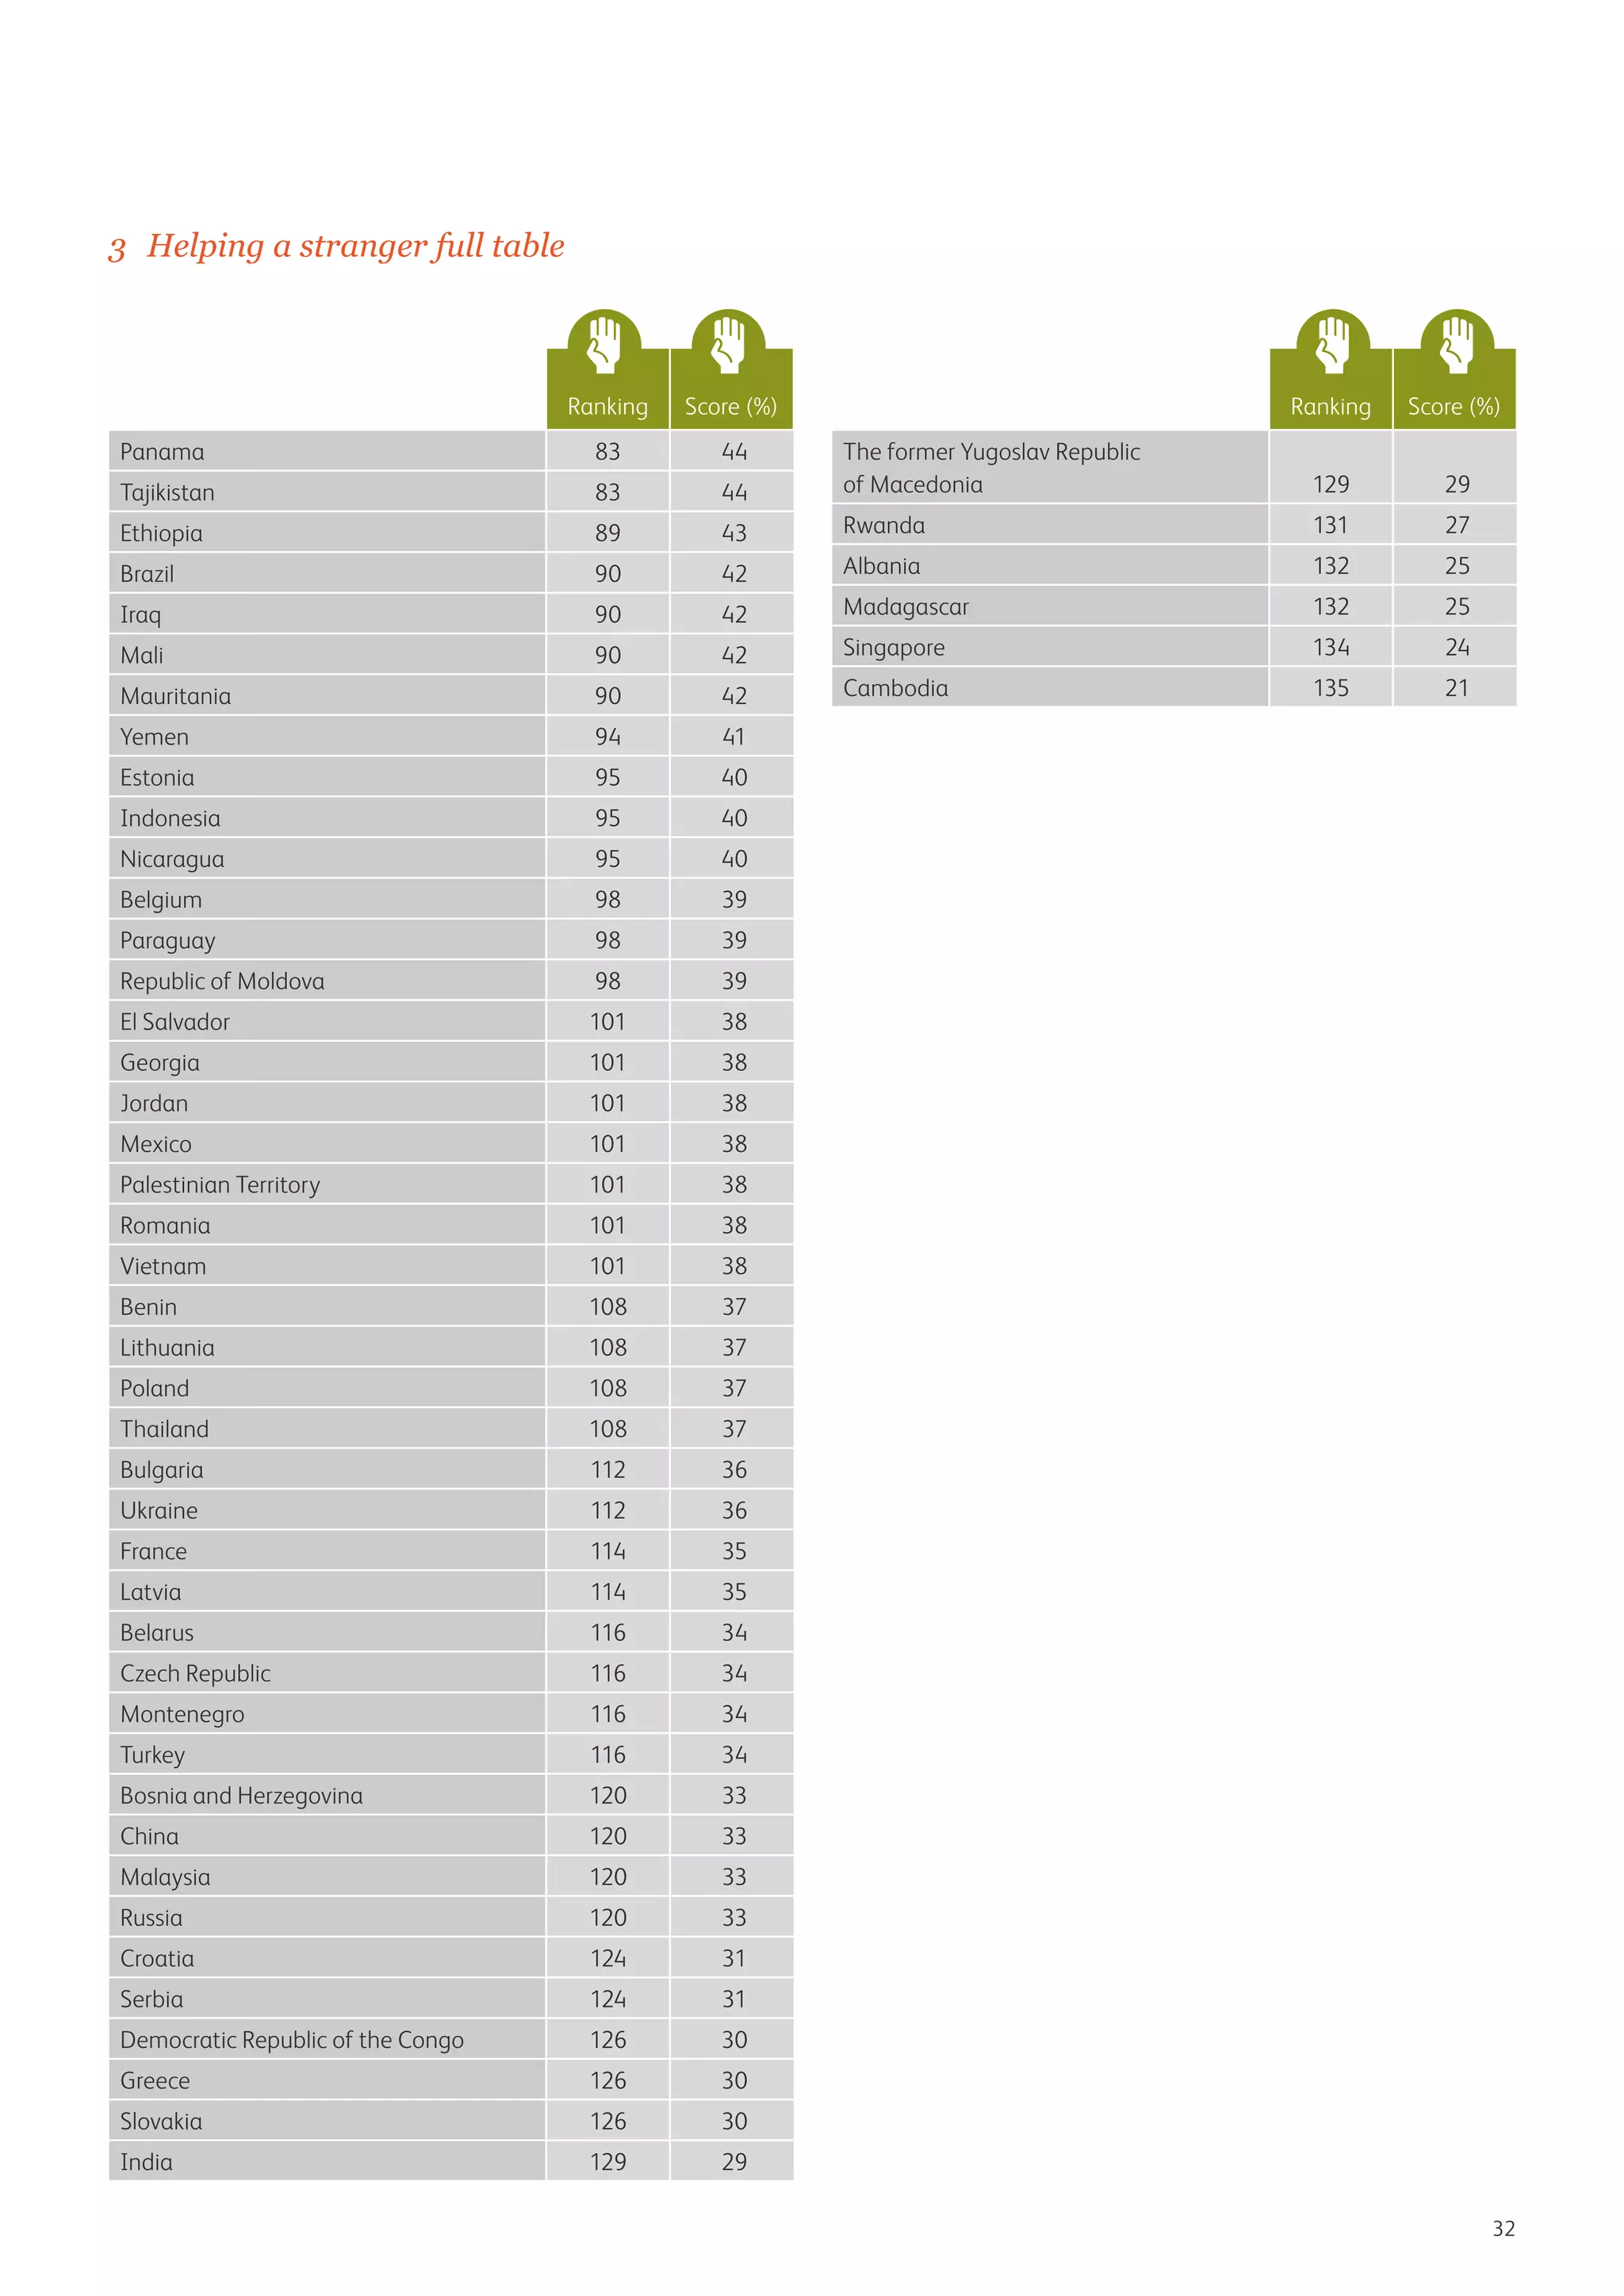


The World Giving Index report found that in 2012: 1) The United States reclaimed the top spot in the World Giving Index rankings due to the high proportion of Americans reporting that they helped a stranger. 2) Giving behaviors such as donating, volunteering, and helping others increased globally from 2011 levels despite slower global economic growth. 3) Myanmar and Libya were among the new entrants in the top 20 rankings, with Myanmar having the highest rate of donations and Libya having high levels of people helping strangers.