World port rankings 20081
•
0 likes•384 views

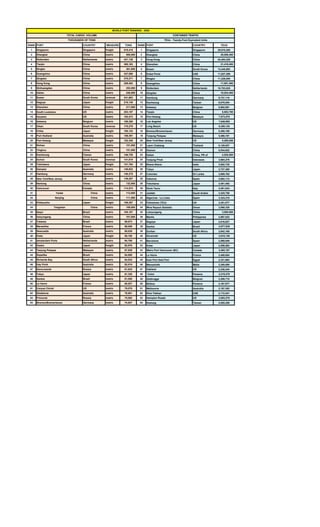
The document lists the world's top ports based on total cargo volume and container traffic in 2008. Singapore ranked first in both total cargo volume and container traffic. The top ports were heavily dominated by ports in China, which held 18 of the top 30 spots in total cargo volume and 17 of the top 30 spots in container traffic. Rotterdam was the highest ranked non-Asian port, taking the 3rd and 11th spots respectively.

Recommended
More Related Content
Viewers also liked
Viewers also liked (20)
More from Rafael Maya Sanabria
More from Rafael Maya Sanabria (20)
Recently uploaded
Recently uploaded (20)
World port rankings 20081
- 1. WORLD PORT RANKING - 2008 TOTAL CARGO VOLUME CONTAINER TRAFFIC THOUSANDS OF TONS TEUs - Twenty-Foot Equivalent Units RANK PORT COUNTRY MEASURE TONS RANK PORT COUNTRY TEUS 1 Singapore Singapore freight 515,415 1 Singapore Singapore 29,918,200 2 Shanghai China metric 508,000 2 Shanghai China 28,006,400 3 Rotterdam Netherlands metric 421,136 3 Hong Kong China 24,494,229 4 Tianjin China metric 365,163 4 Shenzhen China 21,416,400 5 Ningbo China metric 361,850 5 Busan South Korea 13,445,693 6 Guangzhou China metric 347,000 6 Dubai Ports UAE 11,827,299 7 Qingdao China metric 278,271 7 Ningbo China 11,226,000 8 Hong Kong China metric 259,402 8 Guangzhou China 11,001,400 9 Qinhuangdao China metric 252,000 9 Rotterdam Netherlands 10,783,825 10 Dalian China metric 246,000 10 Qingdao China 10,024,400 11 Busan South Korea revenue 241,683 11 Hamburg Germany 9,737,110 12 Nagoya Japan freight 218,130 12 Kaohsiung Taiwan 9,676,554 13 Shenzhen China metric 211,000 13 Antwerp Belgium 8,662,891 14 South Louisiana US metric 203,157 14 Tianjin China 8,502,700 15 Houston US metric 192,473 15 Port Kelang Malasyia 7,973,579 16 Antwerp Belgium metric 189,390 16 Los Angeles US 7,849,985 17 Ulsan South Korea revenue 170,279 17 Long Beach US 6,350,125 18 Chiba Japan freight 165,143 18 Bremen/Bremerhaven Germany 5,488,189 19 Port Hedland Australia metric 159,391 19 Tanjung Pelepas Malasyia 5,466,191 20 Port Kelang Malasyia freight 152,348 20 New York/New Jersey US 5,265,058 21 Rizhao China metric 151,000 21 Laem Chabang Thailand 5,128,057 22 Yingkou China metric 151,000 22 Xiamen China 5,034,622 23 Kaohsiung Taiwan metric 146,729 23 Dalian China, PR of 4,525,500 24 Inchon South Korea revenue 141,815 24 Tanjung Priok Indonesia 3,984,278 25 Yokohama Japan freight 141,764 25 Nhava Sheva India 3,952,735 26 Dampier Australia metric 140,823 26 Tokyo Japan 3,727,300 27 Hamburg Germany metric 140,375 27 Colombo Sri Lanka 3,689,762 28 New York/New Jersey US metric 139,207 28 Valencia Spain 3,602,112 29 Nantong China metric 132,000 29 Yokohama Japan 3,481,492 30 Vancouver Canada metric 114,574 30 Gioia Tauro Italy 3,481,043 31 Yantai China metric 112,000 31 Jeddah Saudi Arabia 3,325,750 32 Nanjing China metric 111,000 32 Algeciras - La Linea Spain 3,324,310 33 Kitakyushu Japan freight 109,367 33 Felixstowe (TEU) UK 3,251,077 34 Tangshan China metric 109,000 34 Mina Raysut (Salalah) Oman 3,068,320 35 Itaqui Brazil metric 105,187 35 Lianyungang China 3,000,500 36 lianyungang China metric 101,000 36 Manila Philippines 2,997,022 37 Tubarao Brazil metric 99,873 37 Nagoya Japan 2,816,827 38 Marseilles France metric 96,009 38 Santos Brazil 2,677,839 39 Newcastle Australia metric 95,839 39 Durban South Africa 2,642,165 40 Kobe Japan freight 95,186 40 Savannah US 2,616,126 41 Amsterdam Ports Netherlands metric 94,768 41 Barcelona Spain 2,569,549 42 Osaka Japan freight 92,976 42 Kobe Japan 2,556,584 43 Tanjung Pelepas Malasyia metric 87,939 43 Metro Port Vancouver (BC) Canada 2,492,107 44 Sepetiba Brazil metric 84,888 44 Le Havre France 2,488,654 45 Richards Bay South Africa metric 84,534 45 East Port Said Port Egypt 2,331,962 46 Hay Point Australia metric 82,519 46 Marsaxlokk Malta 2,300,000 47 Novorossisk Russia metric 81,633 47 Oakland US 2,236,244 48 Tokyo Japan metric 81,328 48 Colon Panama 2,219,278 49 Santos Brazil metric 81,058 49 Zeebrugge Belgium 2,209,715 50 Le Havre France metric 80,527 50 Balboa Panama 2,167,977 51 Corpus Christi US metric 79,079 51 Melbourne Australia 2,157,352 52 Gladstone Australia metric 78,801 52 Khor Fakkan UAE 2,112,441 53 Primorsk Russia metric 75,582 53 Hampton Roads US 2,083,278 54 Bremen/Bremerhaven Germany metric 74,647 54 Keelung Taiwan 2,055,259
- 2. 55 Long Beach US metric 72,746 55 Dublin Ireland 2,039,041 56 Corpus Christ US metric 69,645 56 Yingkou China 2,036,400 57 Algeciras - La Linea Spain metric 69,572 57 Saigon New Port Viet Nam 2,018,104 58 Pohang Korea, Rep. of revenue 67,657 58 London UK 2,006,721 59 New Orleans US metric 66,221 59 Bandar Abbas Iran 2,000,230 60 Grimsby and Immingham UK metric 65,267 60 St. Petersburg Russia 1,983,110 61 Beaumont US metric 63,022 61 Osaka Japan 1,950,083 62 Huntington US metric 62,887 62 Tacoma US 1,861,352 63 Constantza Romania metric 61,837 63 Southampton UK 1,850,132 64 Mobile US metric 61,345 64 Kingston Jamaica 1,830,000 65 Hampton Roads US metric 60,947 65 Kwangyang South Korea 1,810,164 66 St. Petersburg Russia metric 59,945 66 Houston US 1,795,320 67 Valencia Spain metric 59,425 67 Sydney Ports Australia 1,783,794 68 Plaquemines US metric 57,816 68 Inchon South Korea 1,770,884 69 Dunkirk France metric 57,692 69 Genoa Italy 1,766,605 70 Madras India metric 57,497 70 Seattle US 1,704,492 71 Jawaharlal Nehru (Nhava Sheva) India metric 57,280 71 San Juan (FY) US 1,684,883 72 Los Angeles US metric 54,228 72 Charleston US 1,635,534 73 Genoa Italy metric 54,218 73 Manzanillo Panama 1,600,792 74 Calcutta India metric 54,051 74 Montreal Canada 1,473,914 75 Izmit (Kocaeli) Turkey metric 53,852 75 Las Palmas Spain 1,428,944 76 London UK metric 52,965 76 Manzanillo Mexico 1,409,782 77 Bergen Norway metric 52,428 77 Constantza Romania 1,380,935 78 Taichung Taiwan metric 52,203 78 Bangkok Thailand 1,375,168 79 Bombay India metric 51,876 79 Nanjing China 1,292,100 80 Barcelona Spain metric 50,545 80 Alexandria and El-Dekheila Egypt 1,264,455 81 Sao Sebastiao Brazil metric 49,759 81 Haifa Israel 1,262,000 82 Lake Charles US metric 48,777 82 Dammam Saudi Arabia 1,247,039 83 Trieste Italy metric 48,279 83 La Spezia Italy 1,246,139 84 Texas City US metric 47,714 84 Taichung Taiwan 1,239,412 85 Baton Rouge US metric 46,991 85 Karachi Pakistan 1,213,744 86 Saldanha Bay South Africa metric 46,532 86 Quanzhou China 1,206,700 87 Paradip India metric 46,412 87 Callao Peru 1,203,315 88 Jeddah Saudi Arabia metric 45,721 88 Buenos Aires Argentina 1,187,499 89 Tees and Hartlepool UK metric 45,436 89 Fuzhou China 1,176,600 90 Manila Philippines metric 45,230 90 Madras India 1,143,000 91 Alexandria and El-Dekheila Egypt metric 44,912 91 Zhongshan China 1,136,300 92 Taranto Italy metric 43,271 92 Damietta Egypt 1,124,969 93 Gothenburg Sweden metric 43,241 93 Honolulu (FY) US 1,124,388 94 Tampa US metric 42,613 94 Chittagong Bangladesh 1,069,999 95 Jubail Saudi Arabia metric 42,460 95 Callao Peru 1,023,159 96 Tanjung Priok Indonesia metric 42,050 96 Port Everglades (FY) US 985,095 97 Zeebrugge Belgium metric 42,024 97 Valparaiso Chile 946,921 98 Mormugao India metric 41,680 98 Izmir Turkey 936,024 99 Durban South Africa metric 41,403 99 Johor Malasyia 934,767 100 Duluth-Superior US metric 41,125 100 Cartagena Colombia 933,060 101 Southampton UK metric 40,974 101 Penang Malasyia 917,631 102 Wilhelmshaven Germany metric 40,309 102 Brisbane Australia 896,199 103 Calais France metric 39,709 103 Icel (Mersin) Turkey 887,918 104 Baltimore, MD US metric 39,375 104 Guayaquil Ecuador 874,955 105 Forth Ports UK metric 39,054 105 Gothenburg Sweden 862,595 106 Bilbao Spain metric 37,980 106 Beirut Lebanon 861,931 107 Pittsburgh US metric 37,947 107 Port Said (West) Egypt 854,627 108 Yanbu Saudi Arabia metric 37,509 108 Auckland New Zealand 840,000 109 Karachi Pakistan metric 37,193 109 Limon-Moin Costa Rica 835,144 110 New Mangalore India metric 36,690 110 Miami (FY) US 828,349 111 Tampa US metric 35,986 111 Ashdod Israel 827,900 112 Milford Haven UK metric 35,875 112 Marseilles France 826,023 113 Odessa Ukraine metric 34,562 113 Hakata Japan 824,532 114 Leghorn Italy metric 34,028 114 Puerto Cabello Venezuela 811,284 115 Paranagua Brazil metric 33,005 115 Taranto Italy 786,655 116 Paulsboro US metric 32,971 116 Leghorn Italy 778,864 117 Tarragona Spain metric 32,969 117 Cape Town South Africa 767,501 118 Valdez US metric 32,622 118 Buenaventura Colombia 743,295 119 Texas City US metric 32,595 119 Veracruz Mexico 716,046 120 Liverpool/Mersey-side UK metric 32,204 120 Jacksonville US 697,494 121 Savannah US metric 32,102 121 Jacksonville (a) (FY) US 697,494 122 Brisbane Australia metric 31,894 122 Itajai Brazil 693,580 123 Lubeck Germany metric 31,551 123 San Antonio Chile 687,864 124 Pascagoula US metric 30,466 124 Bin Qasim Pakistan 681,000 125 Angra dos Reis Brazil metric 30,425 125 Montevideo Uruguay 675,273 NOTE: The cargo rankings based on tonnage should be interpreted with caution since these measures are not directly comparable and cannot be converted to a single, standardized unit. Sources: Institute of Shipping Economics & Logistics, Containerisation International Yearbook 2010; U.S. Army Corps of Engineers' W Waterborne Commerce Statistics Center, Secretariat of Communications and Transport (Mexico), Waterborne Transport Institute (China); AAPA Surveys ; various port internet sites.