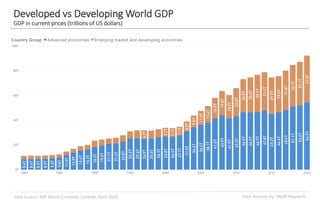
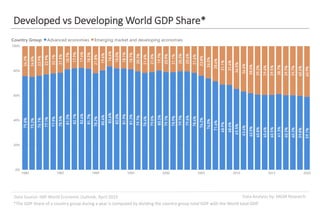
The document analyzes GDP data from the IMF World Economic Outlook for April 2019. It provides rankings of over 190 countries based on nominal GDP, nominal GDP per capita, GDP using purchasing power parity, GDP per capita using PPP, and real GDP growth. The rankings are broken down into tables showing the top countries for each indicator, as well as comparisons between developed and developing economies.

![Data Analysis by: MGM ResearchData Source: IMF World Economic Outlook, April 2019
World GDP Rankings [1/3]
GDP in current prices (billions of US dollars) during 2018
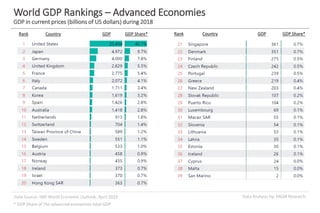
Rank Country GDP GDP Share* Rank Country GDP GDP Share*
* GDP Share of the World total GDP](https://image.slidesharecdn.com/worldgdprankings2019-190612101055/85/World-GDP-Rankings-2019-5-320.jpg)
![Data Analysis by: MGM ResearchData Source: IMF World Economic Outlook, April 2019
World GDP Rankings [2/3]
GDP in current prices (billions of US dollars) during 2018
Rank Country GDP Rank Country GDP Rank Country GDP Rank Country GDP](https://image.slidesharecdn.com/worldgdprankings2019-190612101055/85/World-GDP-Rankings-2019-6-320.jpg)
![Data Analysis by: MGM ResearchData Source: IMF World Economic Outlook, April 2019
World GDP Rankings [3/3]
GDP in current prices (billions of US dollars) during 2018
Rank Country GDP Rank Country GDP Rank Country GDP Rank Country GDP](https://image.slidesharecdn.com/worldgdprankings2019-190612101055/85/World-GDP-Rankings-2019-7-320.jpg)
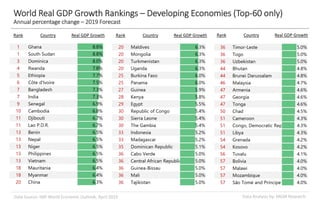
![Data Analysis by: MGM ResearchData Source: IMF World Economic Outlook, April 2019
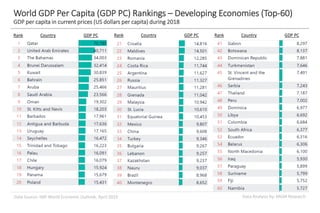
World GDP Rankings – Developing Economies [Top-40 only]
GDP in current prices (billions of US dollars) during 2018
Rank Country GDP GDP Share* Rank Country GDP GDP Share*
* GDP Share of the developing economies total GDP](https://image.slidesharecdn.com/worldgdprankings2019-190612101055/85/World-GDP-Rankings-2019-9-320.jpg)
![Data Analysis by: MGM ResearchData Source: IMF World Economic Outlook, April 2019
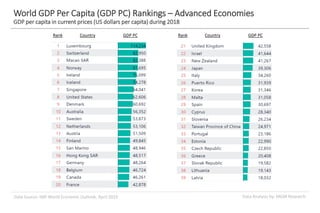
World GDP Per Capita (GDP PC) Rankings [1/3]
GDP per capita in current prices (US dollars per capita) during 2018
Rank Country GDP PC Rank Country GDP PC Rank Country GDP PC](https://image.slidesharecdn.com/worldgdprankings2019-190612101055/85/World-GDP-Rankings-2019-11-320.jpg)
![Data Analysis by: MGM ResearchData Source: IMF World Economic Outlook, April 2019
World GDP Per Capita (GDP PC) Rankings [2/3]
GDP per capita in current prices (US dollars per capita) during 2018
Rank Country GDP PC Rank Country GDP PC Rank Country GDP PC](https://image.slidesharecdn.com/worldgdprankings2019-190612101055/85/World-GDP-Rankings-2019-12-320.jpg)
![Data Analysis by: MGM ResearchData Source: IMF World Economic Outlook, April 2019
World GDP Per Capita (GDP PC) Rankings [3/3]
GDP per capita in current prices (US dollars per capita) during 2018
Rank Country GDP PC Rank Country GDP PC Rank Country GDP PC](https://image.slidesharecdn.com/worldgdprankings2019-190612101055/85/World-GDP-Rankings-2019-13-320.jpg)
![Data Analysis by: MGM ResearchData Source: IMF World Economic Outlook, April 2019
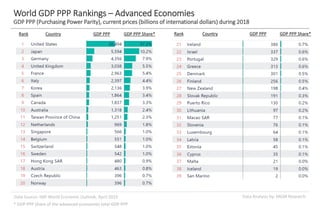
World GDP PPP Rankings [1/3]
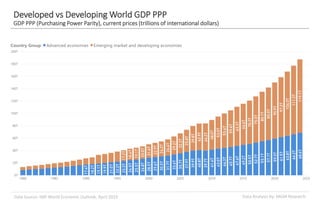
GDP PPP (Purchasing Power Parity), current prices (billions of international dollars) during 2018
Rank Country GDP PPP GDP PPP Share* Rank Country GDP PPP GDP PPP Share*
* GDP PPP Share of the World total GDP PPP](https://image.slidesharecdn.com/worldgdprankings2019-190612101055/85/World-GDP-Rankings-2019-19-320.jpg)
![Data Analysis by: MGM ResearchData Source: IMF World Economic Outlook, April 2019
World GDP PPP Rankings [2/3]
GDP PPP (Purchasing Power Parity), current prices (billions of international dollars) during 2018
Rank Country GDP PPP Rank Country GDP PPP Rank Country GDP PPP Rank Country GDP PPP](https://image.slidesharecdn.com/worldgdprankings2019-190612101055/85/World-GDP-Rankings-2019-20-320.jpg)
![Data Analysis by: MGM ResearchData Source: IMF World Economic Outlook, April 2019
World GDP PPP Rankings [3/3]
GDP PPP (Purchasing Power Parity), current prices (billions of international dollars) during 2018
Rank Country GDP PPP Rank Country GDP PPP Rank Country GDP PPP Rank Country GDP PPP](https://image.slidesharecdn.com/worldgdprankings2019-190612101055/85/World-GDP-Rankings-2019-21-320.jpg)

![Data Analysis by: MGM ResearchData Source: IMF World Economic Outlook, April 2019
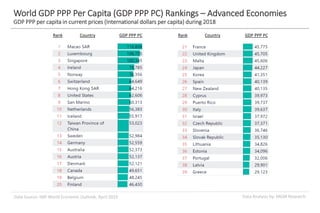
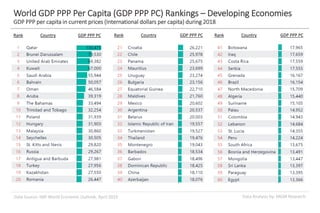
World GDP PPP Per Capita (GDP PPP PC) Rankings [1/3]
GDP PPP per capita in current prices (International dollars per capita) during 2018
Rank Country GDP PPP PC Rank Country GDP PPP PC Rank Country GDP PPP PC](https://image.slidesharecdn.com/worldgdprankings2019-190612101055/85/World-GDP-Rankings-2019-25-320.jpg)
![Data Analysis by: MGM ResearchData Source: IMF World Economic Outlook, April 2019
World GDP PPP Per Capita (GDP PPP PC) Rankings [2/3]
GDP PPP per capita in current prices (International dollars per capita) during 2018
Rank Country GDP PPP PC Rank Country GDP PPP PC Rank Country GDP PPP PC](https://image.slidesharecdn.com/worldgdprankings2019-190612101055/85/World-GDP-Rankings-2019-26-320.jpg)
![Data Analysis by: MGM ResearchData Source: IMF World Economic Outlook, April 2019
World GDP PPP Per Capita (GDP PPP PC) Rankings [3/3]
GDP PPP per capita in current prices (International dollars per capita) during 2018
Rank Country GDP PPP PC Rank Country GDP PPP PC Rank Country GDP PPP PC](https://image.slidesharecdn.com/worldgdprankings2019-190612101055/85/World-GDP-Rankings-2019-27-320.jpg)
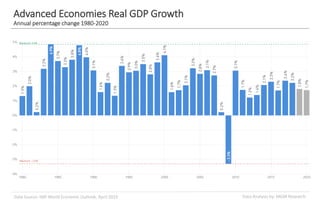
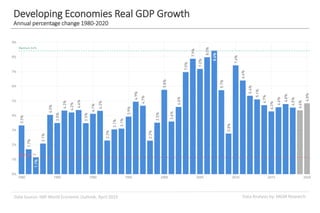
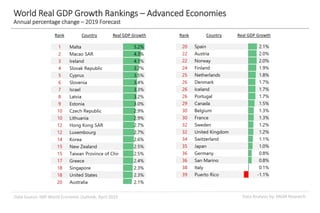
![Data Analysis by: MGM ResearchData Source: IMF World Economic Outlook, April 2019
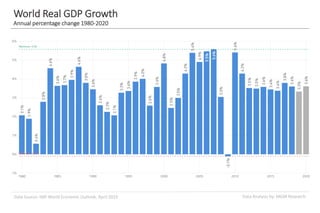
World Real GDP Growth Rankings [1/3]
Annual Percentage Change – 2019 Forecast
Rank Country Real GDP Growth Rank Country Real GDP Growth Rank Country Real GDP Growth](https://image.slidesharecdn.com/worldgdprankings2019-190612101055/85/World-GDP-Rankings-2019-34-320.jpg)
![Data Analysis by: MGM ResearchData Source: IMF World Economic Outlook, April 2019
World Real GDP Growth Rankings [2/3]
Annual Percentage Change – 2019 Forecast
Rank Country Real GDP Growth Rank Country Real GDP Growth Rank Country Real GDP Growth](https://image.slidesharecdn.com/worldgdprankings2019-190612101055/85/World-GDP-Rankings-2019-35-320.jpg)
![Data Analysis by: MGM ResearchData Source: IMF World Economic Outlook, April 2019
World Real GDP Growth Rankings [3/3]
Annual Percentage Change – 2019 Forecast
Rank Country Real GDP Growth Rank Country Real GDP Growth Rank Country Real GDP Growth](https://image.slidesharecdn.com/worldgdprankings2019-190612101055/85/World-GDP-Rankings-2019-36-320.jpg)