Download to read offline

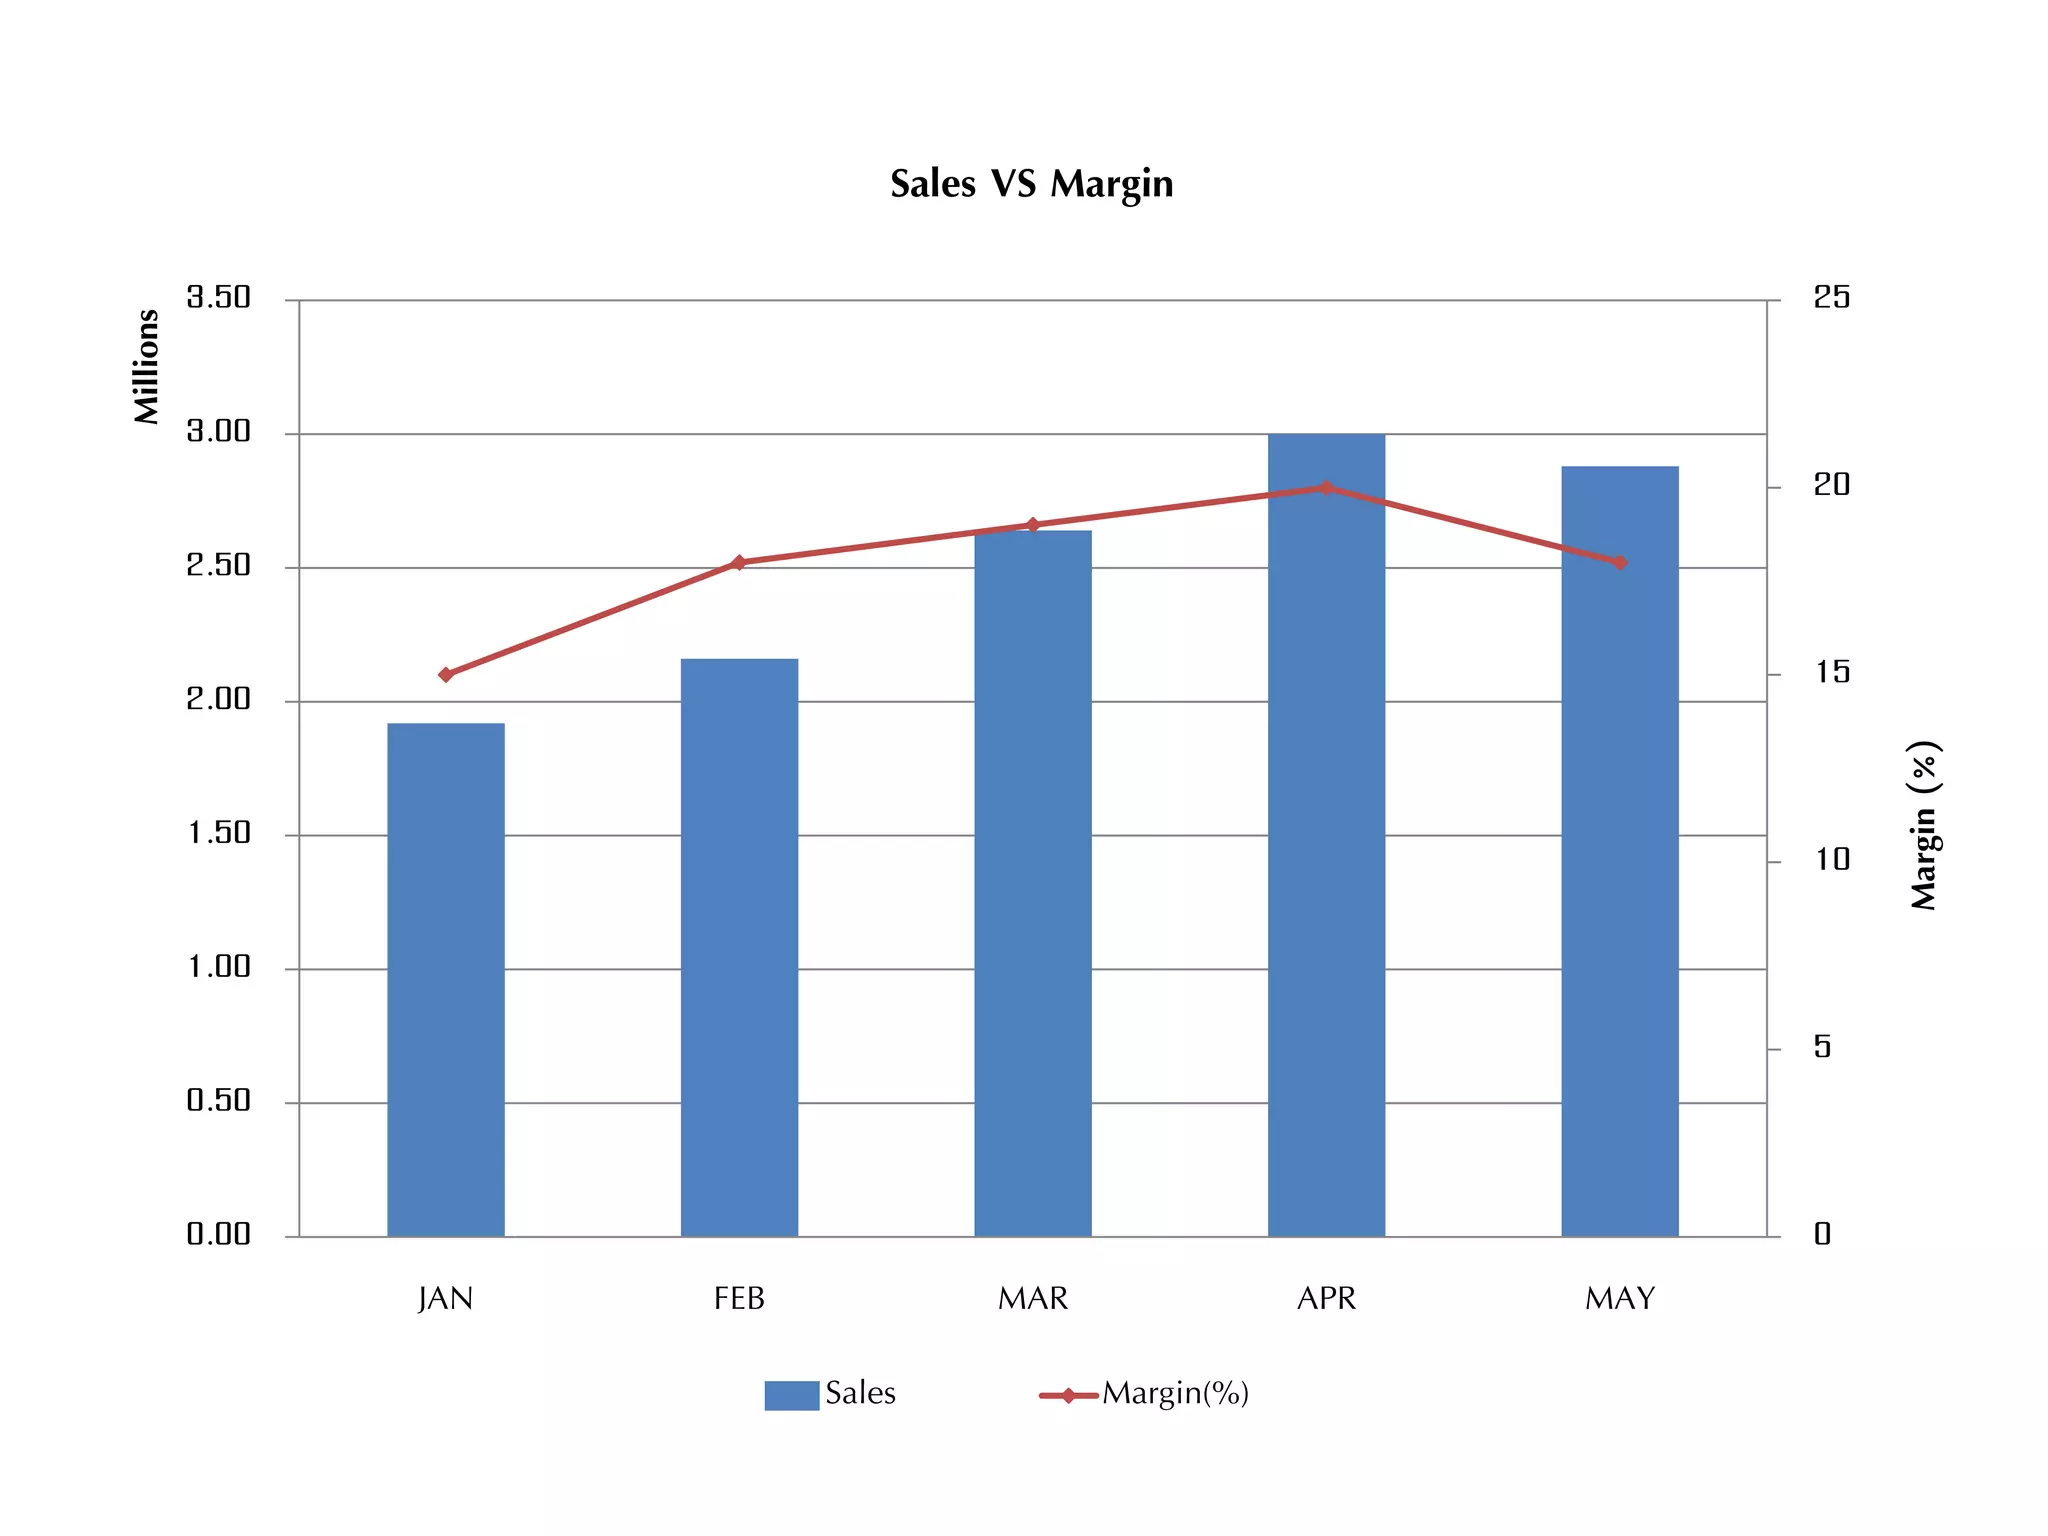
This chart shows the sales and margin percentage for a company over the first 5 months of the year. Sales were highest in March at around $3 million but margins peaked in February at 1.5%. Overall margins declined as sales increased throughout the period shown.


