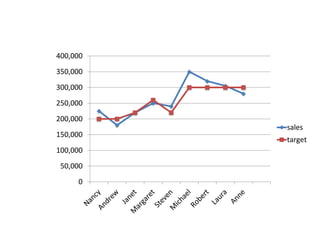
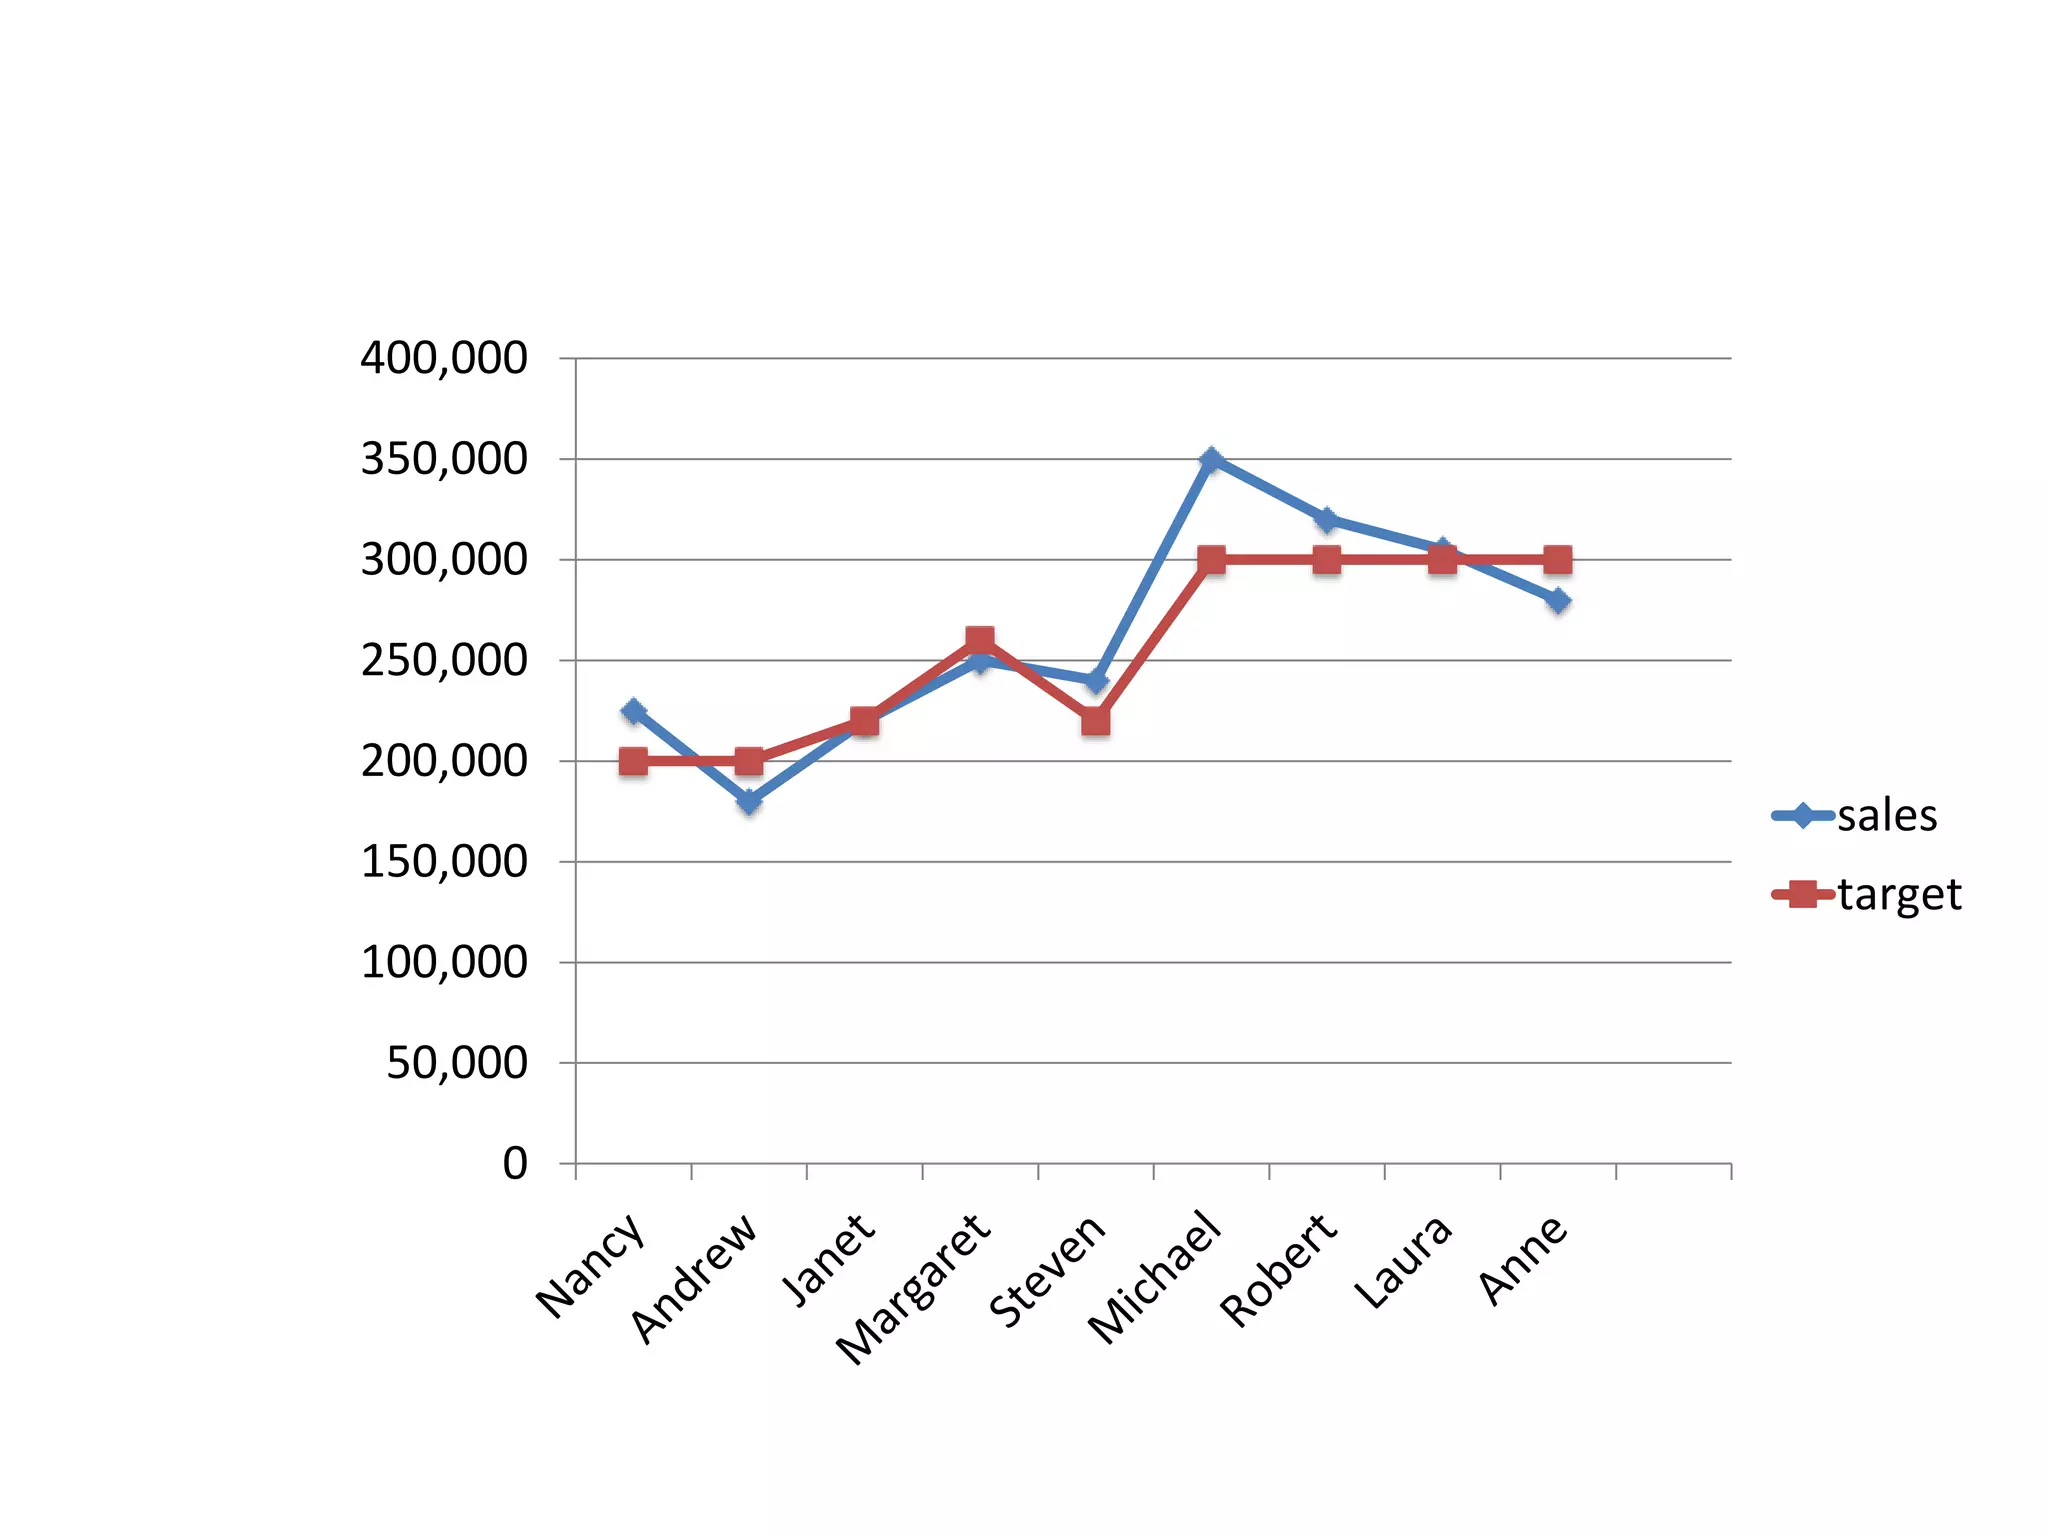
This document contains a simple line graph with sales on the y-axis ranging from 0 to 400,000 and a target line marked at 250,000. The graph shows sales increasing from 0 to just over 300,000, surpassing the target level.