The document provides an overview of Vittorio Bertocci, who is a Senior Architect Evangelist at Microsoft and expert on identity, Windows Azure, and .NET development. It then describes a book titled "Programming Windows Identity Foundation" which teaches how to implement claims-based identity in .NET solutions using Windows Identity Foundation to take control of access and identity management. The book covers topics such as authentication, authorization, single sign-on, advanced identity scenarios, and using claims-based identity with Windows Communication Foundation and Windows Azure.
![Bertocci
Programming/
Microsoft Visual Studio
9 7 8 0 7 3 5 6 2 7 1 8 5
ISBN: 978-0-7356-2718-5
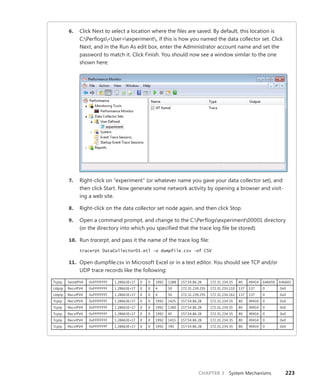
0 0 0 0 0
About the Author
Vittorio Bertocci is a Senior Architect
Evangelist in the Developer Platform Evangelism
division at Microsoft, and a key member of the
extended engineering team for WIF. He is an
expert on identity, Windows Azure, and .NET
development; a frequent speaker at Microsoft
PDC, Tech•Ed, and other industry events; and
a coauthor of A Guide to Claims-Based Identity
and Access Control.
Apply the principles—and patterns—for implementing
claims-based identity in your .NET solutions
Take control of access and identity management with Windows
Identity Foundation (WIF)—the claims-based identity model in
Microsoft .NET. Led by an insider on the WIF engineering team,
you’ll learn practical, scenario-based approaches for implementing
WIF in your Web applications and services—while streamlining
development and IT overhead.
Discover how to:
• Implement authentication and authorization in ASP.NET—
without low-level code
• Delve deeper—examining WS-Federation and WS-Trust protocols
in action
• Configure WIF for fine-grained control over identity management
• Implement Single Sign-On, Single Sign-Out, advanced session
management, and other patterns
• Tackle advanced scenarios—from managing delegation to flowing
identity across multiple tiers
• Employ claims-based identity in Windows Communication
Foundation
• Use WIF to help secure applications and services hosted in
Windows Azure™
• Extend WIF to Microsoft Silverlight®
and ASP.NET MVC
Programming Windows®
Identity Foundation
Get code samples on the Web
For system requirements, see the Introduction.
Programming
Windows
®
Identity
Foundation
microsoft.com/mspress
U.S.A. $34.99
Canada $40.99
[Recommended]
See inside cover
DEVELOPER ROADMAP
Step by Step
• For experienced developers learning a
new topic
• Focus on fundamental techniques and tools
• Hands-on tutorial with practice files plus
eBook
Start Here!
• Beginner-level instruction
• Easy to follow explanations and examples
• Exercises to build your first projects
Developer Reference
• Professional developers; intermediate to
advanced
• Expertly covers essential topics and
techniques
• Features extensive, adaptable code examples
Professional developers; intermediate to
Expertly covers essential topics and
Focused Topics
• For programmers who develop
complex or advanced solutions
• Specialized topics; narrow focus; deep
coverage
• Features extensive, adaptable code examples
Windows®
Internals
Part 1
6
S I X T H
E D I T I O N
Mark Russinovich
David A. Solomon
Alex Ionescu
spine = .64”
Cyan Magenta Yellow Black](https://image.slidesharecdn.com/windowsinternalspart16thedition-230122041507-daca5e1d/85/Windows-Internals-Part-1_6th-Edition-pdf-1-320.jpg)
![Bertocci
Programming/
Microsoft Visual Studio
9 7 8 0 7 3 5 6 2 7 1 8 5
ISBN: 978-0-7356-2718-5
0 0 0 0 0
About the Author
Vittorio Bertocci is a Senior Architect
Evangelist in the Developer Platform Evangelism
division at Microsoft, and a key member of the
extended engineering team for WIF. He is an
expert on identity, Windows Azure, and .NET
development; a frequent speaker at Microsoft
PDC, Tech•Ed, and other industry events; and
a coauthor of A Guide to Claims-Based Identity
and Access Control.
Apply the principles—and patterns—for implementing
claims-based identity in your .NET solutions
Take control of access and identity management with Windows
Identity Foundation (WIF)—the claims-based identity model in
Microsoft .NET. Led by an insider on the WIF engineering team,
you’ll learn practical, scenario-based approaches for implementing
WIF in your Web applications and services—while streamlining
development and IT overhead.
Discover how to:
• Implement authentication and authorization in ASP.NET—
without low-level code
• Delve deeper—examining WS-Federation and WS-Trust protocols
in action
• Configure WIF for fine-grained control over identity management
• Implement Single Sign-On, Single Sign-Out, advanced session
management, and other patterns
• Tackle advanced scenarios—from managing delegation to flowing
identity across multiple tiers
• Employ claims-based identity in Windows Communication
Foundation
• Use WIF to help secure applications and services hosted in
Windows Azure™
• Extend WIF to Microsoft Silverlight®
and ASP.NET MVC
Programming Windows®
Identity Foundation
Get code samples on the Web
For system requirements, see the Introduction.
Programming
Windows
®
Identity
Foundation
microsoft.com/mspress
U.S.A. $34.99
Canada $40.99
[Recommended]
See inside cover
DEVELOPER ROADMAP
Step by Step
• For experienced developers learning a
new topic
• Focus on fundamental techniques and tools
• Hands-on tutorial with practice files plus
eBook
Start Here!
• Beginner-level instruction
• Easy to follow explanations and examples
• Exercises to build your first projects
Developer Reference
• Professional developers; intermediate to
advanced
• Expertly covers essential topics and
techniques
• Features extensive, adaptable code examples
Professional developers; intermediate to
Expertly covers essential topics and
Focused Topics
• For programmers who develop
complex or advanced solutions
• Specialized topics; narrow focus; deep
coverage
• Features extensive, adaptable code examples
Windows®
Internals
Part 1
6
S I X T H
E D I T I O N
Mark Russinovich
David A. Solomon
Alex Ionescu
spine = .64”
Cyan Magenta Yellow Black](https://image.slidesharecdn.com/windowsinternalspart16thedition-230122041507-daca5e1d/75/Windows-Internals-Part-1_6th-Edition-pdf-1-2048.jpg)


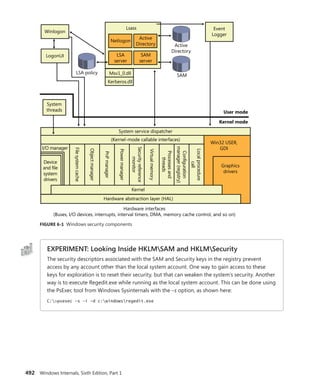
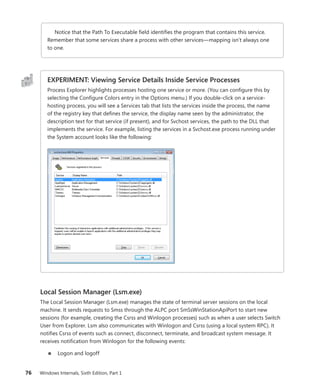
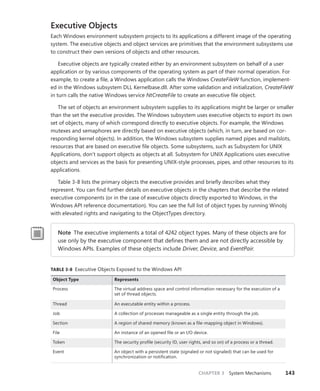
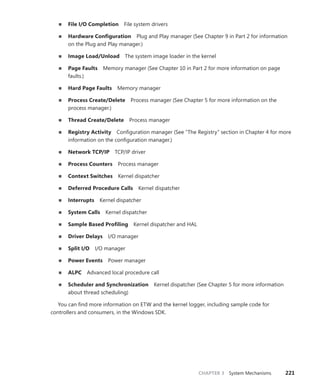
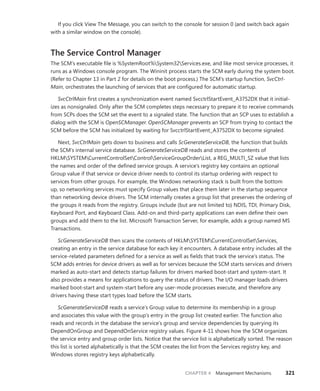
![30 Windows Internals, Sixth Edition, Part 1
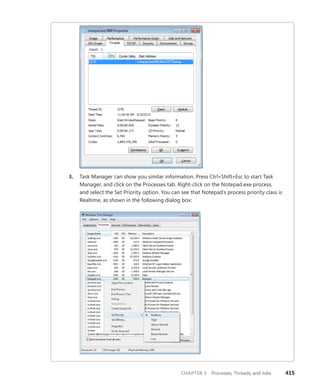
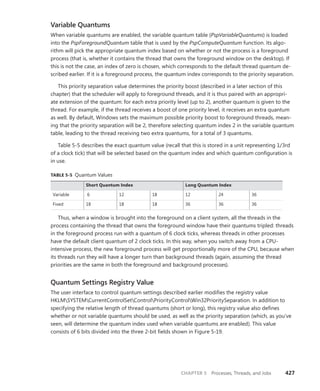
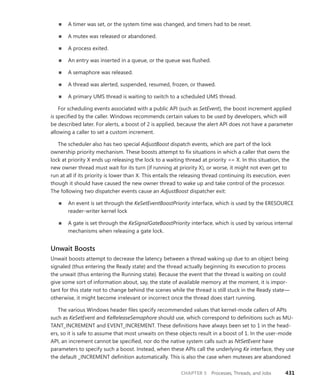
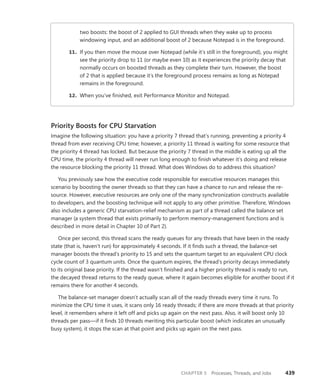
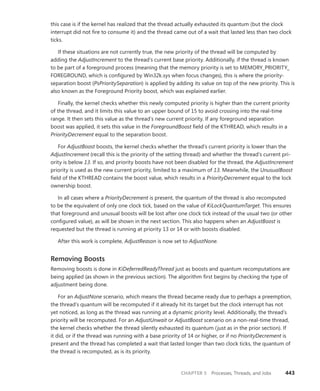
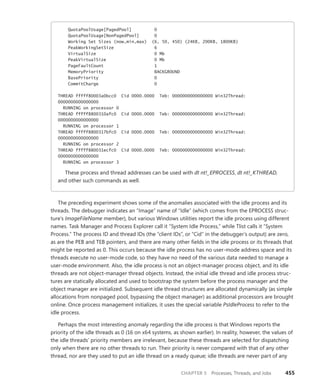
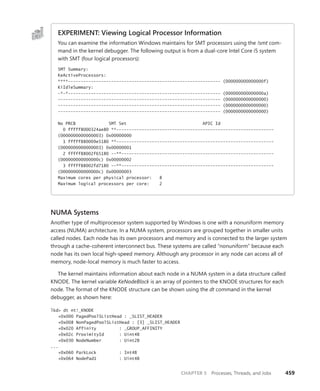
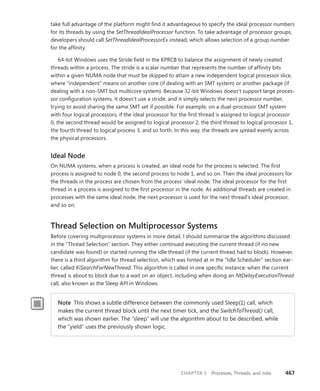
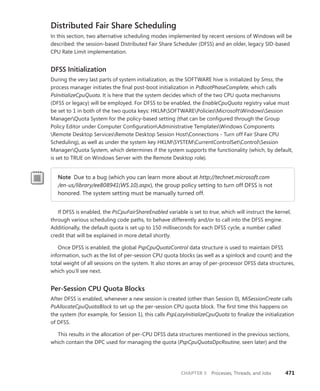
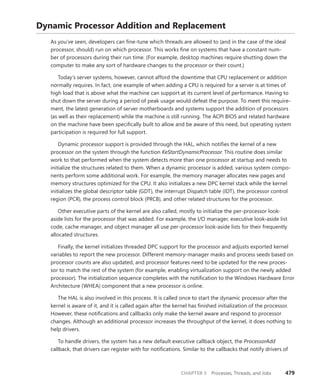
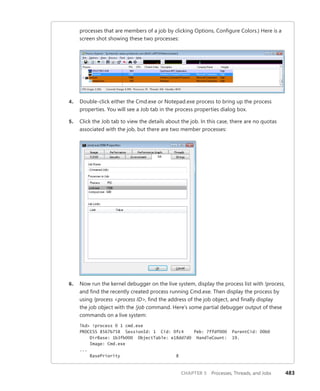
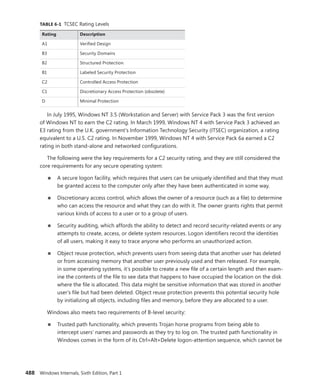
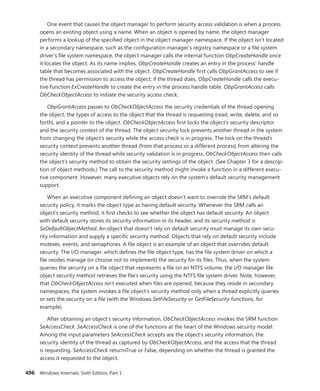
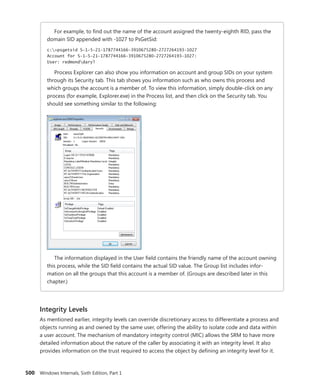
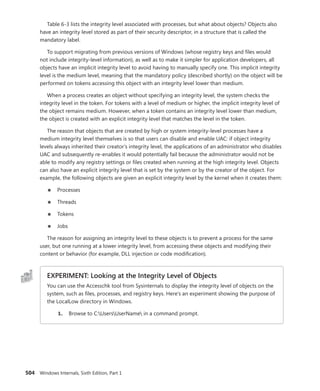
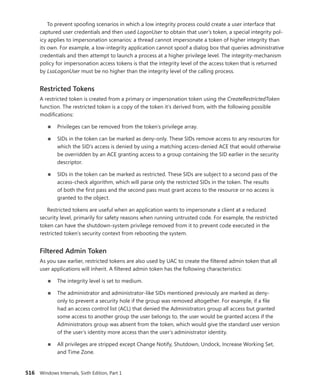
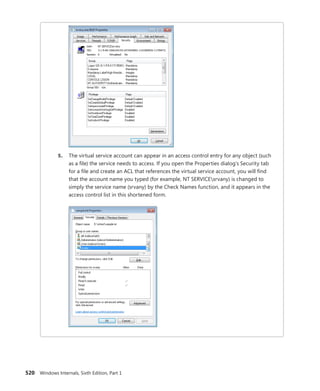
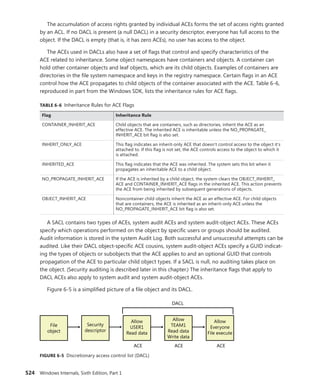
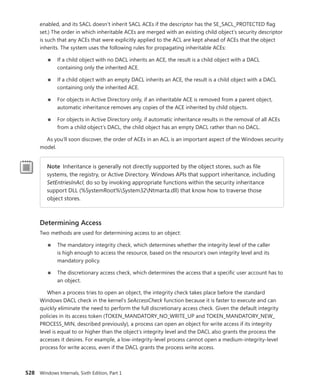
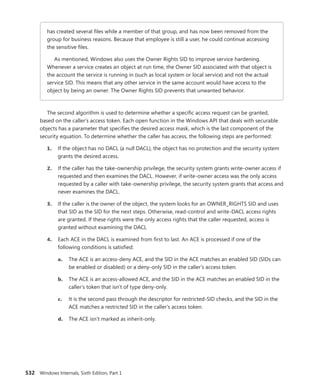
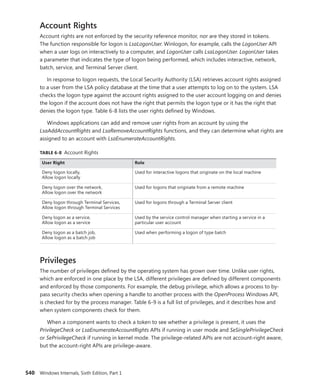
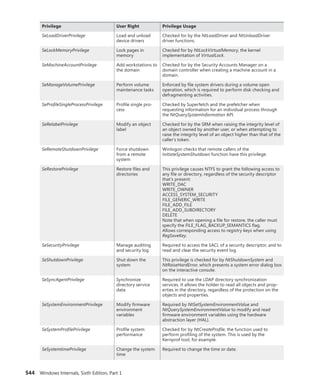
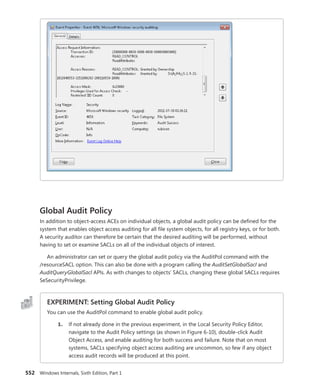
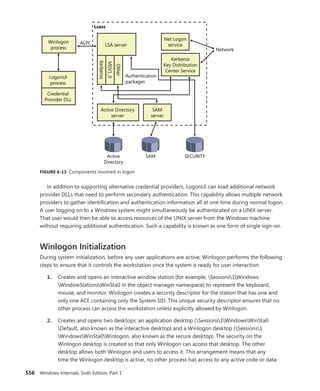
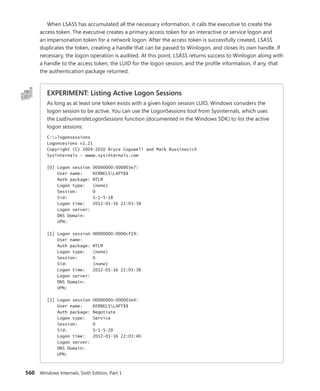
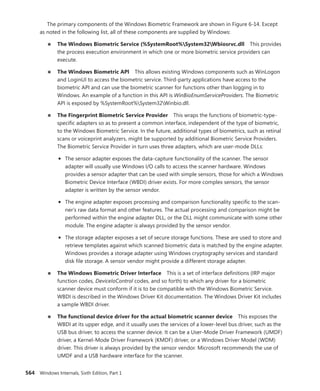
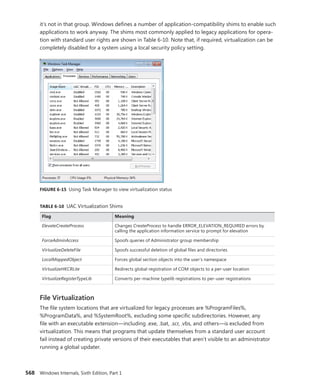
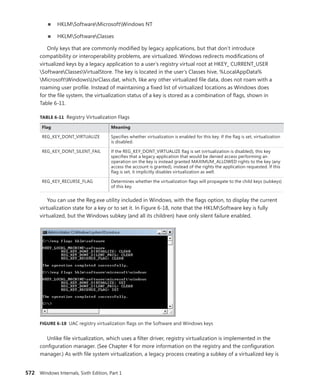
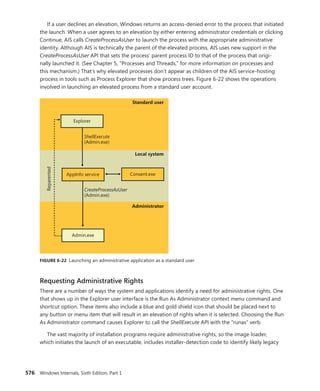
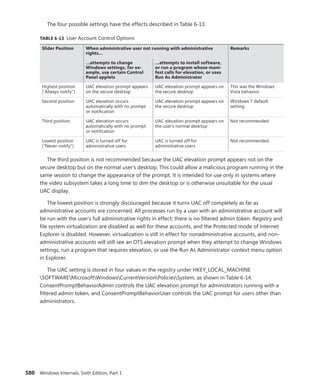
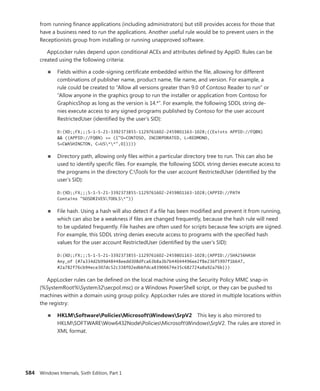
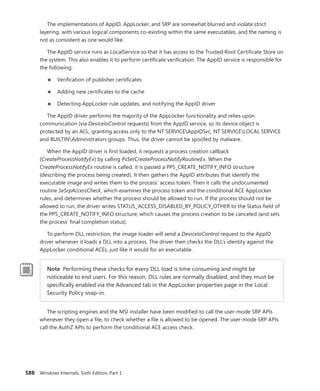
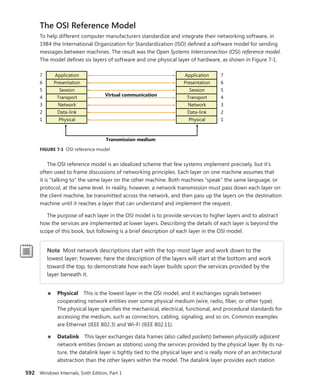
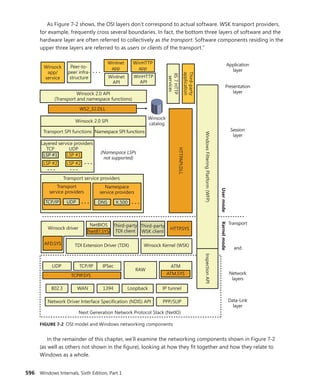
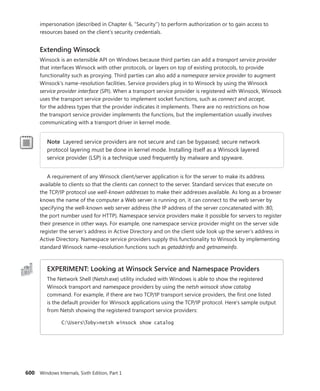
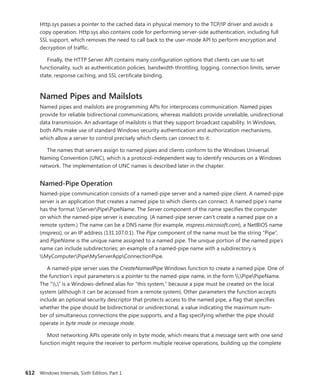
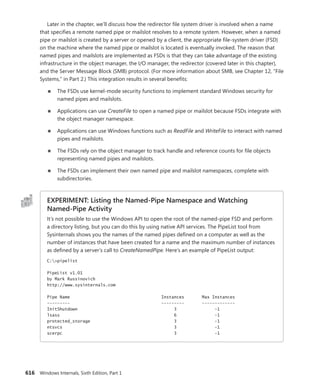
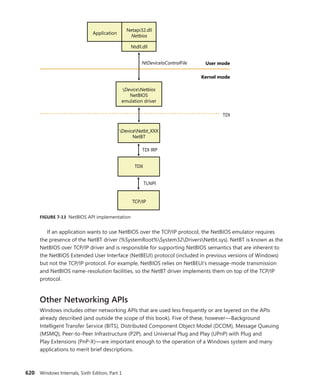
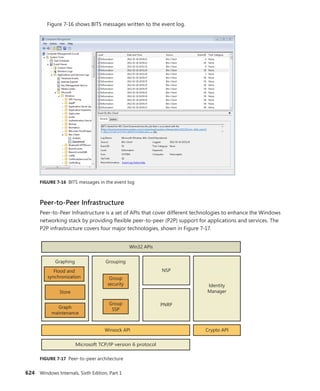
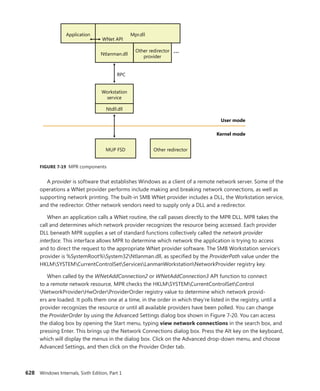
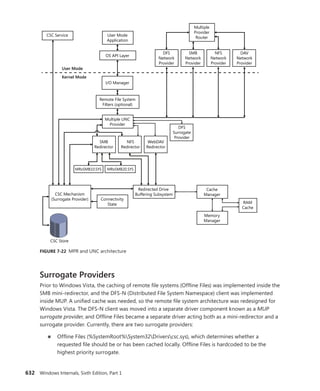
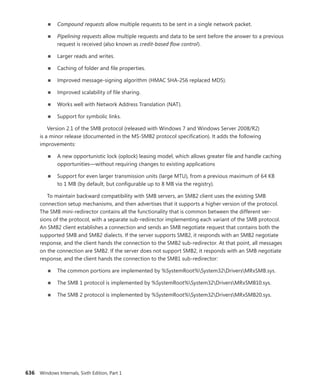
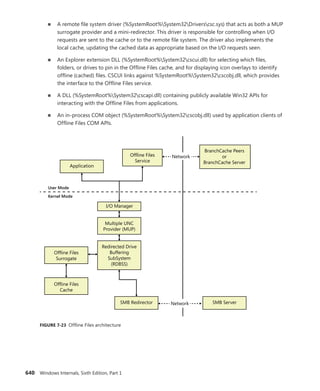
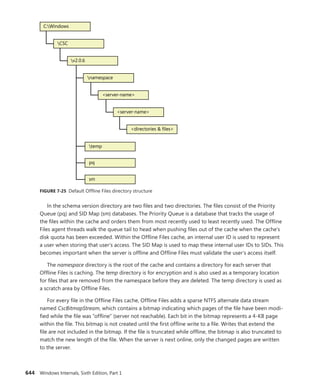
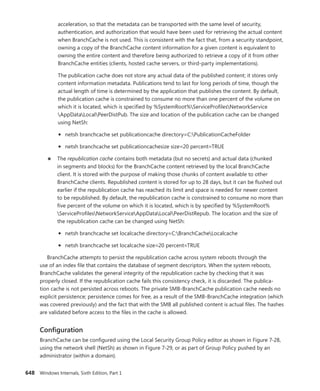
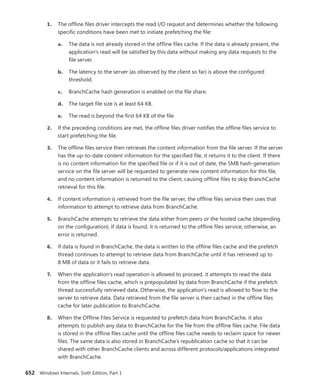
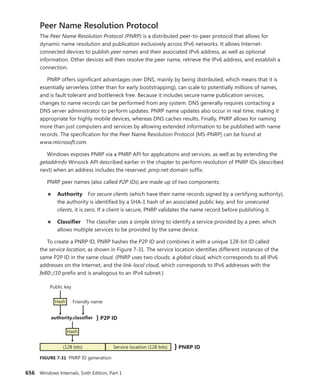
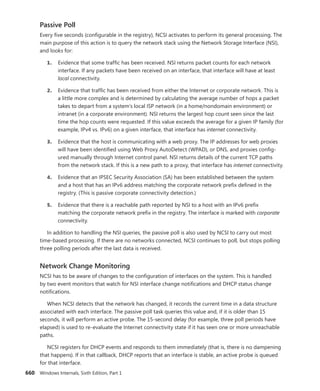
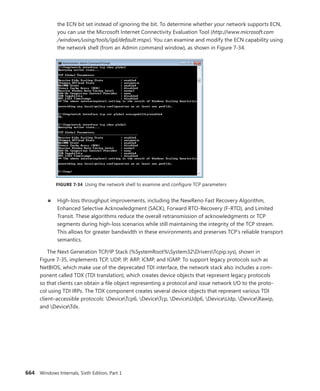
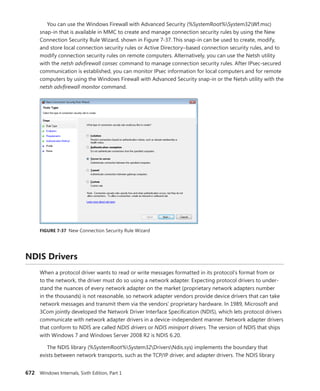
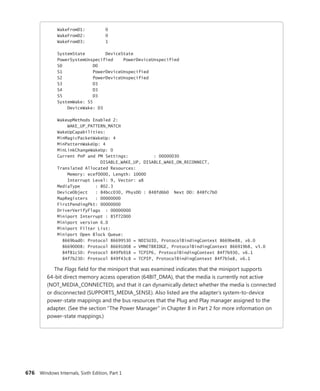
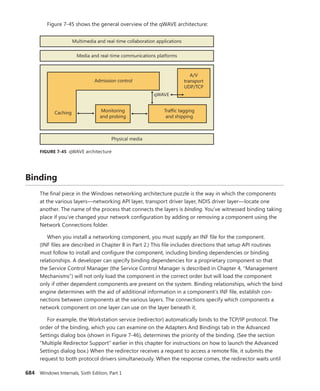
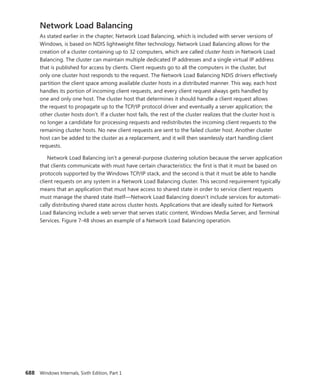
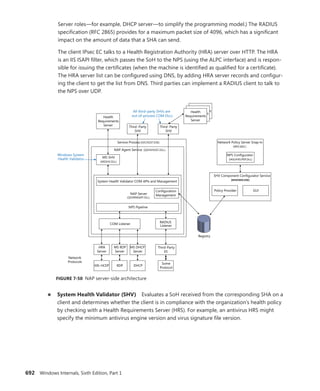
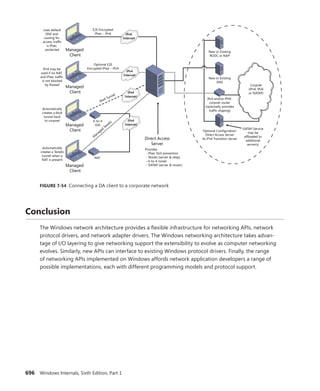
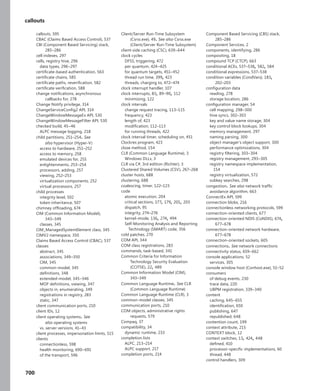
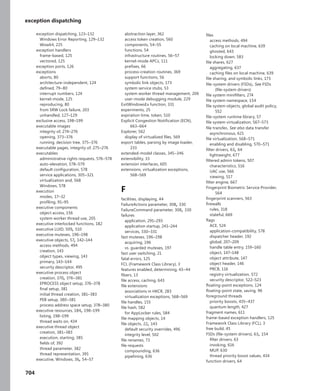
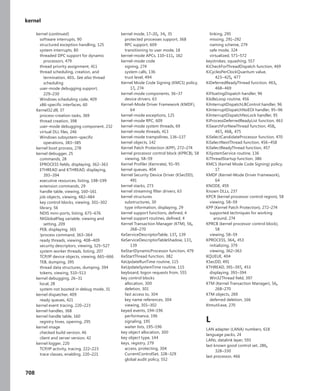
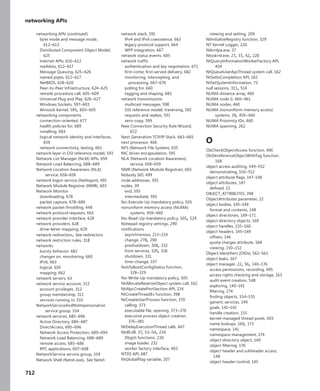
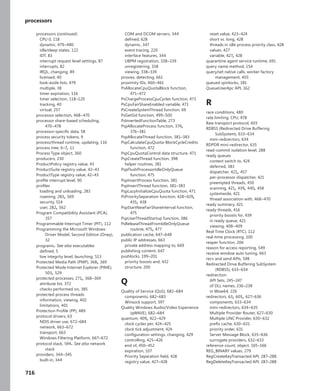
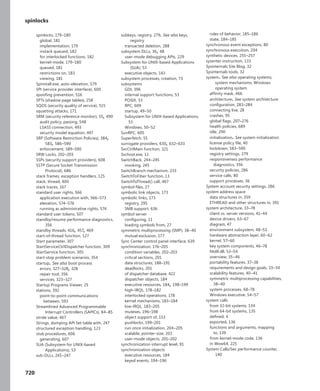
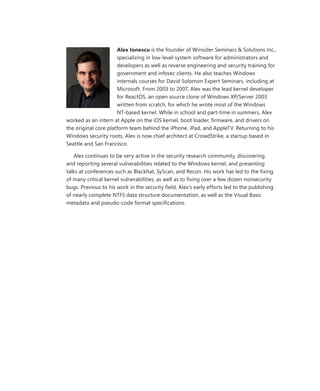
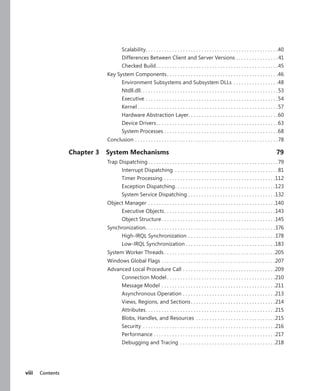
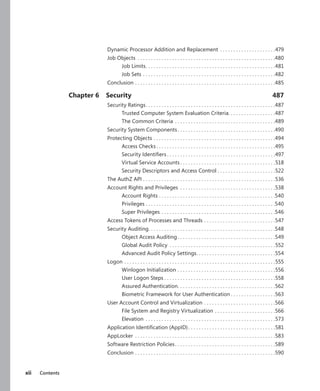
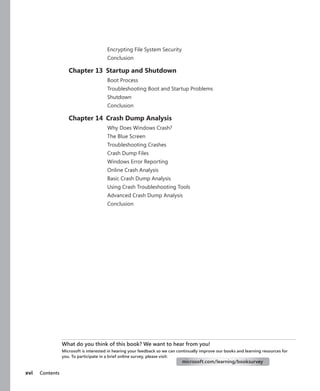
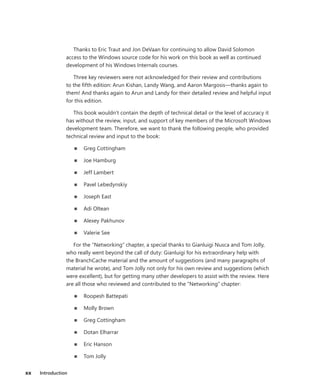
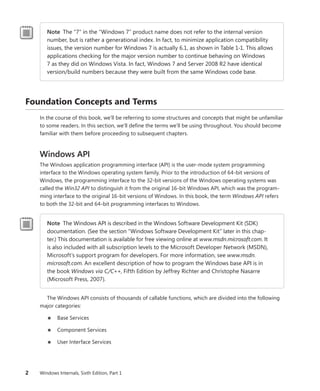
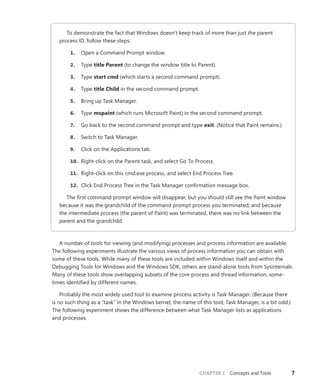
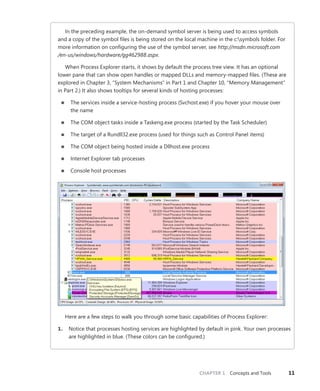
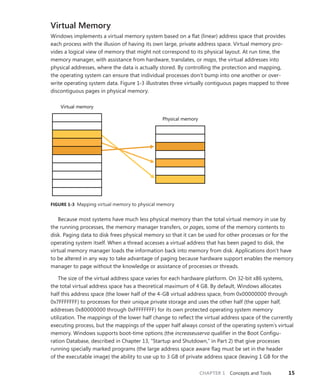
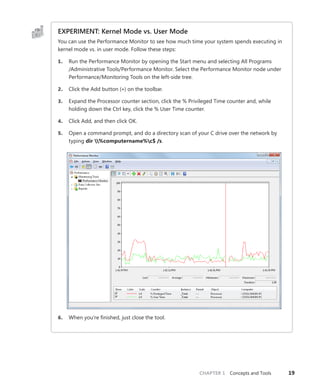
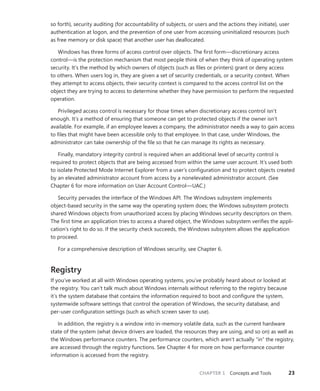
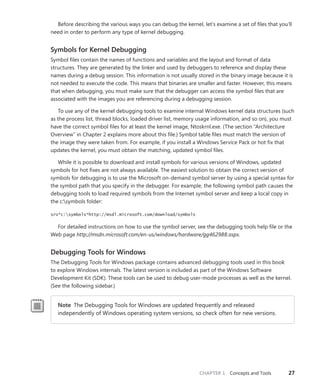
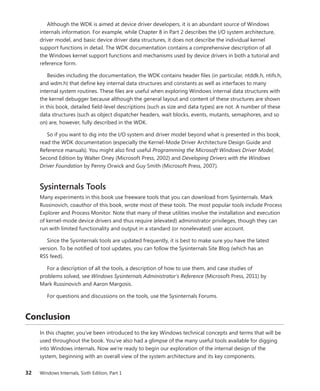
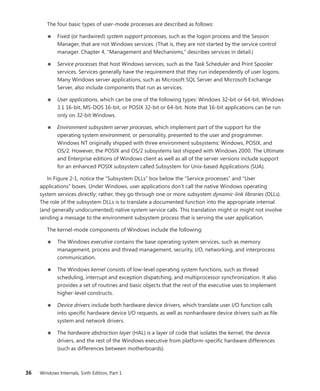
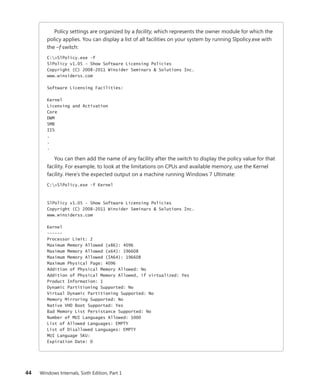
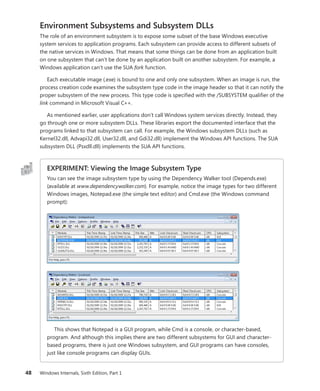
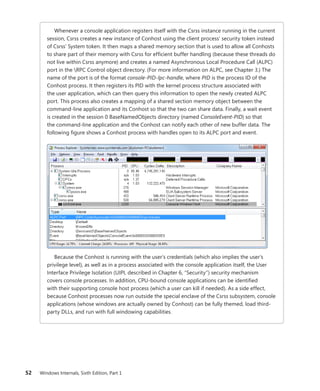
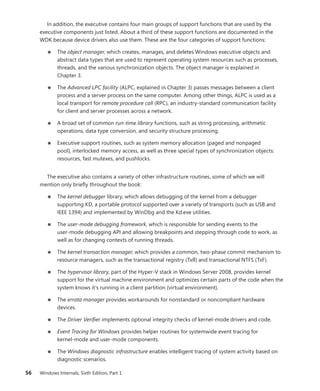
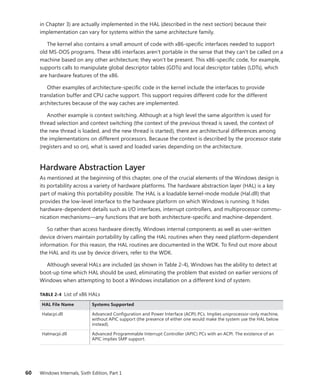
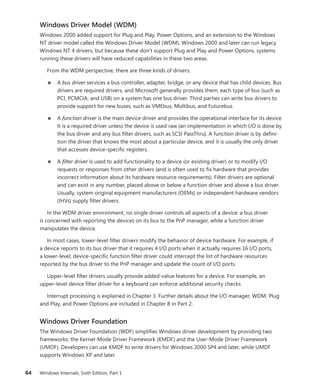
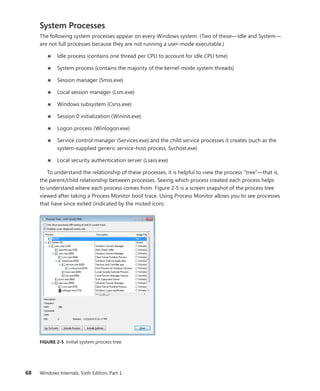
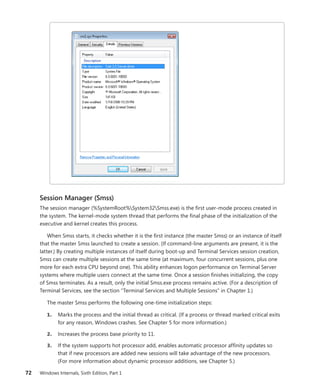
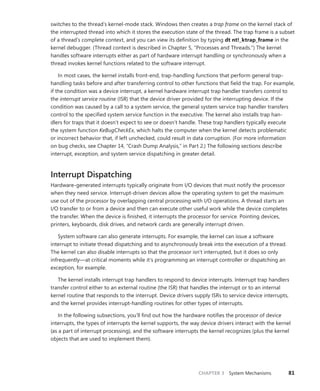
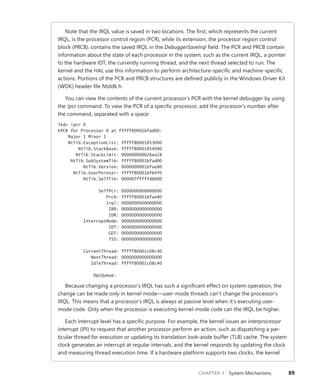
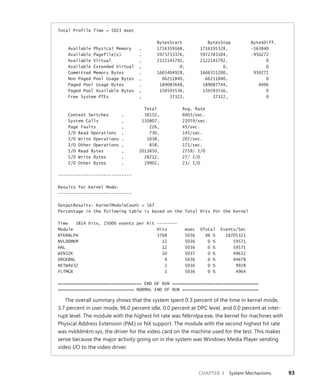
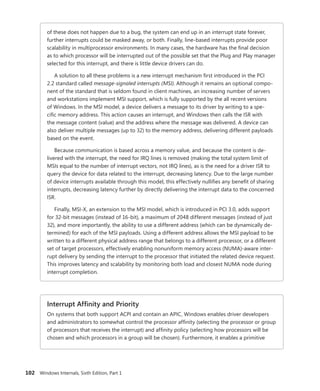
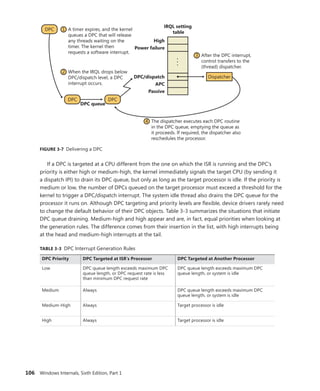
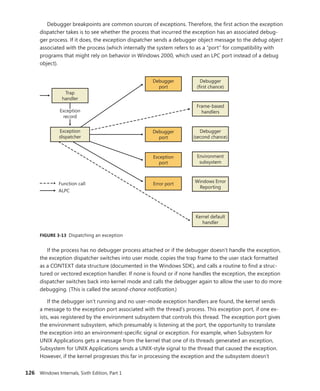
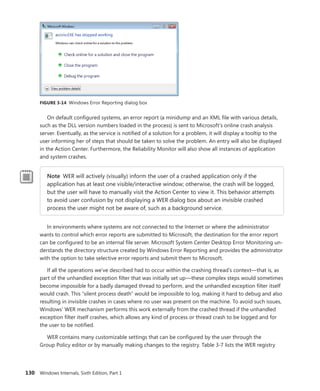
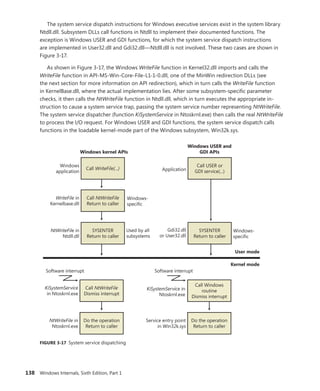
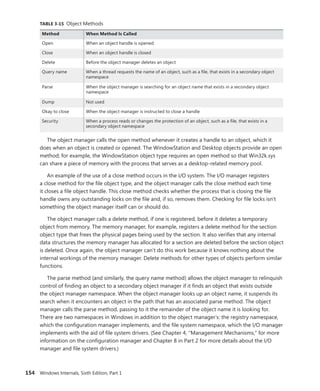
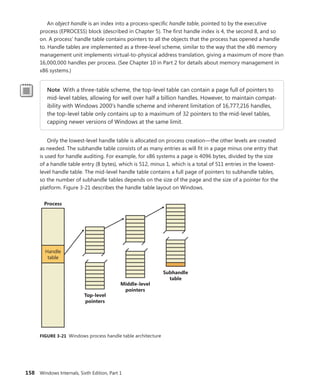
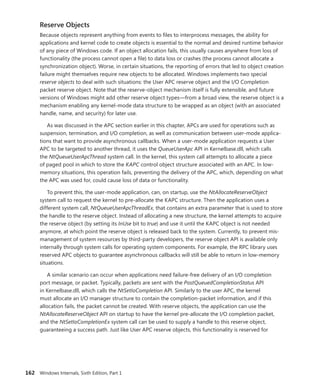
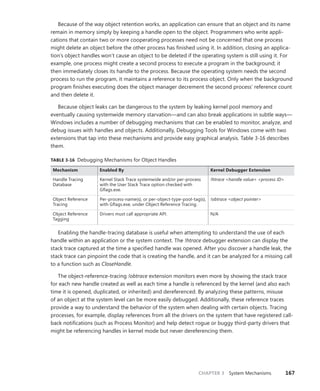
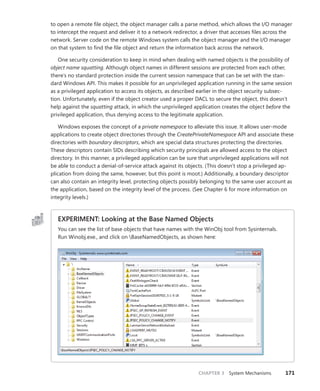
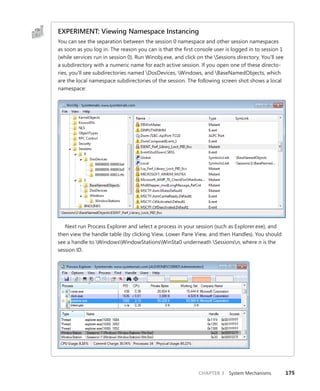
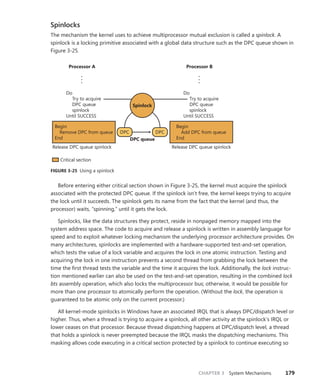
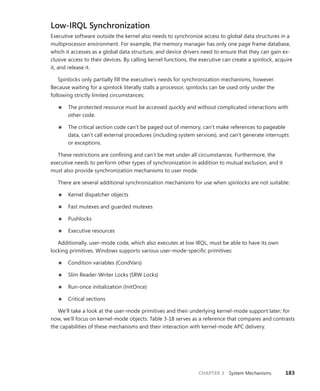
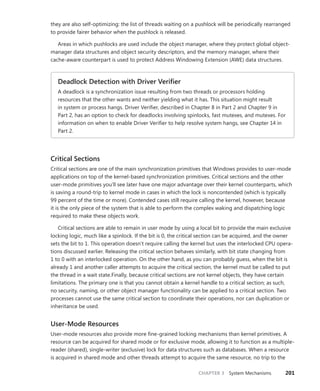
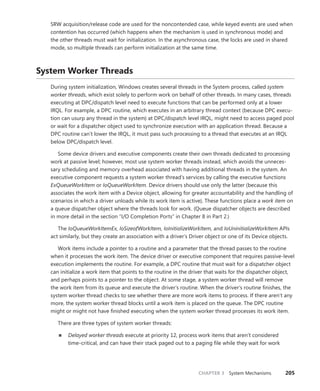
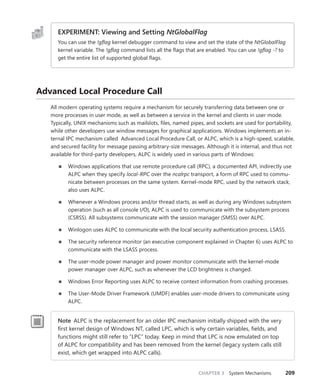
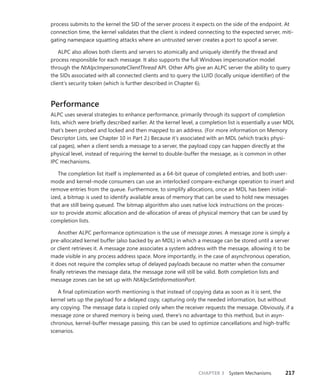
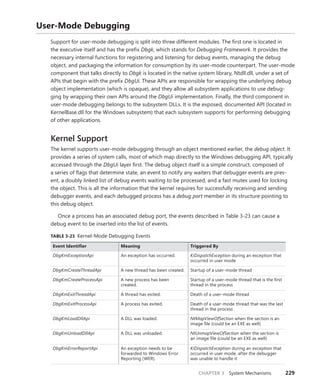
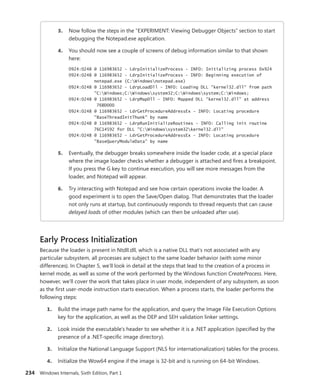
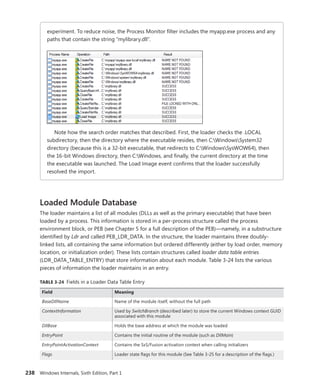
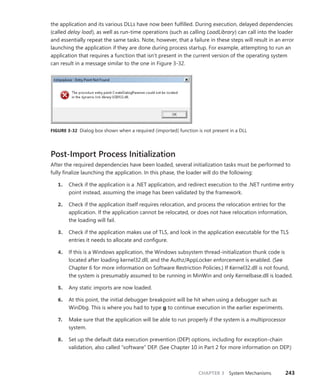
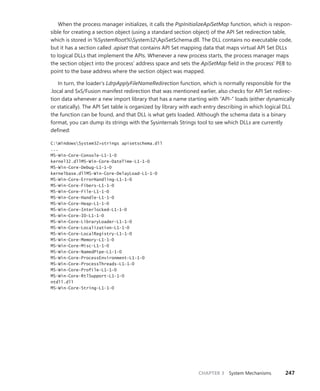
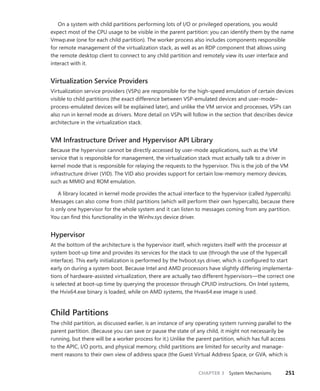
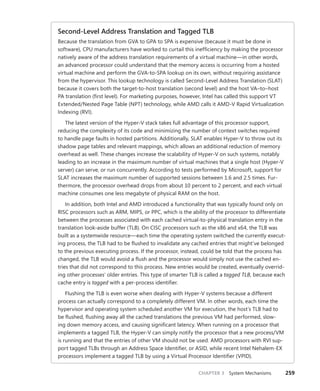
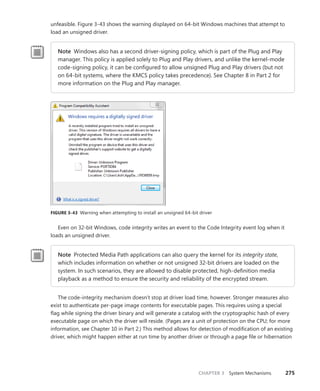
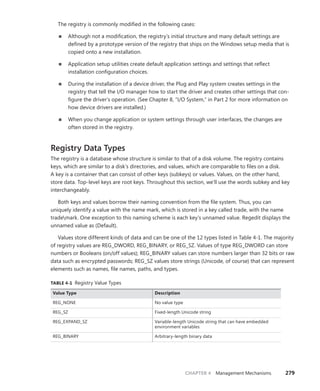
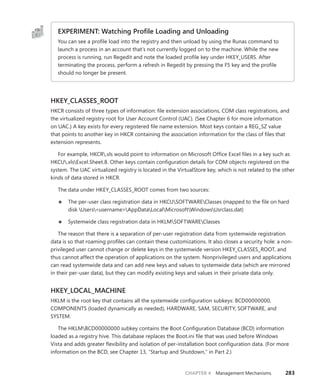
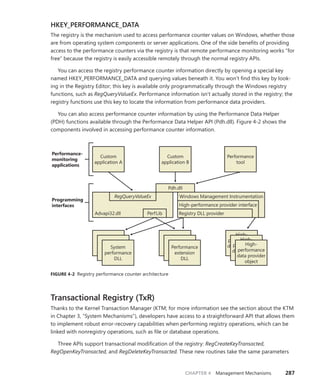
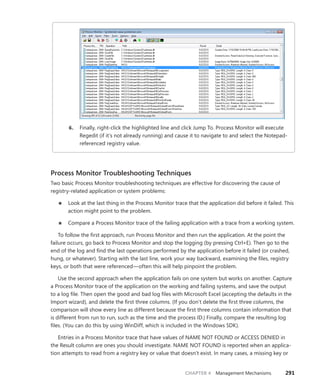
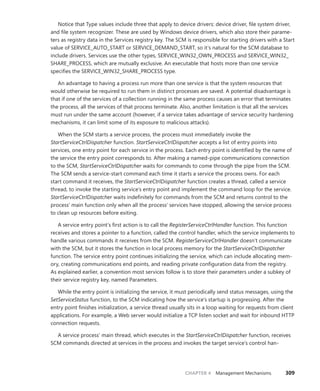
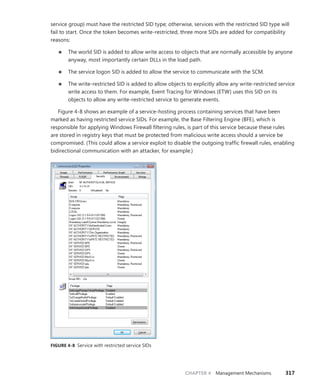
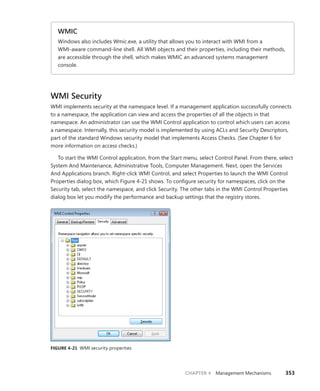
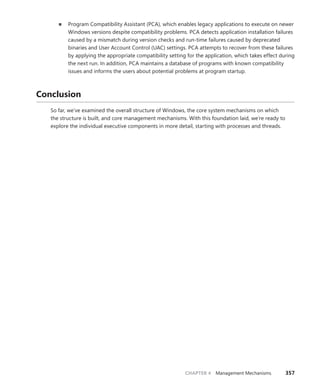
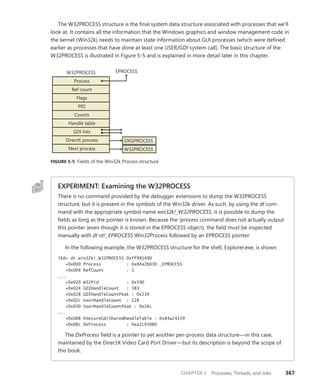
Then you can use dt to format a specific structure as shown next:
lkd> dt nt!_kinterrupt
nt!_KINTERRUPT
+0x000 Type : Int2B
+0x002 Size : Int2B
+0x008 InterruptListEntry : _LIST_ENTRY
+0x018 ServiceRoutine : Ptr64 unsigned char
+0x020 MessageServiceRoutine : Ptr64 unsigned char
+0x028 MessageIndex : Uint4B
+0x030 ServiceContext : Ptr64 Void
+0x038 SpinLock : Uint8B
+0x040 TickCount : Uint4B
+0x048 ActualLock : Ptr64 Uint8B
+0x050 DispatchAddress : Ptr64 void
+0x058 Vector : Uint4B
+0x05c Irql : UChar
+0x05d SynchronizeIrql : UChar
+0x05e FloatingSave : UChar
+0x05f Connected : UChar
+0x060 Number : Uint4B
+0x064 ShareVector : UChar
+0x065 Pad : [3] Char
+0x068 Mode : _KINTERRUPT_MODE
+0x06c Polarity : _KINTERRUPT_POLARITY
+0x070 ServiceCount : Uint4B
+0x074 DispatchCount : Uint4B
+0x078 Rsvd1 : Uint8B
+0x080 TrapFrame : Ptr64 _KTRAP_FRAME
+0x088 Reserved : Ptr64 Void
+0x090 DispatchCode : [4] Uint4B
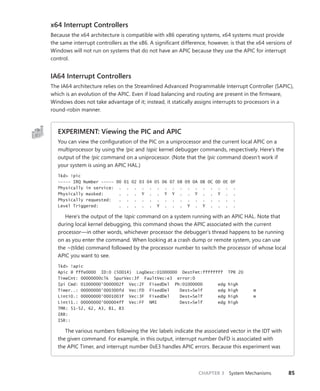
Note that dt does not show substructures (structures within structures) by default. To recurse
through substructures, use the –r switch. For example, using this switch to display the kernel
interrupt object shows the format of the _LIST_ENTRY structure stored at the InterruptListEntry
field:
lkd> dt nt!_kinterrupt -r
nt!_KINTERRUPT
+0x000 Type : Int2B
+0x002 Size : Int2B
+0x008 InterruptListEntry : _LIST_ENTRY
+0x000 Flink : Ptr64 _LIST_ENTRY
+0x000 Flink : Ptr64 _LIST_ENTRY
+0x008 Blink : Ptr64 _LIST_ENTRY
+0x008 Blink : Ptr64 _LIST_ENTRY
+0x000 Flink : Ptr64 _LIST_ENTRY
+0x008 Blink : Ptr64 _LIST_ENTRY](https://image.slidesharecdn.com/windowsinternalspart16thedition-230122041507-daca5e1d/85/Windows-Internals-Part-1_6th-Edition-pdf-52-320.jpg)
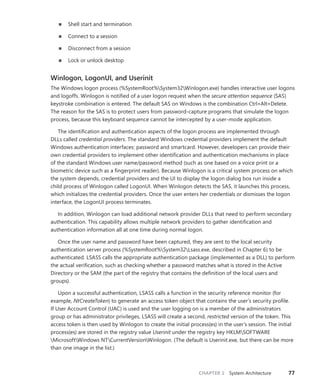

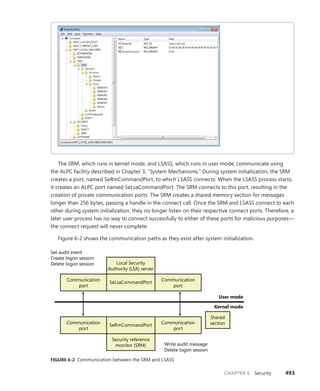
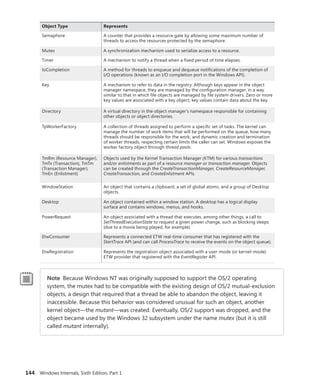
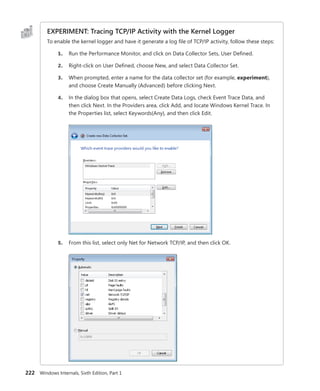
![CHAPTER 3 System Mechanisms 97
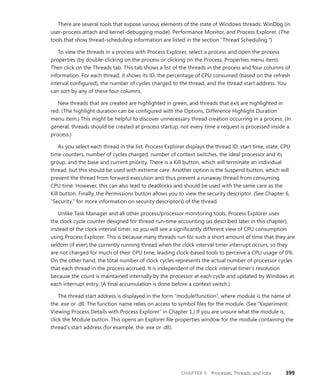
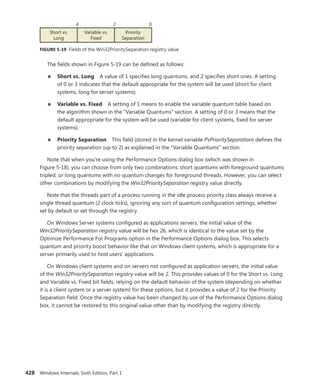
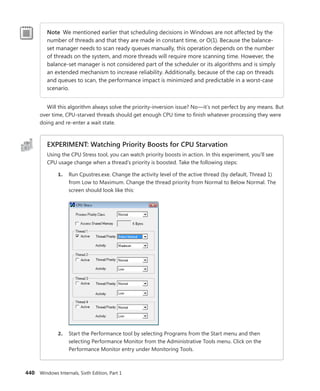
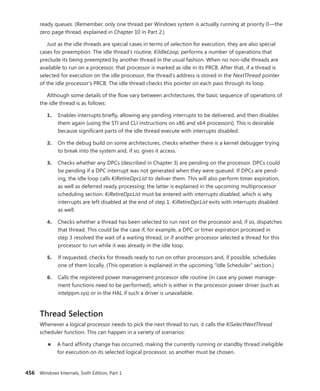
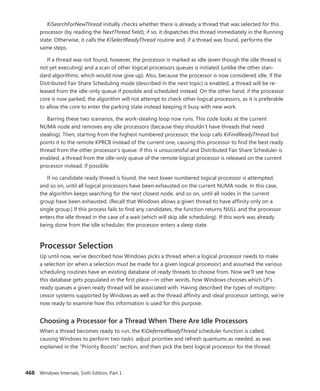
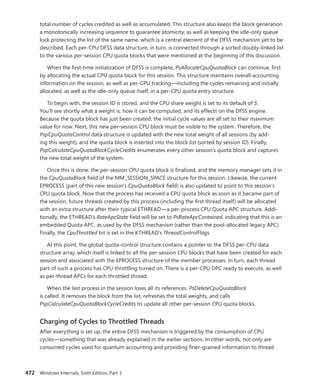
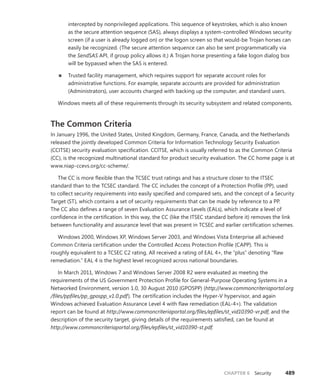
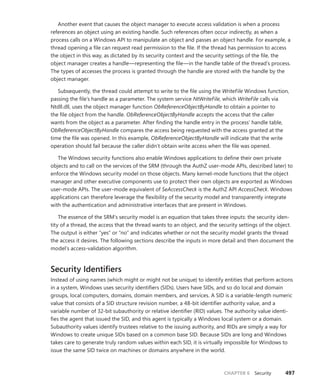
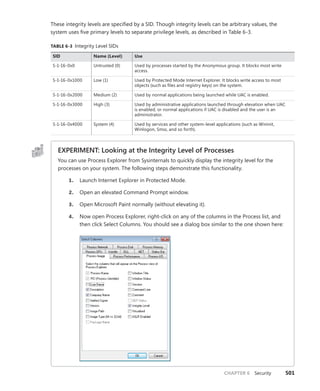
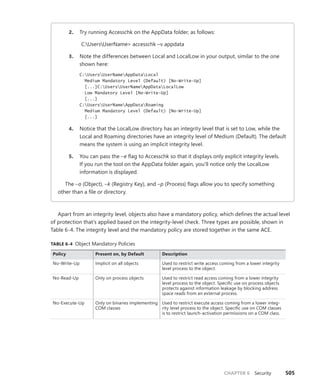
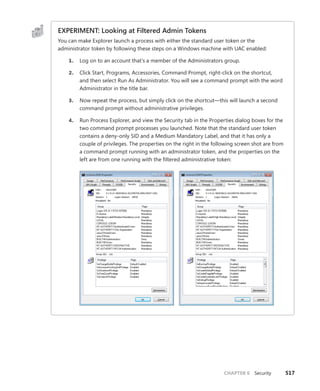
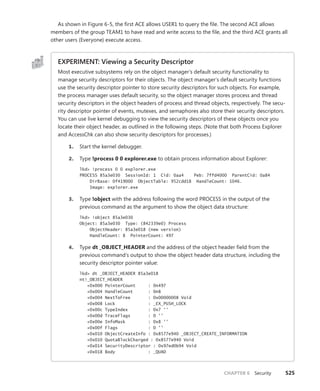
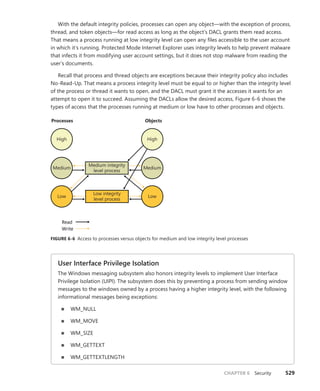
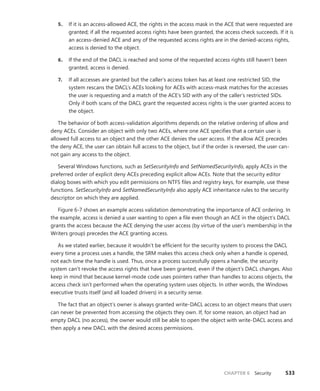
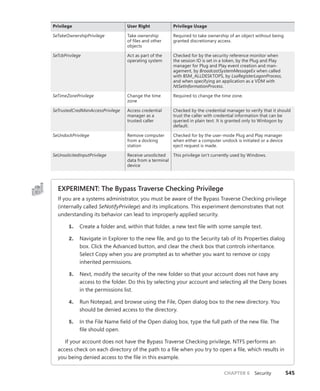
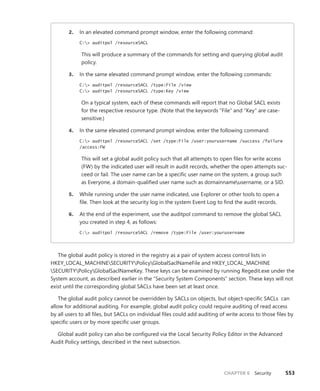
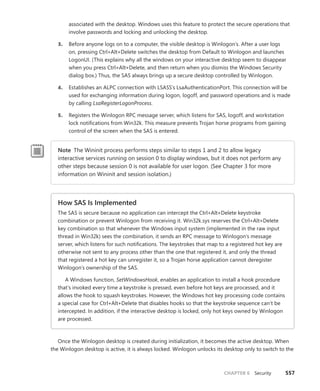
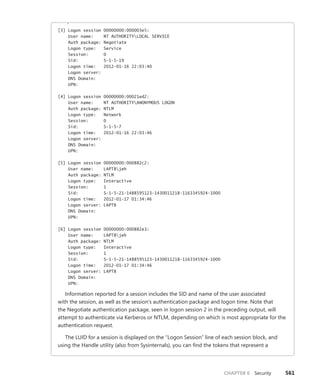
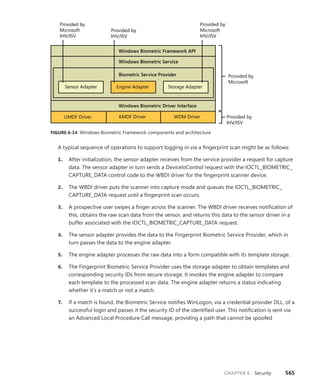
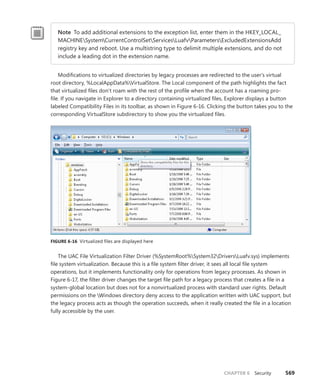
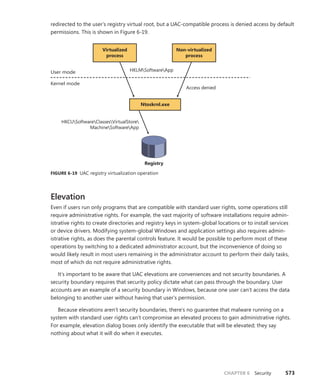
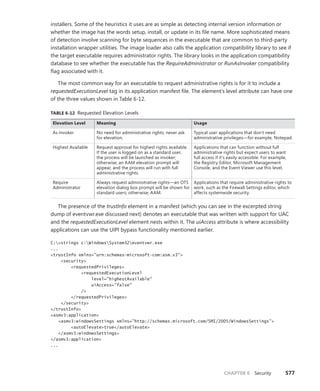
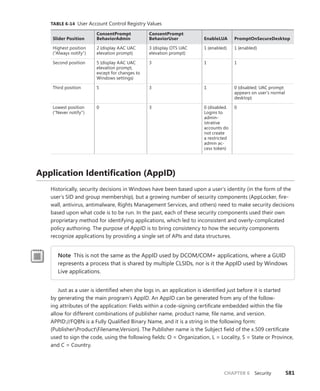
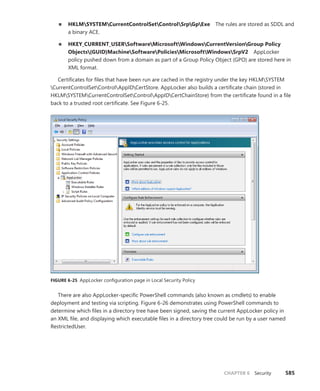
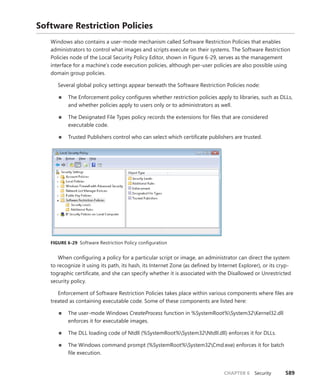
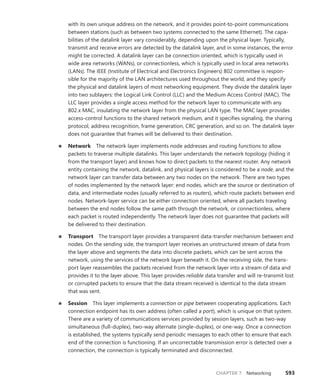
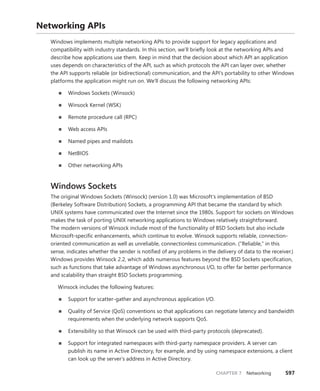
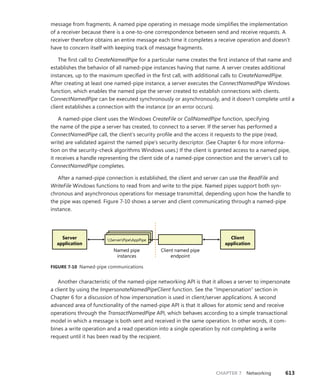
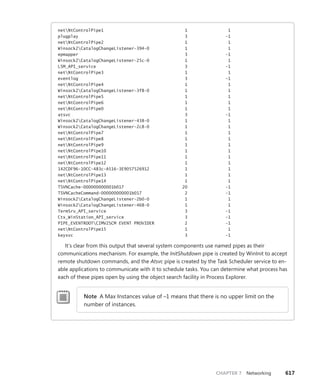
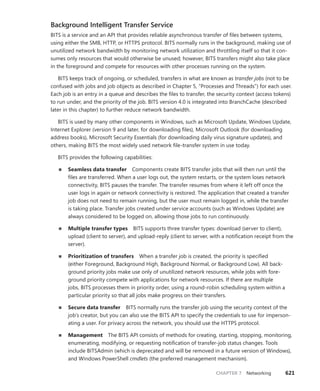
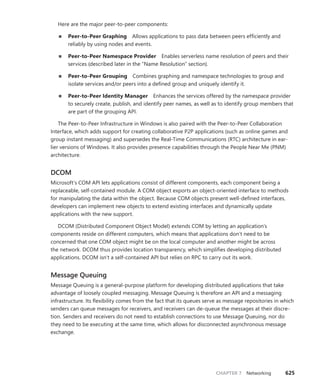
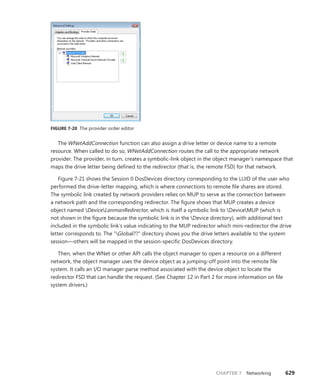
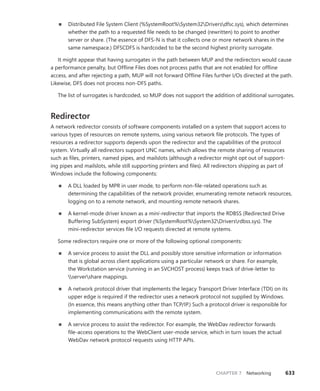
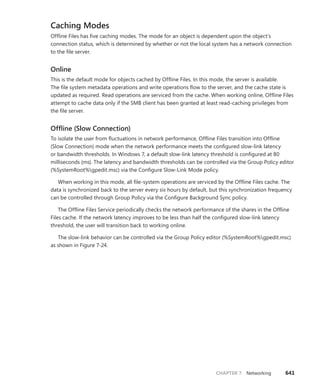
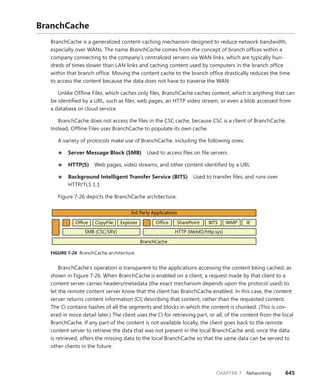
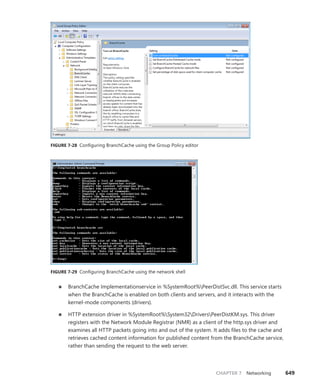
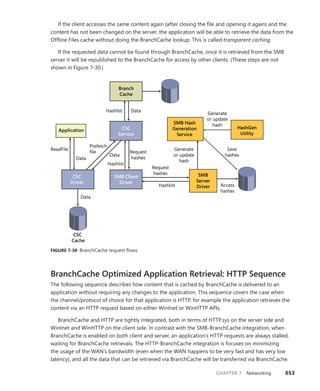
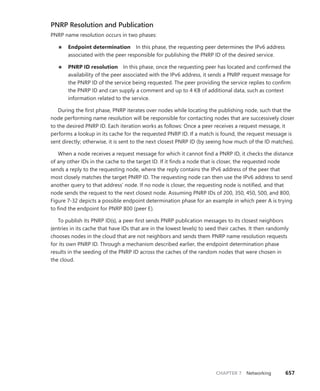
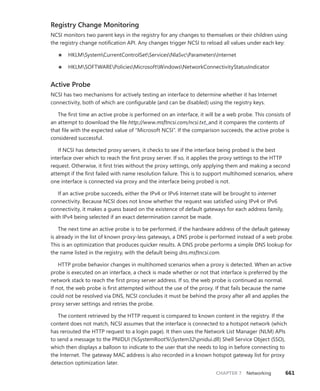
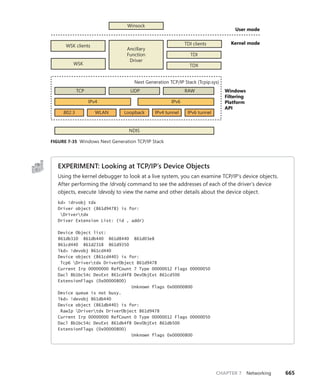
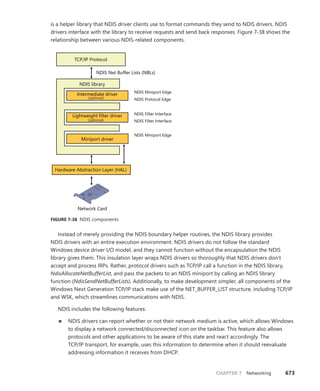
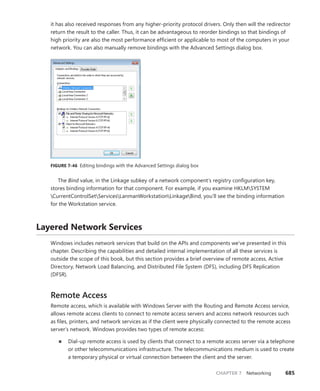
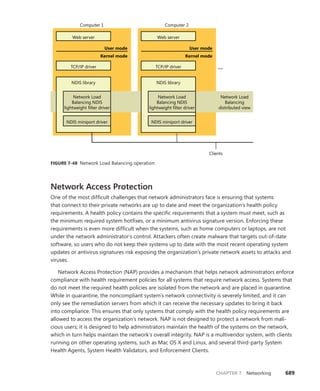
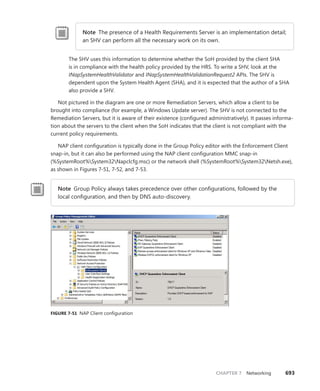
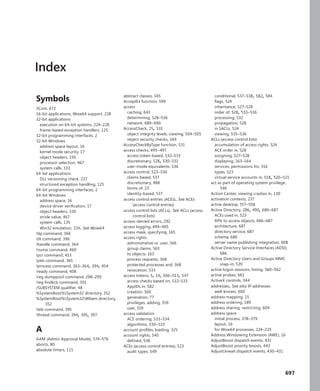
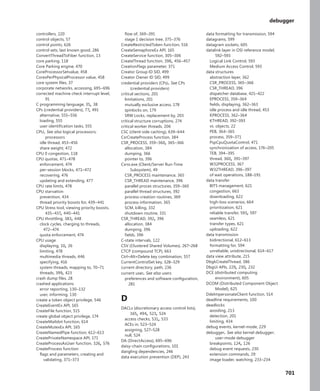
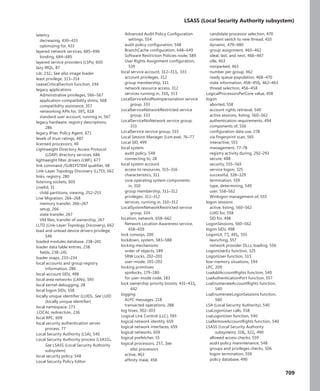
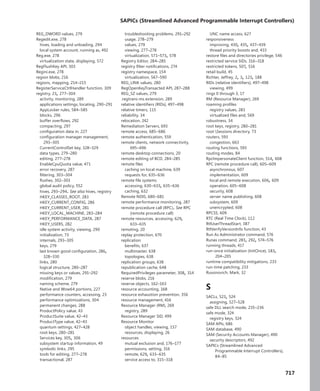
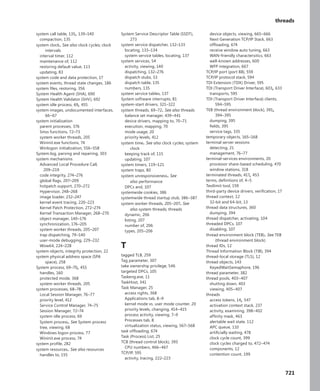
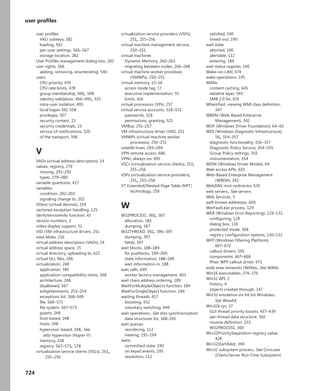
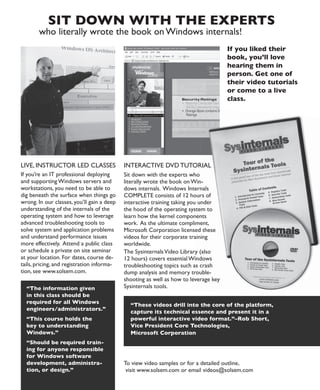
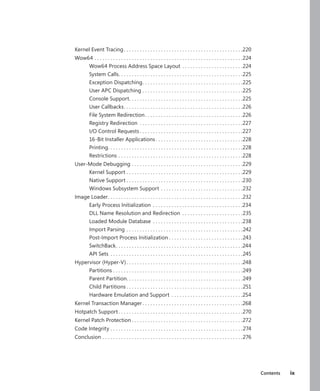
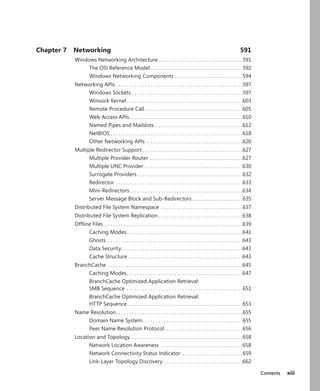
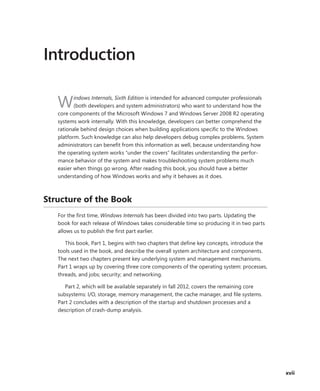
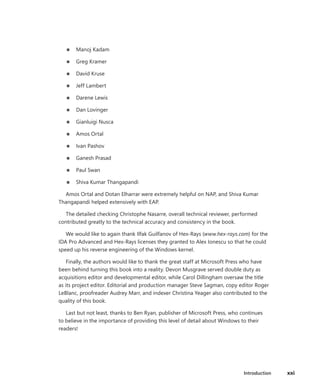
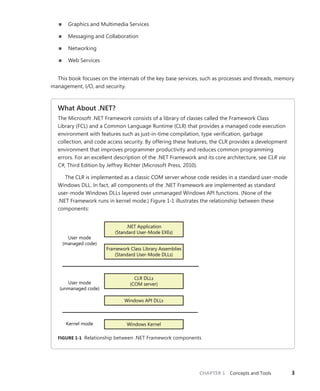
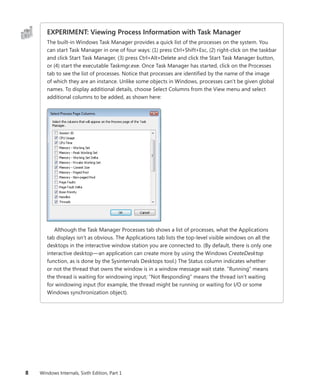
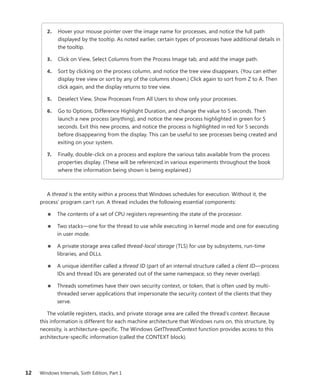
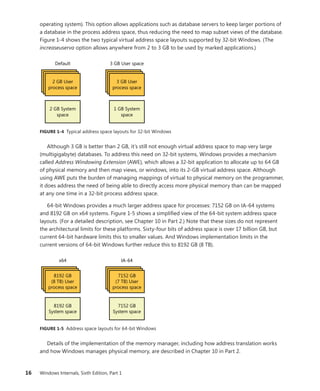
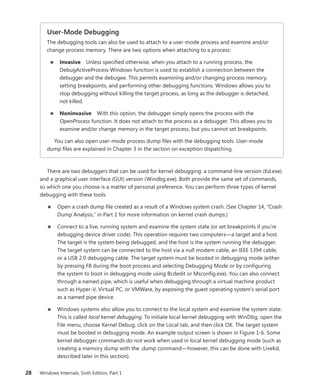
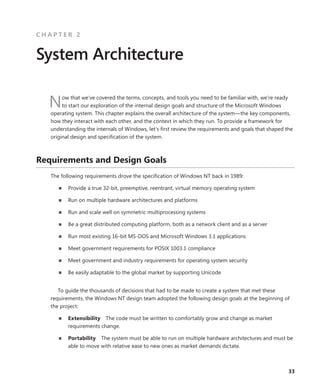
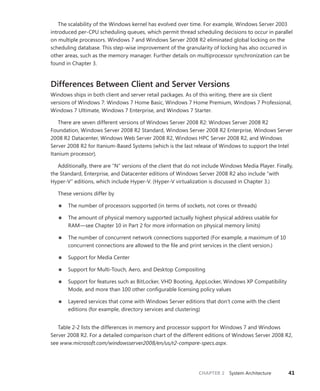
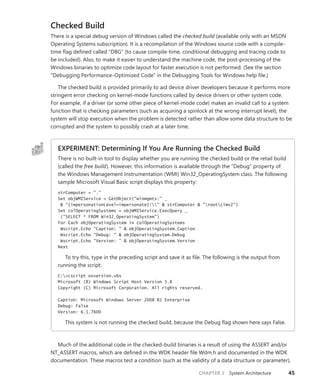
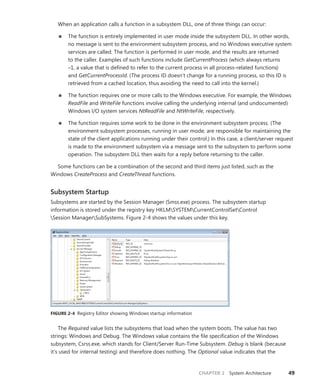
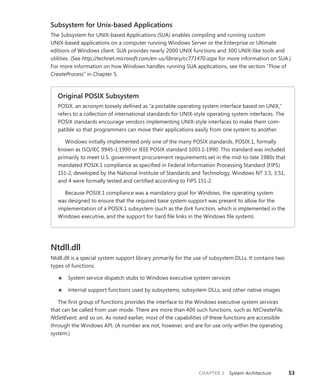
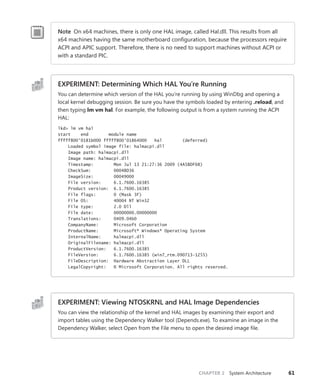
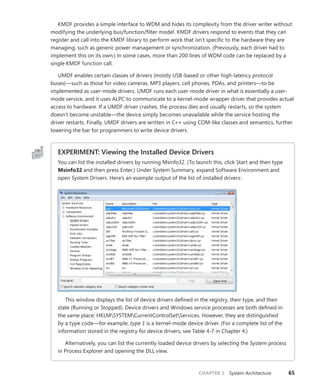
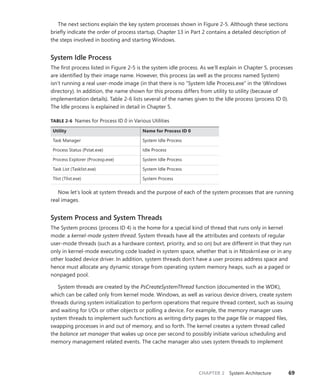
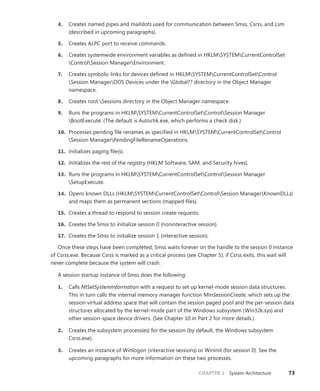
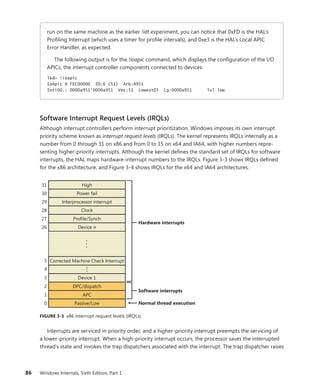
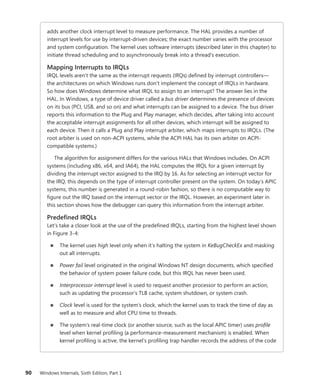
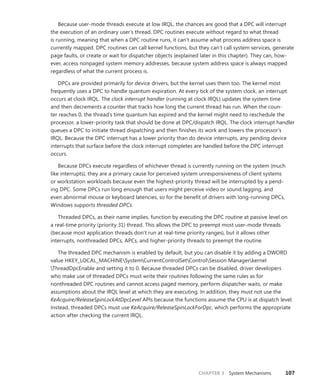
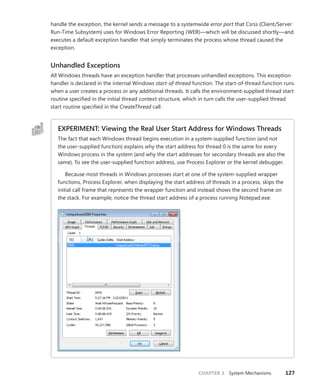
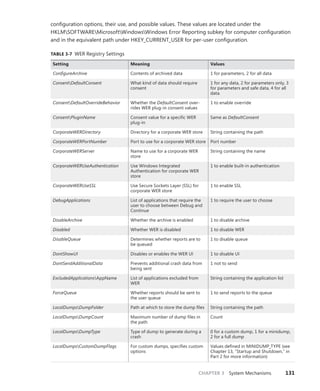
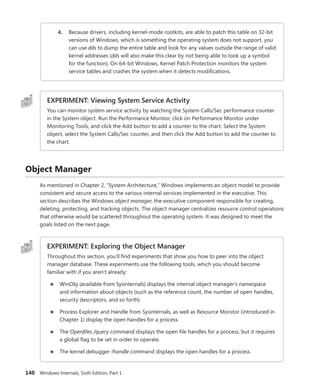
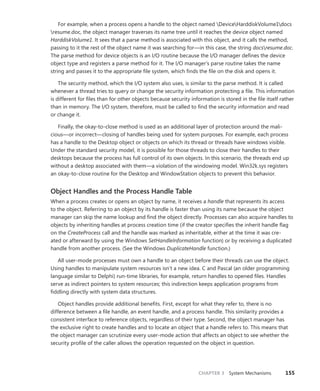
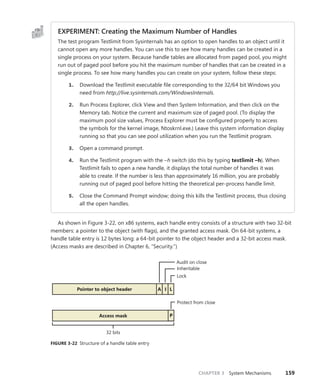
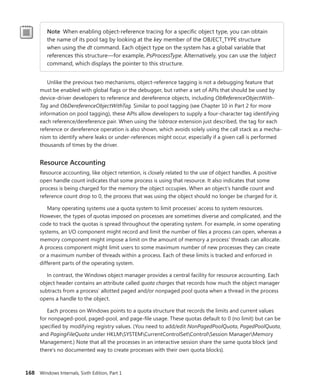
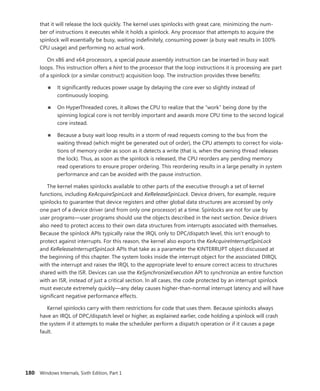
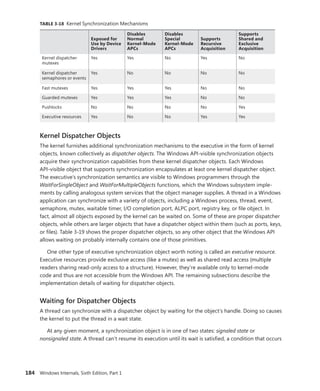
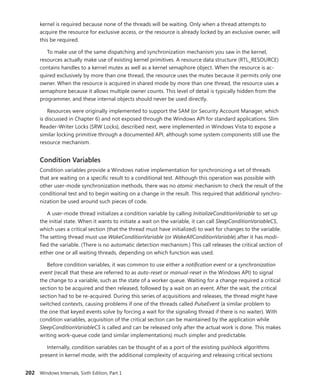
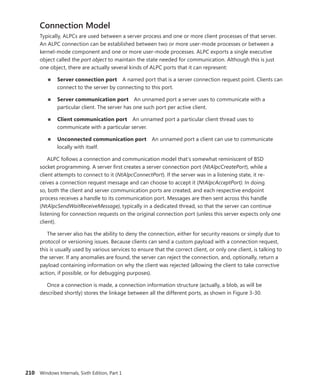
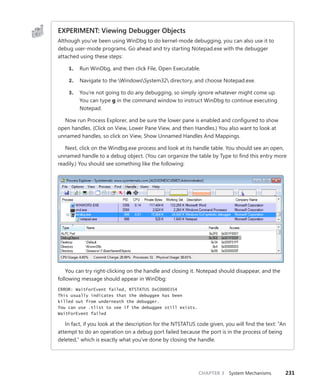
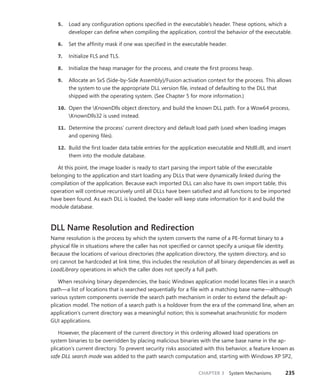
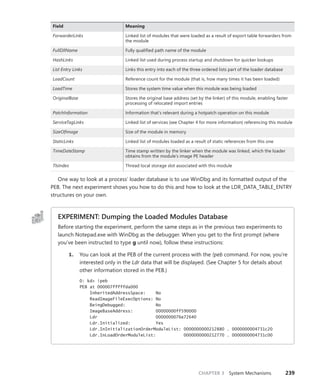
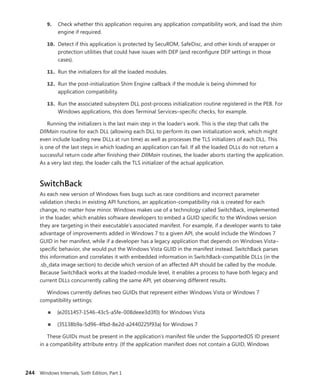
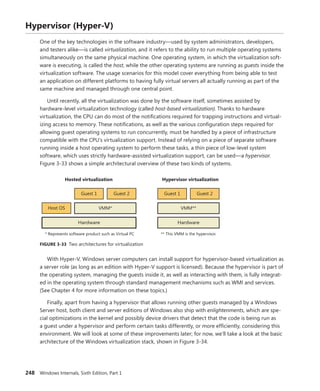
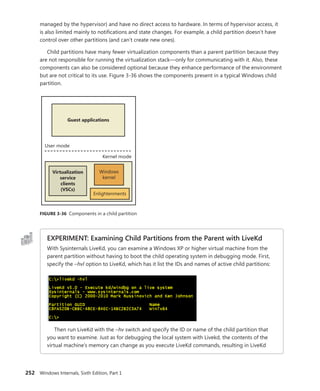
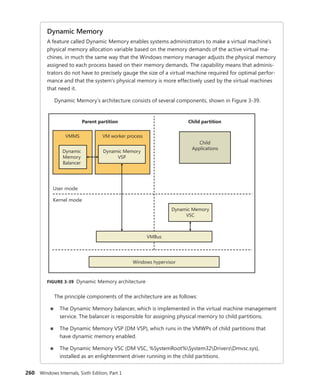
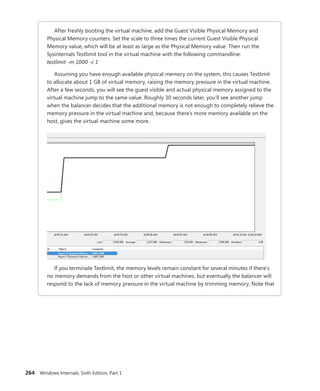
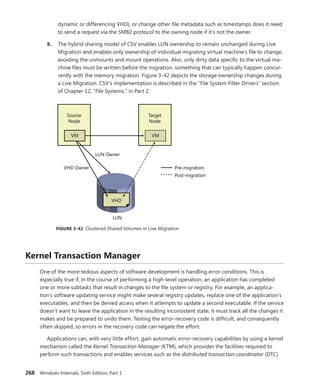
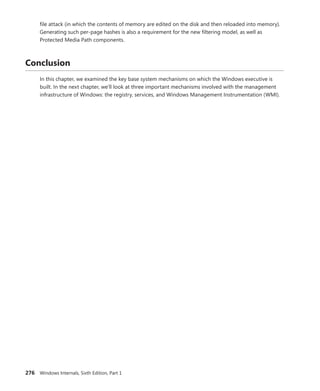
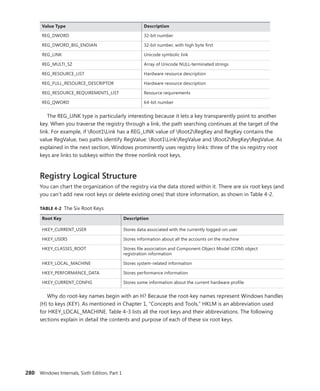
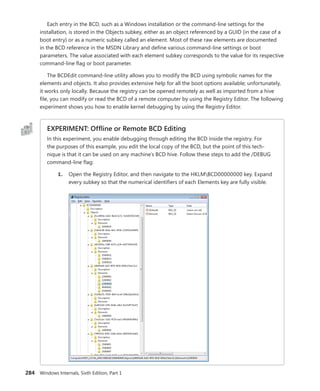
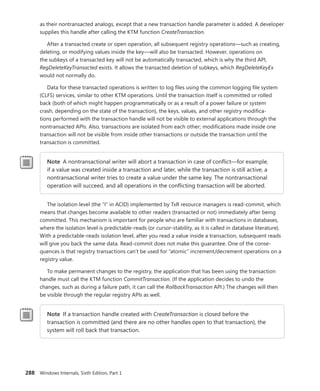
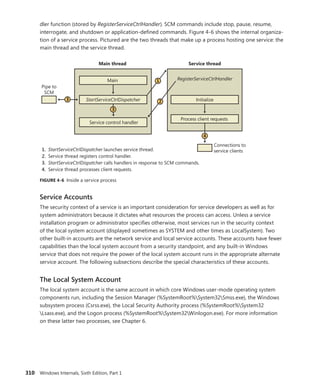
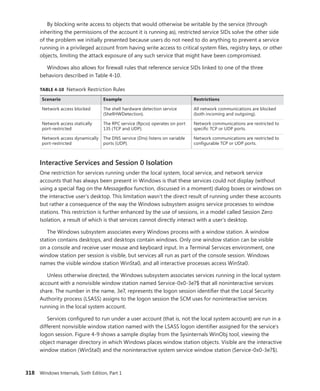
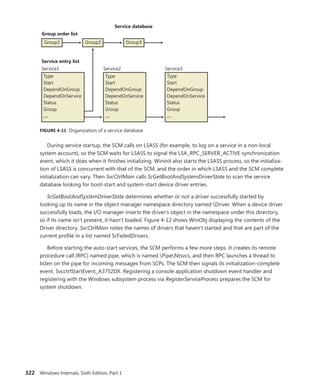
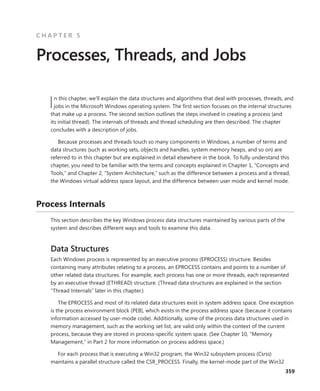
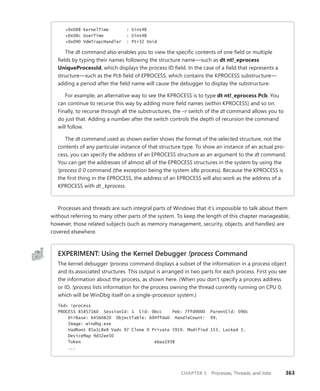
EXPERIMENT: Examining Interrupt Internals
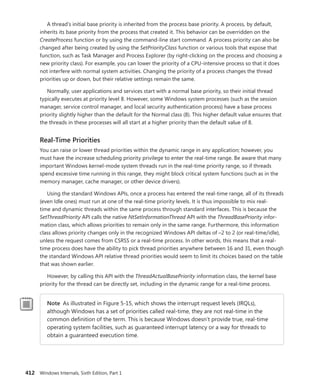
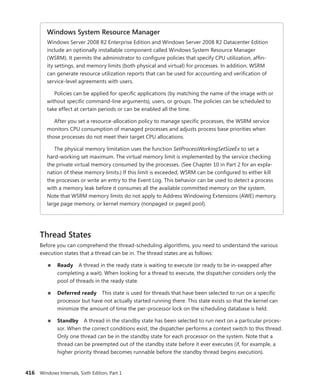
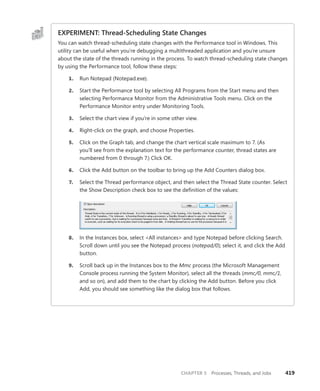
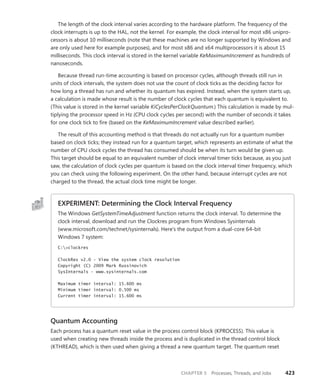
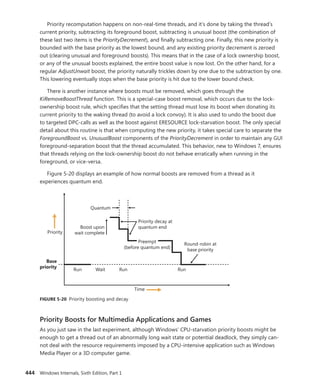
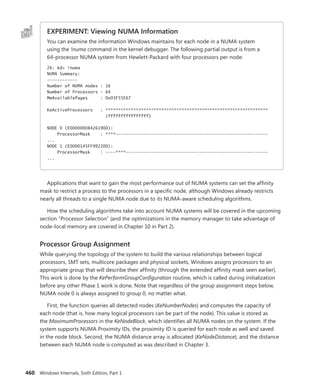
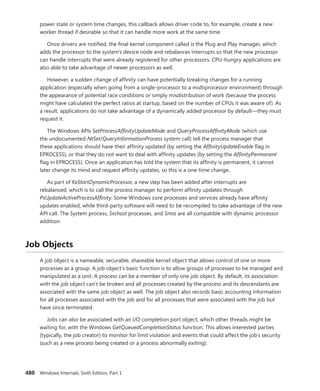
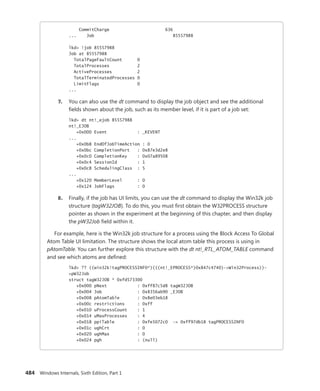
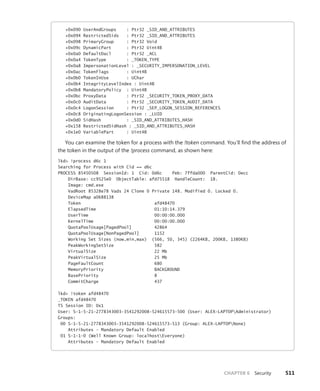
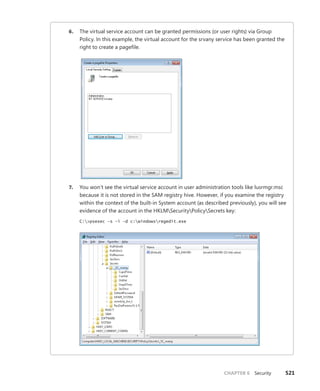
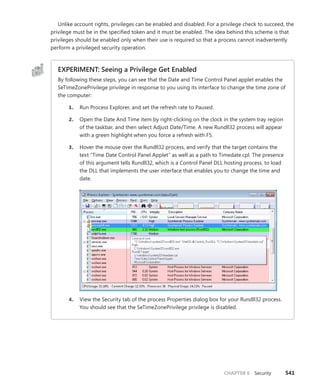
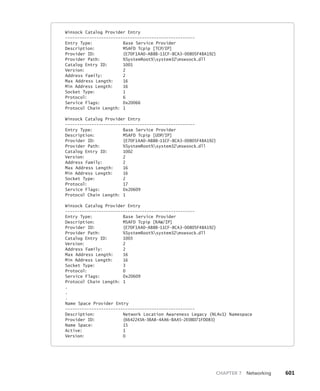
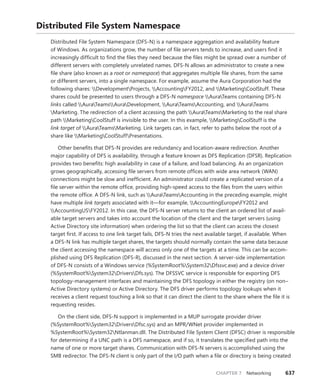
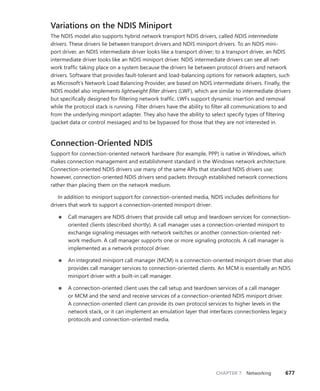
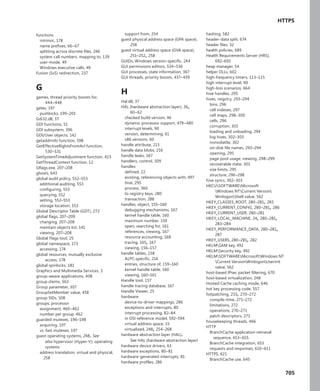
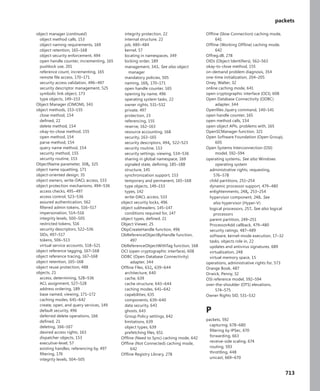
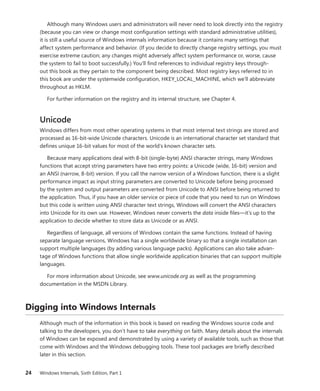
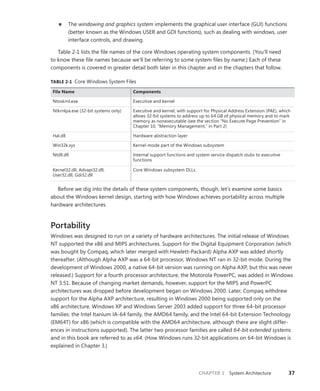
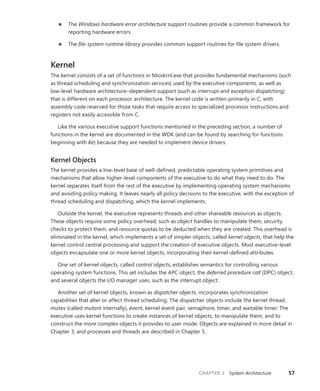
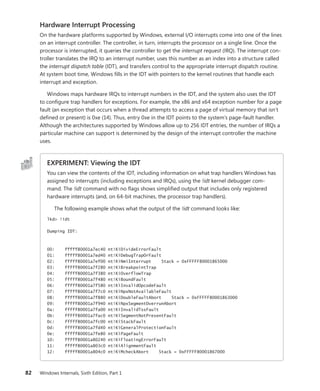
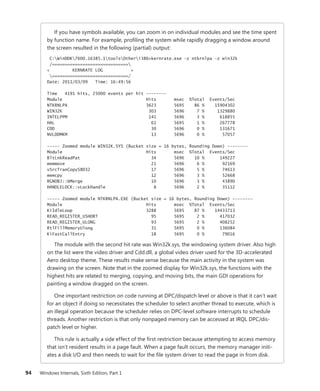
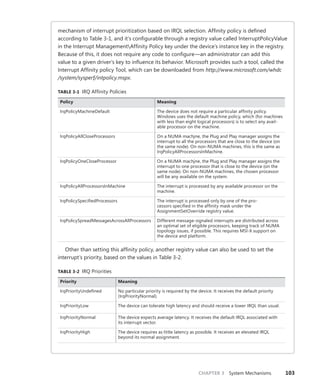
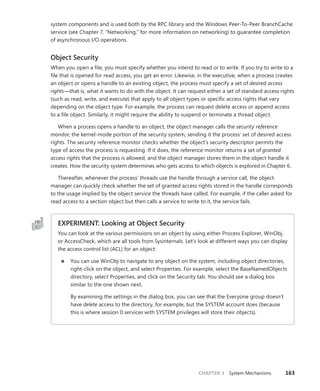
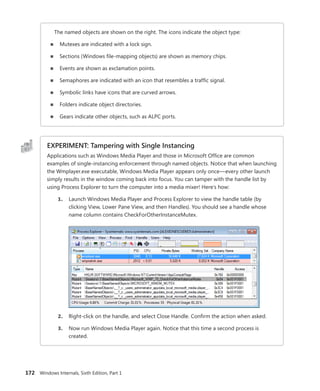
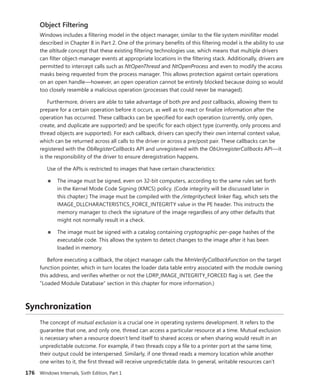
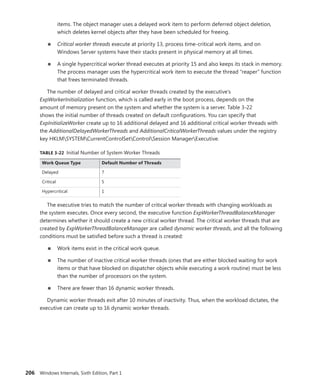
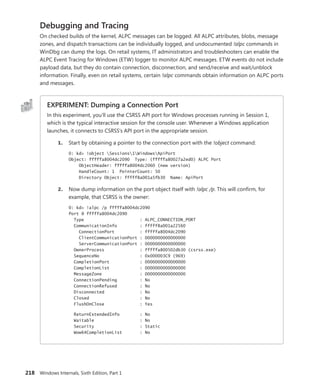
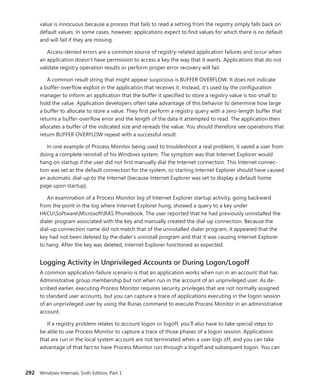
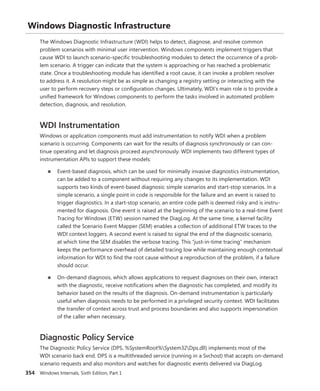
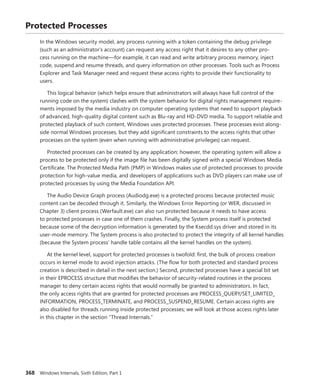
Using the kernel debugger, you can view details of an interrupt object, including its IRQL, ISR
address, and custom interrupt-dispatching code. First, execute the !idt command and locate the
entry that includes a reference to I8042KeyboardInterruptService, the ISR routine for the PS2
keyboard device:
81: fffffa80045bae10 i8042prt!I8042KeyboardInterruptService (KINTERRUPT
fffffa80045bad80)
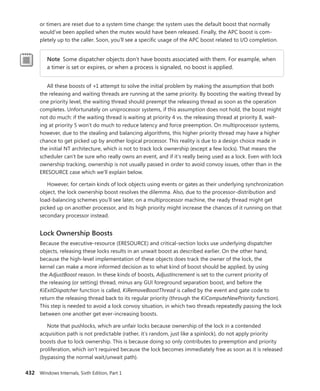
To view the contents of the interrupt object associated with the interrupt, execute
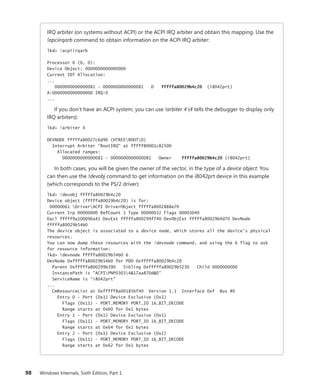
dt nt!_kinterrupt with the address following KINTERRUPT:
lkd> dt nt!_KINTERRUPT fffffa80045bad80
+0x000 Type : 22
+0x002 Size : 160
+0x008 InterruptListEntry : _LIST_ENTRY [ 0x00000000'00000000 - 0x0 ]
+0x018 ServiceRoutine : 0xfffff880'0356ca04 unsigned char
i8042prt!I8042KeyboardInterruptService+0
+0x020 MessageServiceRoutine : (null)
+0x028 MessageIndex : 0
+0x030 ServiceContext : 0xfffffa80'02c839f0
+0x038 SpinLock : 0
+0x040 TickCount : 0
+0x048 ActualLock : 0xfffffa80'02c83b50 -> 0
+0x050 DispatchAddress : 0xfffff800'01a7db90 void nt!KiInterruptDispatch+0
+0x058 Vector : 0x81
+0x05c Irql : 0x8 ''
+0x05d SynchronizeIrql : 0x9 ''
+0x05e FloatingSave : 0 ''
+0x05f Connected : 0x1 ''
+0x060 Number : 0
+0x064 ShareVector : 0 ''
+0x065 Pad : [3] ""
+0x068 Mode : 1 ( Latched )
+0x06c Polarity : 0 ( InterruptPolarityUnknown )
+0x070 ServiceCount : 0
+0x074 DispatchCount : 0
+0x078 Rsvd1 : 0
+0x080 TrapFrame : 0xfffff800'0185ab00 _KTRAP_FRAME
+0x088 Reserved : (null)
+0x090 DispatchCode : [4] 0x8d485550
In this example, the IRQL that Windows assigned to the interrupt is 8. Although there is
no direct mapping between an interrupt vector and an IRQ, Windows does keep track of this
translation when managing device resources through what are called arbiters. For each resource
type, an arbiter maintains the relationship between virtual resource usage (such as an interrupt
vector) and physical resources (such as an interrupt line). As such, you can query either the root](https://image.slidesharecdn.com/windowsinternalspart16thedition-230122041507-daca5e1d/85/Windows-Internals-Part-1_6th-Edition-pdf-119-320.jpg)
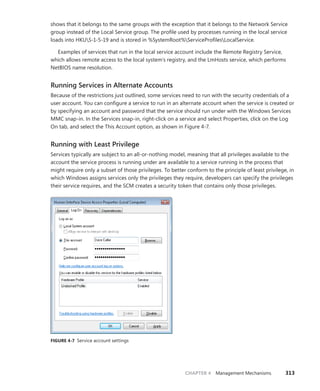
![114 Windows Internals, Sixth Edition, Part 1
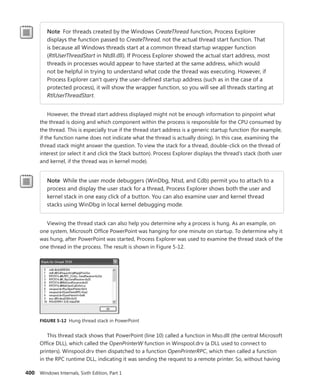
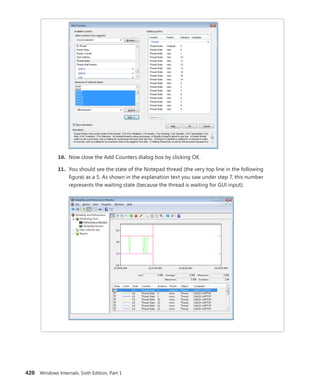
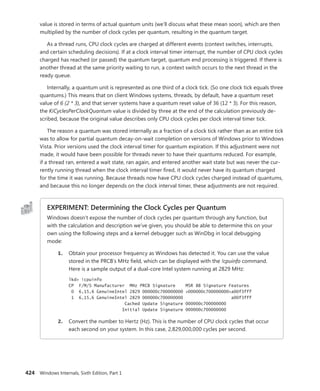
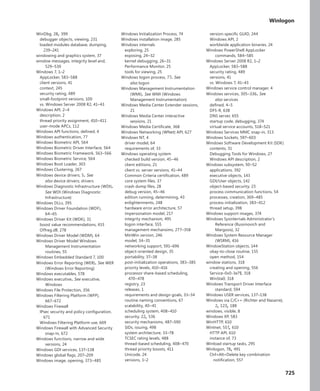
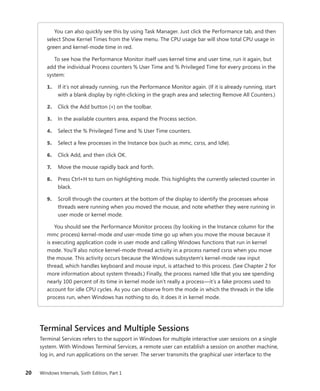
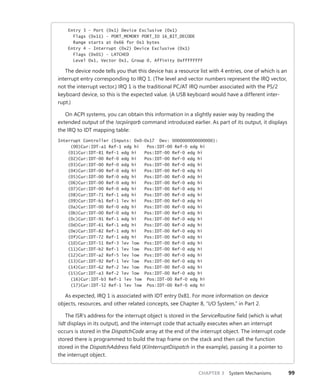
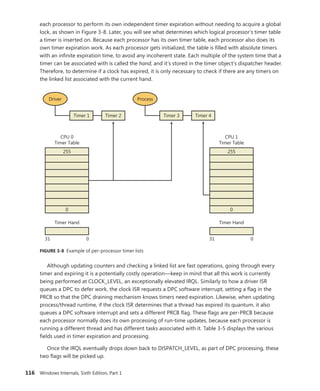
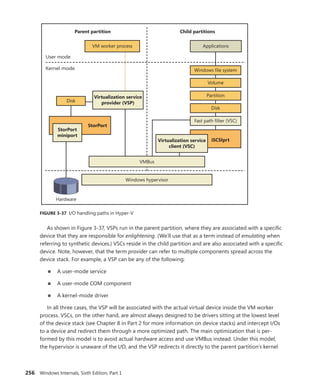
Scroll down to the section on Platform Timer Resolution, and you will be shown all the
applications that have modified the timer resolution and are still active, along with the call
stacks that caused this call. Timer resolutions are shown in hundreds of nanoseconds, so
a
period of 20,000 corresponds to 2 ms. In the sample shown, two applications—namely,
Microsoft PowerPoint and the UltraVNC remote desktop server—each requested a higher
resolution.
You can also use the debugger to obtain this information. For each process, the EPROCESS
structure contains a number of fields, shown next, that help identify changes in timer resolution:
+0x4a8 TimerResolutionLink : _LIST_ENTRY [ 0xfffffa80'05218fd8 - 0xfffffa80'059cd508 ]
+0x4b8 RequestedTimerResolution : 0
+0x4bc ActiveThreadsHighWatermark : 0x1d
+0x4c0 SmallestTimerResolution : 0x2710
+0x4c8 TimerResolutionStackRecord : 0xfffff8a0'0476ecd0 _PO_DIAG_STACK_RECORD
Note that the debugger shows you an additional piece of information: the smallest timer
resolution that was ever requested by a given process. In this example, the process shown cor-
responds to PowerPoint 2010, which typically requests a lower timer resolution during slide-
shows, but not during slide editing mode. The EPROCESS fields of PowerPoint, shown in the
preceding code, prove this, and the stack could be parsed by dumping the PO_DIAG_STACK_
RECORD structure.
Finally, the TimerResolutionLink field connects all processes that have made changes to timer
resolution, through the ExpTimerResolutionListHead doubly linked list. Parsing this list with
the !list debugger command can reveal all processes on the system that have, or had, made
changes to the timer resolution, when the powercfg command is unavailable or information on
past processes is required:
lkd> !list "-e -x "dt nt!_EPROCESS @$extret-@@(#FIELD_OFFSET(nt!_EPROCESS,
TimerResolutionLink))
ImageFileName SmallestTimerResolution RequestedTimerResolution"
nt!ExpTimerResolutionListHead"
dt nt!_EPROCESS @$extret-@@(#FIELD_OFFSET(nt!_EPROCESS, TimerResolutionLink))
ImageFileName
SmallestTimerResolution RequestedTimerResolution
+0x2e0 ImageFileName : [15] "audiodg.exe"
+0x4b8 RequestedTimerResolution : 0
+0x4c0 SmallestTimerResolution : 0x2710
dt nt!_EPROCESS @$extret-@@(#FIELD_OFFSET(nt!_EPROCESS, TimerResolutionLink))
ImageFileName
SmallestTimerResolution RequestedTimerResolution
+0x2e0 ImageFileName : [15] "chrome.exe"
+0x4b8 RequestedTimerResolution : 0
+0x4c0 SmallestTimerResolution : 0x2710
dt nt!_EPROCESS @$extret-@@(#FIELD_OFFSET(nt!_EPROCESS, TimerResolutionLink))
ImageFileName
SmallestTimerResolution RequestedTimerResolution](https://image.slidesharecdn.com/windowsinternalspart16thedition-230122041507-daca5e1d/85/Windows-Internals-Part-1_6th-Edition-pdf-136-320.jpg)
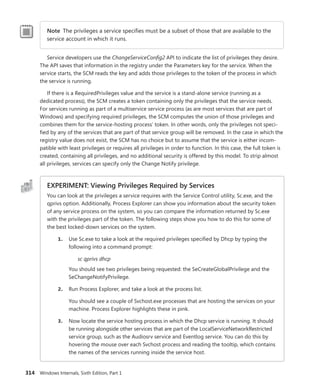
![CHAPTER 3 System Mechanisms 115
+0x2e0 ImageFileName : [15] "calc.exe"
+0x4b8 RequestedTimerResolution : 0
+0x4c0 SmallestTimerResolution : 0x2710
dt nt!_EPROCESS @$extret-@@(#FIELD_OFFSET(nt!_EPROCESS, TimerResolutionLink))
ImageFileName
SmallestTimerResolution RequestedTimerResolution
+0x2e0 ImageFileName : [15] "devenv.exe"
+0x4b8 RequestedTimerResolution : 0
+0x4c0 SmallestTimerResolution : 0x2710
dt nt!_EPROCESS @$extret-@@(#FIELD_OFFSET(nt!_EPROCESS, TimerResolutionLink))
ImageFileName
SmallestTimerResolution RequestedTimerResolution
+0x2e0 ImageFileName : [15] "POWERPNT.EXE"
+0x4b8 RequestedTimerResolution : 0
+0x4c0 SmallestTimerResolution : 0x2710
dt nt!_EPROCESS @$extret-@@(#FIELD_OFFSET(nt!_EPROCESS, TimerResolutionLink))
ImageFileName
SmallestTimerResolution RequestedTimerResolution
+0x2e0 ImageFileName : [15] "winvnc.exe"
+0x4b8 RequestedTimerResolution : 0x2710
+0x4c0 SmallestTimerResolution : 0x2710
Timer Expiration
As we said, one of the main tasks of the ISR associated with the interrupt that the RTC or PIT will
generate is to keep track of system time, which is mainly done by the KeUpdateSystemTime routine. Its
second job is to keep track of logical run time, such as process/thread execution times and the system
tick time, which is the underlying number used by APIs such as GetTickCount that developers use to
time operations in their applications. This part of the work is performed by KeUpdateRunTime. Before
doing any of that work, however, KeUpdateRunTime checks whether any timers have expired.
Windows timers can be either absolute timers, which implies a distinct expiration time in the
future, or relative timers, which contain a negative expiration value used as a positive offset from the
current time during timer insertion. Internally, all timers are converted to an absolute expiration time,
although the system keeps track of whether or not this is the “true” absolute time or a converted
relative time. This difference is important in certain scenarios, such as Daylight Savings Time (or even
manual clock changes). An absolute timer would still fire at ”8PM” if the user moved the clock from
1PM to 7PM, but a relative timer—say, one set to expire “in two hours”—would not feel the effect of
the clock change because two hours haven’t really elapsed. During system time-change events such
as these, the kernel reprograms the absolute time associated with relative timers to match the new
settings.
Because the clock fires at known interval multiples, the bottom bits of the current system time
will be at one of 64 known positions (on an APIC HAL). Windows uses that fact to organize all driver
and application timers into linked lists based on an array where each entry corresponds to a possible
multiple of the system time. This table, called the timer table, is located in the PRCB, which enables](https://image.slidesharecdn.com/windowsinternalspart16thedition-230122041507-daca5e1d/85/Windows-Internals-Part-1_6th-Edition-pdf-137-320.jpg)
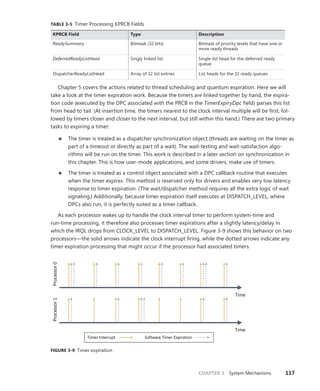
![CHAPTER 3 System Mechanisms 119
Timers Queue on CPU 0 Timers Queued on Current CPU
CPU
0
CPU
1
CPU
2
CPU
3
CPU
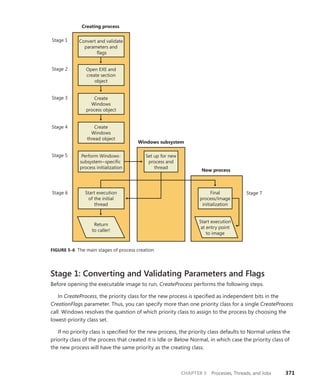
0
CPU
3
CPU
2
CPU
1
FIGURE 3-10 Timer queuing behaviors
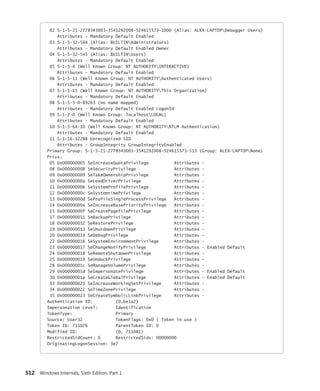
EXPERIMENT: Listing System Timers
You can use the kernel debugger to dump all the current registered timers on the system, as
well as information on the DPC associated with each timer (if any). See the following output for
a sample:
[lkd> !timer
Dump system timers
Interrupt time: 61876995 000003df [ 4/ 5/2010 18:58:09.189]
List Timer Interrupt Low/High Fire Time DPC/thread
PROCESSOR 0 (nt!_KTIMER_TABLE fffff80001bfd080)
5 fffffa8003099810 627684ac 000003df [ 4/ 5/2010 18:58:10.756]
NDIS!ndisMTimerObjectDpc (DPC @ fffffa8003099850)
13 fffffa8003027278 272dde78 000004cf [ 4/ 6/2010 23:34:30.510] NDIS!ndisMWakeUpDpcX
(DPC @ fffffa80030272b8)
fffffa8003029278 272e0588 000004cf [ 4/ 6/2010 23:34:30.511] NDIS!ndisMWakeUpDpcX
(DPC @ fffffa80030292b8)
fffffa8003025278 272e0588 000004cf [ 4/ 6/2010 23:34:30.511] NDIS!ndisMWakeUpDpcX
(DPC @ fffffa80030252b8)
fffffa8003023278 272e2c99 000004cf [ 4/ 6/2010 23:34:30.512] NDIS!ndisMWakeUpDpcX
(DPC @ fffffa80030232b8)
16 fffffa8006096c20 6c1613a6 000003df [ 4/ 5/2010 18:58:26.901] thread
fffffa8006096b60
19 fffff80001c85c40 64f9aeb5 000003df [ 4/ 5/2010 18:58:14.971]
nt!CmpLazyFlushDpcRoutine (DPC @ fffff80001c85c00)
31 fffffa8002c43660 P dc527b9b 000003e8 [ 4/ 5/2010 20:06:00.673]
intelppm!LongCapTraceDpc (DPC @ fffffa8002c436a0)
40 fffff80001c86f60 62ca1080 000003df [ 4/ 5/2010 18:58:11.304] nt!CcScanDpc (DPC @
fffff80001c86f20)
fffff88004039710 62ca1080 000003df [ 4/ 5/2010 18:58:11.304]
luafv!ScavengerTimerRoutine (DPC @ fffff88004039750)
...
252 fffffa800458ed50 62619a91 000003df [ 4/ 5/2010 18:58:10.619] netbt!TimerExpiry (DPC
@ fffffa800458ed10)
fffffa8004599b60 fe2fc6ce 000003e0 [ 4/ 5/2010 19:09:41.514] netbt!TimerExpiry (DPC
@ fffffa8004599b20)](https://image.slidesharecdn.com/windowsinternalspart16thedition-230122041507-daca5e1d/85/Windows-Internals-Part-1_6th-Edition-pdf-141-320.jpg)
![120 Windows Internals, Sixth Edition, Part 1
PROCESSOR 1 (nt!_KTIMER_TABLE fffff880009ba380)
0 fffffa8004ec9700 626be121 000003df [ 4/ 5/2010 18:58:10.686] thread
fffffa80027f3060
fffff80001c84dd0 P 70b3f446 000003df [ 4/ 5/2010 18:58:34.647]
nt!IopIrpStackProfilerTimer (DPC @ fffff80001c84e10)
11 fffffa8005c26cd0 62859842 000003df [ 4/ 5/2010 18:58:10.855] afd!AfdTimeoutPoll (DPC
@ fffffa8005c26c90)
fffffa8002ce8160 6e6c45f4 000003df [ 4/ 5/2010 18:58:30.822] thread
fffffa80053c2b60
fffffa8004fdb3d0 77f0c2cb 000003df [ 4/ 5/2010 18:58:46.789] thread
fffffa8004f4bb60
13 fffffa8005051c20 60713a93 800003df [ NEVER ] thread
fffffa8005051b60
15 fffffa8005ede120 77f9fb8c 000003df [ 4/ 5/2010 18:58:46.850] thread
fffffa8005ede060
20 fffffa8004f40ef0 629a3748 000003df [ 4/ 5/2010 18:58:10.990] thread
fffffa8004f4bb60
22 fffffa8005195120 6500ec7a 000003df [ 4/ 5/2010 18:58:15.019] thread
fffffa8005195060
28 fffffa8004760e20 62ad4e07 000003df [ 4/ 5/2010 18:58:11.115] btaudio (DPC @
fffffa8004760e60)+12d10
31 fffffa8002c40660 P dc527b9b 000003e8 [ 4/ 5/2010 20:06:00.673]
intelppm!LongCapTraceDpc (DPC @ fffffa8002c406a0)
...
232 fffff80001c85040 P 62317a00 000003df [ 4/ 5/2010 18:58:10.304] nt!IopTimerDispatch
(DPC @ fffff80001c85080)
fffff80001c26fc0 P 6493d400 000003df [ 4/ 5/2010 18:58:14.304]
nt!EtwpAdjustBuffersDpcRoutine (DPC @ fffff80001c26f80)
235 fffffa80047471a8 6238ba5c 000003df [ 4/ 5/2010 18:58:10.351] stwrt64 (DPC @
fffffa80047471e8)+67d4
242 fffff880023ae480 11228580 000003e1 [ 4/ 5/2010 19:10:13.304] dfsc!DfscTimerDispatch
(DPC @ fffff880023ae4c0)
245 fffff800020156b8 P 72fb2569 000003df [ 4/ 5/2010 18:58:38.469]
hal!HalpCmcDeferredRoutine (DPC @ fffff800020156f8)
248 fffffa80029ee460 P 62578455 000003df [ 4/ 5/2010 18:58:10.553]
ataport!IdePortTickHandler (DPC @ fffffa80029ee4a0)
fffffa8002776460 P 62578455 000003df [ 4/ 5/2010 18:58:10.553]
ataport!IdePortTickHandler (DPC @ fffffa80027764a0)
fffff88001678500 fe2f836f 000003e0 [ 4/ 5/2010 19:09:41.512] cng!seedFileDpcRoutine
(DPC @ fffff880016784c0)
fffff80001c25b80 885e52b3 0064a048 [12/31/2099 23:00:00.008]
nt!ExpCenturyDpcRoutine (DPC @ fffff80001c25bc0)
Total Timers: 254, Maximum List: 8
In this example, there are multiple driver-associated timers, due to expire shortly, associated
with the Ndis.sys and Afd.sys drivers (both related to networking), as well as audio, Bluetooth,
and ATA/IDE drivers. There are also background housekeeping timers due to expire, such as
those related to power management, ETW, registry flushing, and Users Account Control (UAC)
virtualization. Additionally, there are a dozen or so timers that don’t have any DPC associ-
ated with them—this likely indicates user-mode or kernel-mode timers that are used for wait](https://image.slidesharecdn.com/windowsinternalspart16thedition-230122041507-daca5e1d/85/Windows-Internals-Part-1_6th-Edition-pdf-142-320.jpg)
![CHAPTER 3 System Mechanisms 133
On x86 Pentium II processors and higher, Windows uses the sysenter instruction, which Intel
defined specifically for fast system service dispatches. To support the instruction, Windows stores at
boot time the address of the kernel’s system service dispatcher routine in a machine-specific register
(MSR) associated with the instruction. The execution of the instruction causes the change to kernel
mode and execution of the system service dispatcher. The system service number is passed in the EAX
processor register, and the EDX register points to the list of caller arguments. To return to user mode,
the system service dispatcher usually executes the sysexit instruction. (In some cases, like when the
single-step flag is enabled on the processor, the system service dispatcher uses the iret instead be-
cause sysexit does not allow returning to user-mode with a different EFLAGS register, which is needed
if sysenter was executed while the trap flag was set as a result of a user-mode debugger tracing or
stepping over a system call.)
Note Because certain older applications might have been hardcoded to use the int 0x2e
instruction to manually perform a system call (an unsupported operation), 32-bit Windows
keeps this mechanism usable even on systems that support the sysenter instruction by still
having the handler registered.
On the x64 architecture, Windows uses the syscall instruction, passing the system call number in
the EAX register, the first four parameters in registers, and any parameters beyond those four on the
stack.
On the IA64 architecture, Windows uses the epc (Enter Privileged Mode) instruction. The first eight
system call arguments are passed in registers, and the rest are passed on the stack.
EXPERIMENT: Locating the System Service Dispatcher
As mentioned, 32-bit system calls occur through an interrupt, which means that the handler
needs to be registered in the IDT or through a special sysenter instruction that uses an MSR
to store the handler address at boot time. On certain 32-bit AMD systems, Windows uses the
syscall instruction instead, which is similar to the 64-bit syscall instruction. Here’s how you can
locate the appropriate routine for either method:
1. To see the handler on 32-bit systems for the interrupt 2E version of the system call
dispatcher, type !idt 2e in the kernel debugger.
lkd> !idt 2e
Dumping IDT:
2e: 8208c8ee nt!KiSystemService
2. To see the handler for the sysenter version, use the rdmsr debugger command to read
from the MSR register 0x176, which stores the handler:
lkd> rdmsr 176
msr[176] = 00000000'8208c9c0](https://image.slidesharecdn.com/windowsinternalspart16thedition-230122041507-daca5e1d/85/Windows-Internals-Part-1_6th-Edition-pdf-155-320.jpg)
![134 Windows Internals, Sixth Edition, Part 1
lkd> ln 00000000'8208c9c0
(8208c9c0) nt!KiFastCallEntry
If you have a 64-bit machine, you can look at the 64-bit service call dispatcher by
repeating this step, but using the 0xC0000082 MSR instead, which is used by the
syscall version for 64-bit code. You will see it corresponds to nt!KiSystemCall64:
lkd> rdmsr c0000082
msr[c0000082] = fffff800'01a71ec0
lkd> ln fffff800'01a71ec0
(fffff800'01a71ec0) nt!KiSystemCall64
3. You can disassemble the KiSystemService or KiSystemCall64 routine with the u
command. On a 32-bit system, you’ll eventually notice the following instructions:
nt!KiSystemService+0x7b:
8208c969 897d04 mov dword ptr [ebp+4],edi
8208c96c fb sti
8208c96d e9dd000000 jmp nt!KiFastCallEntry+0x8f (8208ca4f)
Because the actual system call dispatching operations are common regardless of the
mechanism used to reach the handler, the older interrupt-based handler simply calls into the
middle of the newer sysenter-based handler to perform the same generic tasks. The only parts
of the handlers that are different are related to the generation of the trap frame and the setup
of certain registers.
At boot time, 32-bit Windows detects the type of processor on which it’s executing and sets up the
appropriate system call code to use by storing a pointer to the correct code in the SharedUserData
structure. The system service code for NtReadFile in user mode looks like this:
0:000> u ntdll!NtReadFile
ntdll!ZwReadFile:
77020074 b802010000 mov eax,102h
77020079 ba0003fe7f mov edx,offset SharedUserData!SystemCallStub (7ffe0300)
7702007e ff12 call dword ptr [edx]
77020080 c22400 ret 24h
77020083 90 nop
The system service number is 0x102 (258 in decimal), and the call instruction executes the system
service dispatch code set up by the kernel, whose pointer is at address 0x7ffe0300. (This corresponds
to the SystemCallStub member of the KUSER_SHARED_DATA structure, which starts at 0x7FFE0000.)
Because the following output was taken from an Intel Core 2 Duo, it contains a pointer to sysenter:
0:000> dd SharedUserData!SystemCallStub l 1
7ffe0300 77020f30
0:000> u 77020f30
ntdll!KiFastSystemCall:
77020f30 8bd4 mov edx,esp
77020f32 0f34 sysenter](https://image.slidesharecdn.com/windowsinternalspart16thedition-230122041507-daca5e1d/85/Windows-Internals-Part-1_6th-Edition-pdf-156-320.jpg)
![136 Windows Internals, Sixth Edition, Part 1
user space, these buffers must be probed for accessibility before kernel-mode code can copy data to
or from them. This probing is performed only if the previous mode of the thread is set to user mode.
The previous mode is a value (kernel or user) that the kernel saves in the thread whenever it executes
a trap handler and identifies the privilege level of the incoming exception, trap, or system call. As an
optimization, if a system call comes from a driver or the kernel itself, the probing and capturing of
parameters is skipped, and all parameters are assumed to be pointing to valid kernel-mode buffers
(also, access to kernel-mode data is allowed).
Because kernel-mode code can also make system calls, let’s look at the way these are done.
Because the code for each system call is in kernel mode and the caller is already in kernel mode, you
can see that there shouldn’t be a need for an interrupt or sysenter operation: the CPU is already at the
right privilege level, and drivers, as well as the kernel, should only be able to directly call the func-
tion required. In the executive’s case, this is actually what happens: the kernel has access to all its own
routines and can simply call them just like standard routines. Externally, however, drivers can access
these system calls only if they have been exported just like other standard kernel-mode APIs. In fact,
quite a few of the system calls are exported. Drivers, however, are not supposed to access system calls
this way. Instead, drivers must use the Zw versions of these calls—that is, instead of NtCreateFile, they
must use ZwCreateFile. These Zw versions must also be manually exported by the kernel, and only a
handful are, but they are fully documented and supported.
The Zw versions are officially available only for drivers because of the previous mode concept
discussed earlier. Because this value is updated only each time the kernel builds a trap frame, its value
won’t actually change across a simple API call—no trap frame is being generated. By calling a func-
tion such as NtCreateFile directly, the kernel preserves the previous mode value that indicates that it
is user mode, detects that the address passed is a kernel-mode address, and fails the call, correctly
asserting that user-mode applications should not pass kernel-mode pointers. However, this is not
actually what happens, so how can the kernel be aware of the correct previous mode? The answer lies
in the Zw calls.
These exported APIs are not actually simple aliases or wrappers around the Nt versions. Instead,
they are “trampolines” to the appropriate Nt system call, which use the same system call-dispatching
mechanism. Instead of generating an interrupt or a sysenter, which would be slow and/or unsupport-
ed, they build a fake interrupt stack (the stack that the CPU would generate after an interrupt) and call
the KiSystemService routine directly, essentially emulating the CPU interrupt. The handler executes the
same operations as if this call came from user mode, except it detects the actual privilege level this
call came from and set the previous mode to kernel. Now NtCreateFile sees that the call came from
the kernel and does not fail anymore. Here’s what the kernel-mode trampolines look like on both
32-bit and 64-bit systems. The system call number is highlighted in bold.
lkd> u nt!ZwReadFile
nt!ZwReadFile:
8207f118 b802010000 mov eax,102h
8207f11d 8d542404 lea edx,[esp+4]
8207f121 9c pushfd
8207f122 6a08 push 8
8207f124 e8c5d70000 call nt!KiSystemService (8208c8ee)
8207f129 c22400 ret 24h](https://image.slidesharecdn.com/windowsinternalspart16thedition-230122041507-daca5e1d/85/Windows-Internals-Part-1_6th-Edition-pdf-158-320.jpg)
![CHAPTER 3 System Mechanisms 137
lkd> uf nt!ZwReadFile
nt!ZwReadFile:
fffff800'01a7a520 488bc4 mov rax,rsp
fffff800'01a7a523 fa cli
fffff800'01a7a524 4883ec10 sub rsp,10h
fffff800'01a7a528 50 push rax
fffff800'01a7a529 9c pushfq
fffff800'01a7a52a 6a10 push 10h
fffff800'01a7a52c 488d05bd310000 lea rax,[nt!KiServiceLinkage (fffff800'01a7d6f0)]
fffff800'01a7a533 50 push rax
fffff800'01a7a534 b803000000 mov eax,3
fffff800'01a7a539 e902690000 jmp nt!KiServiceInternal (fffff800'01a80e40)
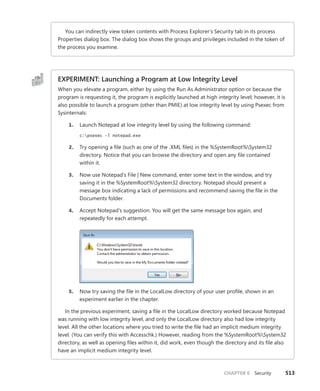
As you’ll see in Chapter 5, Windows has two system service tables, and third-party drivers cannot
extend the tables or insert new ones to add their own service calls. On 32-bit and IA64 versions of
Windows, the system service dispatcher locates the tables via a pointer in the thread kernel structure,
and on x64 versions it finds them via their global addresses. The system service dispatcher determines
which table contains the requested service by interpreting a 2-bit field in the 32-bit system service
number as a table index. The low 12 bits of the system service number serve as the index into the
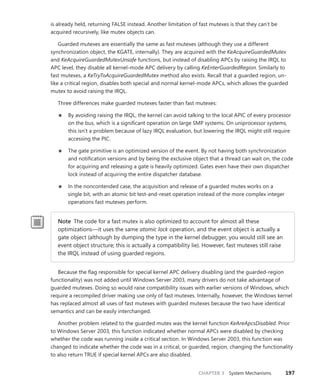
table specified by the table index. The fields are shown in Figure 3-16.
Table Index
Index into table System service number
31 13 11 0
0
1
0
1
Native API
Unused
Native API
Win32k.sys API
KeServiceDescriptorTable KeServiceDescriptorTableShadow
FIGURE 3-16 System service number to system service translation
Service Descriptor Tables
A primary default array table, KeServiceDescriptorTable, defines the core executive system services
implemented in Ntosrknl.exe. The other table array, KeServiceDescriptorTableShadow, includes the
Windows USER and GDI services implemented in the kernel-mode part of the Windows subsystem,
Win32k.sys. On 32-bit and IA64 versions of Windows, the first time a Windows thread calls a
Windows
USER or GDI service, the address of the thread’s system service table is changed to point to a table
that includes the Windows USER and GDI services. The KeAddSystemServiceTable function allows
Win32k.sys to add a system service table.](https://image.slidesharecdn.com/windowsinternalspart16thedition-230122041507-daca5e1d/85/Windows-Internals-Part-1_6th-Edition-pdf-159-320.jpg)
![CHAPTER 3 System Mechanisms 139
EXPERIMENT: Mapping System Call Numbers to Functions and
Arguments
You can duplicate the same lookup performed by the kernel when dealing with a system call ID
to figure out which function is responsible for handling it and how many arguments it takes
1. The KeServiceDescriptorTable and KeServiceDescriptorTableShadow tables both point
to the same array of pointers (or offsets, on 64-bit) for kernel system calls, called
KiServiceTable, and the same array of stack bytes, called KiArgumentTable. On a 32-bit
system, you can use the kernel debugger command dds to dump the data along with
symbolic information. The debugger attempts to match each pointer with a symbol.
Here’s a partial output:
lkd> dds KiServiceTable
820807d0 821be2e5 nt!NtAcceptConnectPort
820807d4 820659a6 nt!NtAccessCheck
820807d8 8224a953 nt!NtAccessCheckAndAuditAlarm
820807dc 820659dd nt!NtAccessCheckByType
820807e0 8224a992 nt!NtAccessCheckByTypeAndAuditAlarm
820807e4 82065a18 nt!NtAccessCheckByTypeResultList
820807e8 8224a9db nt!NtAccessCheckByTypeResultListAndAuditAlarm
820807ec 8224aa24 nt!NtAccessCheckByTypeResultListAndAuditAlarmByHandle
820807f0 822892af nt!NtAddAtom
2. As described earlier, 64-bit Windows organizes the system call table differently and
uses relative pointers (an offset) to system calls instead of the absolute addresses used
by 32-bit Windows. The base of the pointer is the KiServiceTable itself, so you’ll have to
dump the data in its raw format with the dq command. Here’s an example of output
from a 64-bit system:
lkd> dq nt!KiServiceTable
fffff800'01a73b00 02f6f000'04106900 031a0105'fff72d00
3. Instead of dumping the entire table, you can also look up a specific number. On
32-bit Windows, because each system call number is an index into the table and
because each element is 4 bytes, you can use the following calculation: Handler
=
KiServiceTable + Number * 4. Let’s use the number 0x102, obtained during our
description of the NtReadFile stub code in Ntdll.dll.
lkd> ln poi(KiServiceTable + 102 * 4)
(82193023) nt!NtReadFile
On 64-bit Windows, each offset can be mapped to each function with the ln com-
mand, by shifting right by 4 bits (used as described earlier) and adding the remaining
value to the base of KiServiceTable itself, as shown here:
lkd> ln @@c++(((int*)@@(nt!KiServiceTable))[3] >> 4) + nt!KiServiceTable
(fffff800'01d9cb10) nt!NtReadFile | (fffff800'01d9d24c) nt!NtOpenFile
Exact matches:
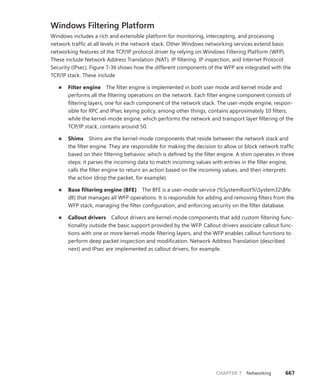
nt!NtReadFile = <no type information>](https://image.slidesharecdn.com/windowsinternalspart16thedition-230122041507-daca5e1d/85/Windows-Internals-Part-1_6th-Edition-pdf-161-320.jpg)
![146 Windows Internals, Sixth Edition, Part 1
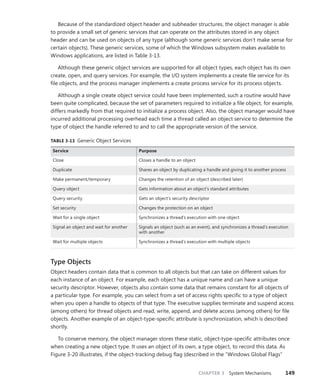
TABLE 3-9 Object Header Fields
Field Purpose
Handle count Maintains a count of the number of currently opened handles to the object.
Pointer count Maintains a count of the number of references to the object (including one reference for
each handle). Kernel-mode components can reference an object by pointer without using
a handle.
Security descriptor Determines who can use the object and what they can do with it. Note that unnamed
objects, by definition, cannot have security.
Object type index Contains the index to a type object that contains attributes common to objects of this type.
The table that stores all the type objects is ObTypeIndexTable.
Subheader mask Bitmask describing which of the optional subheader structures described in Table
3-10 are present, except for the creator information subheader, which, if present,
always precedes the object. The bitmask is converted to a negative offset by using the
ObpInfoMaskToOffset table, with each subheader being associated with a 1-byte index that
places it relative to the other subheaders present.
Flags Characteristics and object attributes for the object. See Table 3-12 for a list of all the object
flags.
Lock Per-object lock used when modifying fields belonging to this object header or any of its
subheaders.
In addition to the object header, which contains information that applies to any kind of object, the
subheaders contain optional information regarding specific aspects of the object. Note that these
structures are located at a variable offset from the start of the object header, the value of which
depends on the number of subheaders associated with the main object header (except, as mentioned
earlier, for creator information). For each subheader that is present, the InfoMask field is updated to
reflect its existence. When the object manager checks for a given subheader, it checks if the corre-
sponding bit is set in the InfoMask and then uses the remaining bits to select the correct offset into
the ObpInfoMaskToOffset table, where it finds the offset of the subheader from the start of the object
header.
These offsets exist for all possible combinations of subheader presence, but because the
subheaders, if present, are always allocated in a fixed, constant order, a given header will have only
as many possible locations as the maximum number of subheaders that precede it. For example,
because the name information subheader is always allocated first, it has only one possible offset.
On the other hand, the handle information subheader (which is allocated third) has three possible
locations, because it might or might not have been allocated after the quota subheader, itself hav-
ing
possibly been allocated after the name information. Table 3-10 describes all the optional object
subheaders and their location. In the case of creator information, a value in the object header flags
determines whether the subheader is present. (See Table 3-12 for information about these flags.)
TABLE 3-10 Optional Object Subheaders
Name Purpose Bit Location
Creator
information
Links the object into a list for all the objects
of the same type, and records the process
that created the object, along with a back
trace.
0 (0x1) Object header -
ObpInfoMaskToOffset[0])](https://image.slidesharecdn.com/windowsinternalspart16thedition-230122041507-daca5e1d/85/Windows-Internals-Part-1_6th-Edition-pdf-168-320.jpg)
![CHAPTER 3 System Mechanisms 147
Name Purpose Bit Location
Name
information
Contains the object name, responsible for
making an object visible to other processes
for sharing, and a pointer to the object direc-
tory, which provides the hierarchical structure
in which the object names are stored.
1 (0x2) Object header - ObpInfoMaskToOffset -
ObpInfoMaskToOffset[InfoMask & 0x3]
Handle
information
Contains a database of entries (or just a single
entry) for a process that has an open handle
to the object (along with a
per-process
handle count).
2 (0x4) Object header -
ObpInfoMaskToOffset[InfoMask & 0x7]
Quota
information
Lists the resource charges levied against a
process when it opens a handle to the object.
3 (0x8) Object header -
ObpInfoMaskToOffset[InfoMask & 0xF]
Process
information
Contains a pointer to the owning process
if this is an exclusive object. More informa-
tion on exclusive objects follows later in the
chapter.
4 (0x10) Object header -
ObpInfoMaskToOffset[InfoMask & 0x1F]
Each of these subheaders is optional and is present only under certain conditions, either during
system boot up or at object creation time. Table 3-11 describes each of these conditions.
TABLE 3-11 Conditions Required for Presence of Object Subheaders
Name Condition
Name information The object must have been created with a name.
Quota information The object must not have been created by the initial (or idle) system process.
Process information The object must have been created with the exclusive object flag. (See Table 3-12 for
information about object flags.)
Handle information The object type must have enabled the maintain handle count flag. File objects, ALPC objects,
WindowStation objects, and Desktop objects have this flag set in their object type structure.
Creator information The object type must have enabled the maintain type list flag. Driver objects have this flag
set if the Driver Verifier is enabled. However, enabling the maintain object type list global flag
(discussed earlier) will enable this for all objects, and Type objects always have the flag set.
Finally, a number of attributes and/or flags determine the behavior of the object during creation
time or during certain operations. These flags are received by the object manager whenever any new
object is being created, in a structure called the object attributes. This structure defines the object
name, the root object directory where it should be inserted, the security descriptor for the object, and
the object attribute flags. Table 3-12 lists the various flags that can be associated with an object.
Note When an object is being created through an API in the Windows subsystem (such as
CreateEvent or CreateFile), the caller does not specify any object attributes—the subsys-
tem DLL performs the work behind the scenes. For this reason, all named objects created
through Win32 go in the BaseNamedObjects directory, either the global or per-session
instance, because this is the root object directory that Kernelbase.dll specifies as part of the
object attributes structure. More information on BaseNamedObjects and how it relates to
the per-session namespace will follow later in this chapter.](https://image.slidesharecdn.com/windowsinternalspart16thedition-230122041507-daca5e1d/85/Windows-Internals-Part-1_6th-Edition-pdf-169-320.jpg)
![CHAPTER 3 System Mechanisms 151
+0x018 TypeIndex : 0x7 ''
+0x019 TraceFlags : 0 ''
+0x01a InfoMask : 0 ''
+0x01b Flags : 0x2 ''
+0x020 ObjectCreateInfo : 0xfffff800'01c53a80 _OBJECT_CREATE_INFORMATION
+0x020 QuotaBlockCharged : 0xfffff800'01c53a80
+0x028 SecurityDescriptor : 0xfffff8a0'00004b29
+0x030 Body : _QUAD
Now look at the object type data structure by obtaining its address from the
ObTypeIndexTable table for the entry associated with the TypeIndex field of the object header
data structure:
lkd> ?? ((nt!_OBJECT_TYPE**)@@(nt!ObTypeIndexTable))[((nt!_OBJECT_
HEADER*)0xfffffa800279cab0)->TypeIndex]
struct _OBJECT_TYPE * 0xfffffa80'02755b60
+0x000 TypeList : _LIST_ENTRY [ 0xfffffa80'02755b60 - 0xfffffa80'02755b60 ]
+0x010 Name : _UNICODE_STRING "Process"
+0x020 DefaultObject : (null)
+0x028 Index : 0x70x7 ''
+0x02c TotalNumberOfObjects : 0x380x38
+0x030 TotalNumberOfHandles : 0x1320x132
+0x034 HighWaterNumberOfObjects : 0x3d
+0x038 HighWaterNumberOfHandles : 0x13c
+0x040 TypeInfo : _OBJECT_TYPE_INITIALIZER
+0x0b0 TypeLock : _EX_PUSH_LOCK
+0x0b8 Key : 0x636f7250
+0x0c0 CallbackList : _LIST_ENTRY [ 0xfffffa80'02755c20 - 0xfffffa80'02755c20 ]
The output shows that the object type structure includes the name of the object type, tracks
the total number of active objects of that type, and tracks the peak number of handles and
objects of that type. The CallbackList also keeps track of any object manager filtering callbacks
that are associated with this object type. The TypeInfo field stores the pointer to the data struc-
ture that stores attributes common to all objects of the object type as well as pointers to the
object type’s methods:
lkd> ?? ((nt!_OBJECT_TYPE*)0xfffffa8002755b60)->TypeInfo*)0xfffffa8002755b60)->TypeInfo
+0x000 Length : 0x70
+0x002 ObjectTypeFlags : 0x4a 'J'
+0x002 CaseInsensitive : 0y0
+0x002 UnnamedObjectsOnly : 0y1
+0x002 UseDefaultObject : 0y0
+0x002 SecurityRequired : 0y1
+0x002 MaintainHandleCount : 0y0
+0x002 MaintainTypeList : 0y0
+0x002 SupportsObjectCallbacks : 0y1
+0x004 ObjectTypeCode : 0
+0x008 InvalidAttributes : 0xb0
+0x00c GenericMapping : _GENERIC_MAPPING
+0x01c ValidAccessMask : 0x1fffff
+0x020 RetainAccess : 0x101000
+0x024 PoolType : 0 ( NonPagedPool )
+0x028 DefaultPagedPoolCharge : 0x1000](https://image.slidesharecdn.com/windowsinternalspart16thedition-230122041507-daca5e1d/85/Windows-Internals-Part-1_6th-Edition-pdf-173-320.jpg)

![192 Windows Internals, Sixth Edition, Part 1
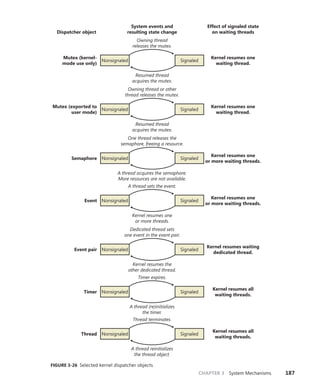
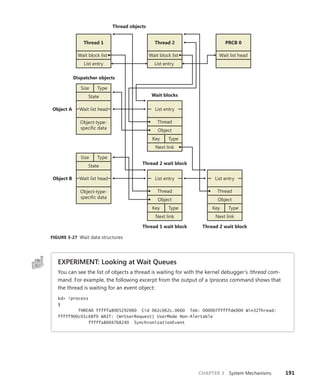
You can use the dt command to interpret the dispatcher header of the object like this:
lkd> dt nt!_DISPATCHER_HEADER fffffa80047b8240
+0x000 Type : 0x1 ''
+0x001 TimerControlFlags : 0 ''
+0x001 Absolute : 0y0
+0x001Coalescable : 0y0
+0x001 KeepShifting : 0y0
+0x001 EncodedTolerableDelay : 0y00000 (0)
+0x001 Abandoned : 0 ''
+0x001 Signalling : 0 ''
+0x002 ThreadControlFlags : 0x6 ''
+0x002 CpuThrottled : 0y0
+0x002 CycleProfiling : 0y1
+0x002 CounterProfiling : 0y1
+0x002 Reserved : 0y00000 (0)
+0x002 Hand : 0x6 ''
+0x002 Size : 0x6
+0x003 TimerMiscFlags : 0 ''
+0x003 Index : 0y000000 (0)
+0x003 Inserted : 0y0
+0x003 Expired : 0y0
+0x003 DebugActive : 0 ''
+0x003 ActiveDR7 : 0y0
+0x003 Instrumented : 0y0
+0x003 Reserved2 : 0y0000
+0x003 UmsScheduled : 0y0
+0x003 UmsPrimary : 0y0
+0x003 DpcActive : 0 ''
+0x000 Lock : 393217
+0x004 SignalState : 0
+0x008 WaitListHead : _LIST_ENTRY [ 0xfffffa80'047b8248 - 0xfffffa80'047b8248 ]
You should ignore any values that do not correspond to the given object type, because
they might be either incorrectly decoded by the debugger (because the wrong type or field is
being used) or simply contain stale or invalid data from a previous allocation value. There is no
defined correlation you can see between which fields apply to which object, other than by look-
ing at the Windows kernel source code or the WDK header files’ comments. For convenience,
Table 3-21 lists the dispatcher header flags and the objects to which they apply.
TABLE 3-21 Usage and Meaning of the Dispatcher Header Flags
Flag Applies To Meaning
Absolute Timers The expiration time is absolute, not relative.
Coalescable Periodic Timers Indicates whether coalescing should be used for this
timer.
KeepShifting Coalescable Timers Indicates whether or not the kernel dispatcher should
continue attempting to shift the timer’s expiration time.
When alignment is reached with the machine’s periodic
interval, this eventually becomes FALSE.
EncodedTolerableDelay Coalescable Timers The maximum amount of tolerance (shifted as a power
of two) that the timer can support when running
outside of its expected periodicity.](https://image.slidesharecdn.com/windowsinternalspart16thedition-230122041507-daca5e1d/85/Windows-Internals-Part-1_6th-Edition-pdf-214-320.jpg)
![194 Windows Internals, Sixth Edition, Part 1
Spare3Object = 11
Spare4Object = 12
Spare5Object = 13
Spare6Object = 14
Spare7Object = 15
Spare8Object = 16
Spare9Object = 17
ApcObject = 18
DpcObject = 19
DeviceQueueObject = 20
EventPairObject = 21
InterruptObject = 22
ProfileObject = 23
ThreadedDpcObject = 24
MaximumKernelObject = 25
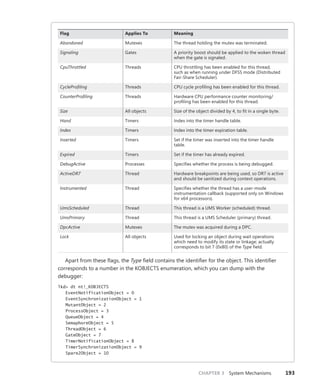
When the wait list head pointers are identical, there are either zero threads or one thread
waiting on this object. Dumping a wait block for an object that is part of a multiple wait from a
thread, or that multiple threads are waiting on, can yield the following:
dt nt!_KWAIT_BLOCK 0xfffffa80'053cf628
+0x000 WaitListEntry : _LIST_ENTRY [ 0xfffffa80'02efe568 - 0xfffffa80'02803468 ]
+0x010 Thread : 0xfffffa80'053cf520 _KTHREAD
+0x018 Object : 0xfffffa80'02803460
+0x020 NextWaitBlock : 0xfffffa80'053cf628 _KWAIT_BLOCK
+0x028 WaitKey : 0
+0x02a WaitType : 0x1 ''
+0x02b BlockState : 0x2 ''
+0x02c SpareLong : 8
If the wait list has more than one entry, you can execute the same command on the second
pointer value in the WaitListEntry field of each wait block (by executing !thread on the thread
pointer in the wait block) to traverse the list and see what other threads are waiting for the ob-
ject. This would indicate more than one thread waiting on this object. On the other hand, when
dealing with an object that’s part of a collection of objects being waited on by a single thread,
you have to parse the NextWaitBlock field instead.
Keyed Events
A synchronization object called a keyed event bears special mention because of the role it plays
in user-mode-exclusive synchronization primitives. Keyed events were originally implemented to
help processes deal with low-memory situations when using critical sections, which are user-mode
synchronization objects that we’ll see more about shortly. A keyed event, which is not documented,
allows a thread to specify a “key” for which it waits, where the thread wakes when another thread of
the same process signals the event with the same key.
If there is contention, EnterCriticalSection dynamically allocates an event object, and the thread
wanting to acquire the critical section waits for the thread that owns the critical section to signal
it in LeaveCriticalSection. Unfortunately, this introduces a new problem. Without keyed events, the
system could be critically out of memory and critical-section acquisition could fail because the system](https://image.slidesharecdn.com/windowsinternalspart16thedition-230122041507-daca5e1d/85/Windows-Internals-Part-1_6th-Edition-pdf-216-320.jpg)
![230 Windows Internals, Sixth Edition, Part 1
Apart from the causes mentioned in the table, there are a couple of special triggering cases
outside the regular scenarios that occur at the time a debugger object first becomes associated with a
process. The first create process and create thread messages will be manually sent when the debugger
is attached, first for the process itself and its main thread and followed by create thread messages for
all the other threads in the process. Finally, load dll events for the executable being debugged
(Ntdll.dll) and then all the current DLLs loaded in the debugged process will be sent.
Once a debugger object has been associated with a process, all the threads in the process are
suspended. At this point, it is the debugger’s responsibility to start requesting that debug events be
sent through. Debuggers request that debug events be sent back to user mode by performing a wait
on the debug object. This call loops the list of debug events. As each request is removed from the list,
its contents are converted from the internal dbgk structure to the native structure that the next layer
up understands. As you’ll see, this structure is different from the Win32 structure as well, and another
layer of conversion has to occur. Even after all pending debug messages have been processed by the
debugger, the kernel does not automatically resume the process. It is the debugger’s responsibility to
call the ContinueDebugEvent function to resume execution.
Apart from some more complex handling of certain multithreading issues, the basic model for the
framework is a simple matter of producers—code in the kernel that generates the debug events in
the previous table—and consumers—the debugger waiting on these events and acknowledging their
receipt.
Native Support
Although the basic protocol for user-mode debugging is quite simple, it’s not directly usable by
Windows applications—instead, it’s wrapped by the DbgUi functions in Ntdll.dll. This abstraction is
required to allow native applications, as well as different subsystems, to use these routines (because
code inside Ntdll.dll has no dependencies). The functions that this component provides are mostly
analogous to the Windows API functions and related system calls. Internally, the code also provides
the functionality required to create a debug object associated with the thread. The handle to a debug
object that is created is never exposed. It is saved instead in the thread environment block (TEB) of
the debugger thread that performs the attachment. (For more information on the TEB, see Chapter 5.)
This value is saved in DbgSsReserved[1].
When a debugger attaches to a process, it expects the process to be broken into—that is, an int 3
(breakpoint) operation should have happened, generated by a thread injected into the process. If this
didn’t happen, the debugger would never actually be able to take control of the process and would
merely see debug events flying by. Ntdll.dll is responsible for creating and injecting that thread into
the target process.
Finally, Ntdll.dll also provides APIs to convert the native structure for debug events into the
structure that the Windows API understands.](https://image.slidesharecdn.com/windowsinternalspart16thedition-230122041507-daca5e1d/85/Windows-Internals-Part-1_6th-Edition-pdf-252-320.jpg)
![240 Windows Internals, Sixth Edition, Part 1
Ldr.InMemoryOrderModuleList: 0000000000212780 . 0000000004731c10
Base TimeStamp Module
ff590000 4ce7a144 Nov 20 11:21:56 2010 C:WindowsExplorer.EXE
76d40000 4ce7c8f9 Nov 20 14:11:21 2010 C:WindowsSYSTEM32ntdll.dll
76870000 4ce7c78b Nov 20 14:05:15 2010 C:Windowssystem32kernel32.dll
7fefd2d0000 4ce7c78c Nov 20 14:05:16 2010 C:Windowssystem32KERNELBASE.dll
7fefee20000 4a5bde6b Jul 14 02:24:59 2009 C:Windowssystem32ADVAPI32.dll
2. The address shown on the Ldr line is a pointer to the PEB_LDR_DATA structure
described earlier. Notice that WinDbg shows you the address of the three lists and
dumps the initialization order list for you, displaying the full path, time stamp, and
base address of each module.
3. You can also analyze each module entry on its own by going through the module list
and then dumping the data at each address, formatted as a LDR_DATA_TABLE_ENTRY
structure. Instead of doing this for each entry, however, WinDbg can do most of the
work by using the !list extension and the following syntax:
!list –t ntdll!_LIST_ENTRY.Flink –x "dt ntdll!_LDR_DATA_TABLE_ENTRY @$extret"
0000000076e72640
Note that the last number is variable: it depends on whatever is shown on your
machine under Ldr.InLoadOrderModuleList.
4. You should then see the entries for each module:
0:001> !list -t ntdll!_LIST_ENTRY.Flink -x "dt ntdll!_LDR_DATA_TABLE_ENTRY
@$extret" 001c1cf8
+0x000 InLoadOrderLinks : _LIST_ENTRY [ 0x1c1d68 - 0x76fd4ccc ]
+0x008 InMemoryOrderLinks : _LIST_ENTRY [ 0x1c1d70 - 0x76fd4cd4 ]
+0x010 InInitializationOrderLinks : _LIST_ENTRY [ 0x0 - 0x0 ]
+0x018 DllBase : 0x00d80000
+0x01c EntryPoint : 0x00d831ed
+0x020 SizeOfImage : 0x28000
+0x024 FullDllName : _UNICODE_STRING "C:Windowsnotepad.exe"
+0x02c BaseDllName : _UNICODE_STRING "notepad.exe"
+0x034 Flags : 0x4010
Although this section covers the user-mode loader in Ntdll.dll, note that the kernel also
employs its own loader for drivers and dependent DLLs, with a similar loader entry struc-
ture. Likewise, the kernel-mode loader has its own database of such entries, which is directly
accessible through the PsActiveModuleList global data variable. To dump the kernel’s loaded
module database, you can use a similar !list command as shown in the preceding experiment by
replacing the pointer at the end of the command with “nt!PsActiveModuleList”.
Looking at the list in this raw format gives you some extra insight into the loader’s internals,
such as the flags field, which contains state information that !peb on its own would not show
you. See Table 3-25 for their meaning. Because both the kernel and user-mode loaders use this
structure, some flags apply only to kernel-mode drivers, while others apply only to user-mode
applications (such as .NET state).](https://image.slidesharecdn.com/windowsinternalspart16thedition-230122041507-daca5e1d/85/Windows-Internals-Part-1_6th-Edition-pdf-262-320.jpg)

![302 Windows Internals, Sixth Edition, Part 1
KeyCell : 0x64e598 [cell index]
TotalLevels : 4
DelayedCloseIndex: 2048
MaxNameLen : 0x3c
MaxValueNameLen : 0x0
MaxValueDataLen : 0x0
LastWriteTime : 0x 1c42501:0x7eb6d470
KeyBodyListHead : 0xe1034d70 0xe1034d70
SubKeyCount : 137
ValueCache.Count : 0
KCBLock : 0xe1034d40
KeyLock : 0xe1034d40
The Flags field indicates that the name is stored in compressed form, and the SubKeyCount
field shows that the key has 137 subkeys.
Stable Storage
To make sure that a nonvolatile registry hive (one with an on-disk file) is always in a recoverable state,
the configuration manager uses log hives. Each nonvolatile hive has an associated log hive, which is
a hidden file with the same base name as the hive and a logN extension. To ensure forward progress,
the configuration manger uses a dual-logging scheme. There are potentially two log files: .log1 and
.log2. If, for any reason, .log1 was written but a failure occurred while writing dirty data to the primary
log file, the next time a flush happens, a switch to .log2 will occur with the cumulative dirty data. If
that fails as well, the cumulative dirty data (the data in .log1 and the data that was dirtied in between)
is saved in .log2. As a consequence, .log1 will be used again next time around, until a successful write
operation is done to the primary log file. If no failure occurs, only .log1 is used.
For example, if you look in your %SystemRoot%System32Config directory (and you have the
Show Hidden Files And Folders folder option selected), you’ll see System.log1, Sam.log1, and other
.log1 and .log2 files. When a hive initializes, the configuration manager allocates a bit array in which
each bit represents a 512-byte portion, or sector, of the hive. This array is called the dirty sector
array because an on bit in the array means that the system has modified the corresponding
sector
in the hive in memory and must write the sector back to the hive file. (An off bit means that the
corresponding sector is up to date with the in-memory hive’s contents.)
When the creation of a new key or value or the modification of an existing key or value takes place,
the configuration manager notes the sectors of the hive that change in the hive’s dirty sector array.
Then the configuration manager schedules a lazy write operation, or a hive sync. The hive lazy writer
system thread wakes up five seconds after the request to synchronize the hive and writes dirty hive
sectors for all hives from memory to the hive files on disk. Thus, the system flushes, at the same time,
all the registry modifications that take place between the time a hive sync is requested and the time
the hive sync occurs. When a hive sync takes place, the next hive sync will occur no sooner than five
seconds later.](https://image.slidesharecdn.com/windowsinternalspart16thedition-230122041507-daca5e1d/85/Windows-Internals-Part-1_6th-Edition-pdf-324-320.jpg)
![340 Windows Internals, Sixth Edition, Part 1
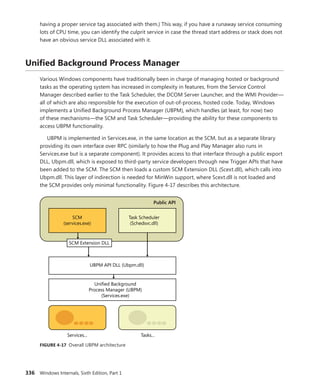
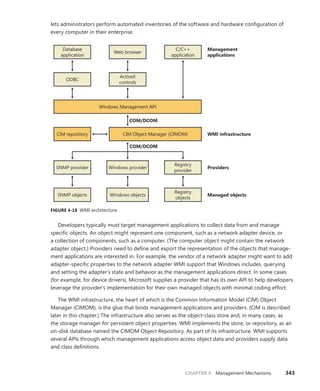
Trigger consumer registration is done by UbpmTriggerProviderRegister, which validates the request,
adds the provider’s GUID into the list of providers, and toggles it to enable the ETW trace to now
receive events about this provider as well.
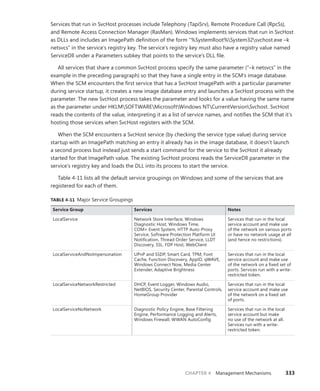
EXPERIMENT: Viewing Which Services React to Which Triggers
Certain Windows services are already preconfigured to consume the appropriate triggers to
prevent them from staying resident even when they’re not needed, such as the Windows Time
Service, the Tablet Input Service, and the Computer Browser service. The sc command lets you
query information about a service’s triggers with the qtriggerinfo option.
1. Open a command prompt.
2. Type the following to see the triggers for the Windows Time Service:
sc qtriggerinfo w32time
[SC] QueryServiceConfig2 SUCCESS
SERVICE_NAME: w32time
START SERVICE
DOMAIN JOINED STATUS : 1ce20aba-9851-4421-9430-1ddeb766e809
[DOMAIN JOINED]
STOP SERVICE
DOMAIN JOINED STATUS : ddaf516e-58c2-4866-9574-c3b615d42ea1
[NOT DOMAIN JOINED]
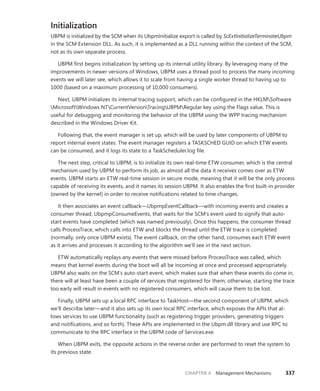
3. Now look at the Tablet Input Service:
sc qtriggerinfo tabletinputservice
[SC] QueryServiceConfig2 SUCCESS
SERVICE_NAME: tabletinputservice
START SERVICE
DEVICE INTERFACE ARRIVAL : 4d1e55b2-f16f-11cf-88cb-001111000030
[INTERFACE CLASS GUID]
DATA : HID_DEVICE_UP:000D_U:0001
DATA : HID_DEVICE_UP:000D_U:0002
DATA : HID_DEVICE_UP:000D_U:0003
DATA : HID_DEVICE_UP:000D_U:0004
4. Finally, here is the Computer Browser Service:
sc qtriggerinfo browser
[SC] QueryServiceConfig2 SUCCESS
SERVICE_NAME: browser
START SERVICE
FIREWALL PORT EVENT : b7569e07-8421-4ee0-ad10-86915afdad09](https://image.slidesharecdn.com/windowsinternalspart16thedition-230122041507-daca5e1d/85/Windows-Internals-Part-1_6th-Edition-pdf-362-320.jpg)
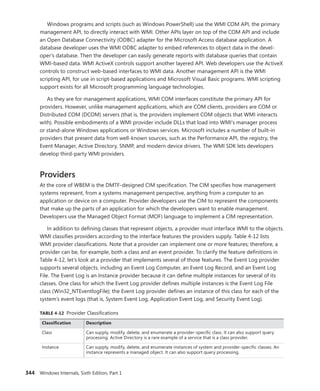
![CHAPTER 4 Management Mechanisms 341
[PORT OPEN]
DATA : 139;TCP;System;
DATA : 137;UDP;System;
DATA : 138;UDP;System;
STOP SERVICE
FIREWALL PORT EVENT : a144ed38-8e12-4de4-9d96-e64740b1a524
[PORT CLOSE]
DATA : 139;TCP;System;
DATA : 137;UDP;System;
DATA : 138;UDP;System;
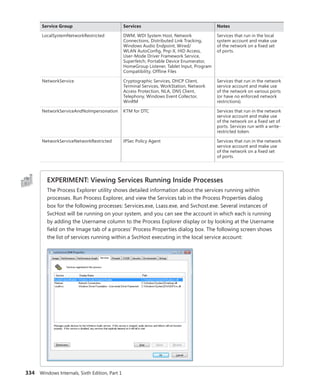
In these three cases, note how the Windows Time Service is waiting for domain join/exit
in order to decide whether or not it should run, while the Tablet Input Service is waiting for a
device with the HID Class ID matching Tablet Device. Finally, the Computer Browser Service will
run only if the firewall policy allows access on ports 137, 138, and 139, which are SMB network
ports that the browser needs.
Task Host
TaskHost receives commands from UBPM living in the SCM. At initialization time, it opens the local
RPC interface that was created by UBPM during its initialization and loops forever, waiting for com-
mands to come through the channel. Four commands are currently supported, which are sent over
the TaskHostSendResponseReceiveCommand RPC API:
■
■ Stopping the host
■
■ Starting a task
■
■ Stopping a task
■
■ Terminating a task
Additionally, hosted tasks are supplied with a TaskHostReportTaskStatus RPC API, which enables
them to notify UBPM of their current execution state whenever they call UbpmReportTaskStatus.
All task-based commands are actually internally implemented by a generic COM Task library, and
they essentially result in the creation and destruction of COM components.
Service Control Programs
Service control programs are standard Windows applications that use SCM service management
functions, including CreateService, OpenService, StartService, ControlService, QueryServiceStatus,
and DeleteService. To use the SCM functions, an SCP must first open a communications channel to
the SCM by calling the OpenSCManager function. At the time of the open call, the SCP must specify
what types of actions it wants to perform. For example, if an SCP simply wants to enumerate and
display the services present in the SCM’s database, it requests enumerate-service access in its call to
OpenSCManager. During its initialization, the SCM creates an internal object that represents the SCM](https://image.slidesharecdn.com/windowsinternalspart16thedition-230122041507-daca5e1d/85/Windows-Internals-Part-1_6th-Edition-pdf-363-320.jpg)
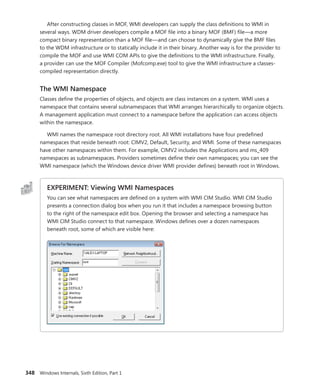
![CHAPTER 4 Management Mechanisms 347
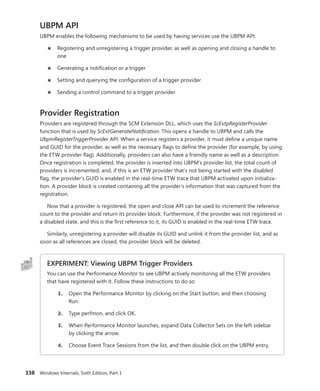
As stated earlier, WMI provider developers write their classes in the MOF language. The
following
output shows the definition of the Event Log provider’s Win32_NTEventlogFile, which is selected
in Figure 4-19. Notice the correlation between the properties that the right panel in Figure 4-19
lists and those properties’ definitions in the MOF file that follows. CIM Studio uses yellow arrows to
tag the properties that a class inherits. Thus, you don’t see those properties specified in
Win32_NTEventlogFile’s definition.
dynamic: ToInstance, provider("MS_NT_EVENTLOG_PROVIDER"), Locale(1033), UUID("{8502C57B-5FBB-
11D2-AAC1-006008C78BC7}")]
class Win32_NTEventlogFile : CIM_DataFile
{
[read] string LogfileName;
[read, write] uint32 MaxFileSize;
[read] uint32 NumberOfRecords;
[read, volatile, ValueMap{"0", "1..365", "4294967295"}] string OverWritePolicy;
[read, write, Units("Days"), Range("0-365 | 4294967295")] uint32 OverwriteOutDated;
[read] string Sources[];
[implemented, Privileges{"SeSecurityPrivilege", "SeBackupPrivilege"}] uint32 ClearEventlog([in]
string ArchiveFileName);
[implemented, Privileges{"SeSecurityPrivilege", "SeBackupPrivilege"}] uint32 BackupEventlog([in]
string ArchiveFileName);
};
One term worth reviewing is dynamic, which is a descriptive designator for the
Win32_NTEventlogFile class that the MOF file in the preceding output shows. “Dynamic” means that
the WMI infrastructure asks the WMI provider for the values of properties associated with an object
of that class whenever a management application queries the object’s properties. A static class is one
in the WMI repository; the WMI infrastructure refers to the repository to obtain the values instead of
asking a provider for the values. Because updating the repository is a relatively expensive operation,
dynamic providers are more efficient for objects that have properties that change frequently.
EXPERIMENT: Viewing the MOF Definitions of WMI Classes
You can view the MOF definition for any WMI class by using the WbemTest tool that comes with
Windows. In this experiment, we’ll look at the MOF definition for the Win32_NTEventLogFile
class:
1. Run Wbemtest from the Start menu’s Run dialog box.
2. Click the Connect button, change the Namespace to rootcimv2, and connect.
3. Click the Enum Classes button, select the Recursive option button, and then click OK.
4. Find Win32_NTEventLogFile in the list of classes, and then double-click it to see its
class properties.
5. Click the Show MOF button to open a window that displays the MOF text.](https://image.slidesharecdn.com/windowsinternalspart16thedition-230122041507-daca5e1d/85/Windows-Internals-Part-1_6th-Edition-pdf-369-320.jpg)
![CHAPTER 4 Management Mechanisms 349
Unlike a file system namespace, which comprises a hierarchy of directories and files, a WMI
namespace is only one level deep. Instead of using names as a file system does, WMI uses object
properties that it defines as keys to identify the objects. Management applications specify class names
with key names to locate specific objects within a namespace. Thus, each instance of a class must
be uniquely identifiable by its key values. For example, the Event Log provider uses the
Win32_NTLogEvent class to represent records in an Event Log. This class has two keys: Logfile, a string;
and RecordNumber, an unsigned integer. A management application that queries WMI for instances
of Event Log records obtains them from the provider key pairs that identify records. The
application
refers to a record using the syntax that you see in this sample object path name:
DARYLrootCIMV2:Win32_NTLogEvent.Logfile="Application",
RecordNumber="1"
The first component in the name (DARYL) identifies the computer on which the object is
located,
and the second component (rootCIMV2) is the namespace in which the object resides. The class
name follows the colon, and key names and their associated values follow the period. A comma
separates the key values.
WMI provides interfaces that let applications enumerate all the objects in a particular class or to
make queries that return instances of a class that match a query criterion.
Class Association
Many object types are related to one another in some way. For example, a computer object has a
processor, software, an operating system, active processes, and so on. WMI lets providers construct
an association class to represent a logical connection between two different classes. Association
classes associate one class with another, so the classes have only two properties: a class name and
the Ref modifier. The following output shows an association in which the Event Log provider’s MOF
file associates the Win32_NTLogEvent class with the Win32_ComputerSystem class. Given an object, a
management application can query associated objects. In this way, a provider defines a hierarchy of
objects.
[dynamic: ToInstance, provider("MS_NT_EVENTLOG_PROVIDER"): ToInstance, EnumPrivileges{"Se
SecurityPrivilege"}:
ToSubClass, Locale(1033): ToInstance, UUID("{8502C57F-5FBB-11D2-AAC1-006008C78BC7}"):
ToInstance, Association: DisableOverride ToInstance ToSubClass]
class Win32_NTLogEventComputer
{
[key, read: ToSubClass] Win32_ComputerSystem ref Computer;
[key, read: ToSubClass] Win32_NTLogEvent ref Record;
};](https://image.slidesharecdn.com/windowsinternalspart16thedition-230122041507-daca5e1d/85/Windows-Internals-Part-1_6th-Edition-pdf-371-320.jpg)
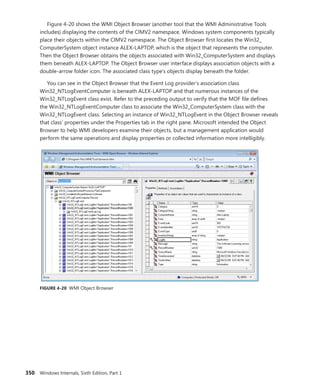

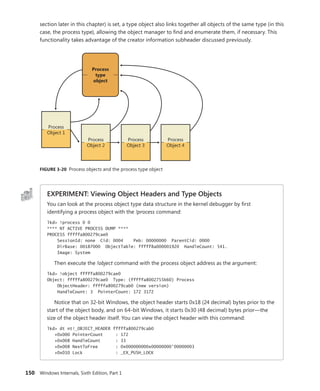
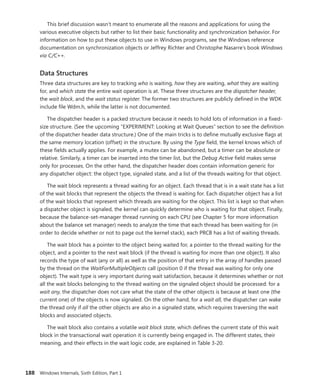
![366 Windows Internals, Sixth Edition, Part 1
Reference count
Client ID
Session data
Process links
Thread list
Parent
Client LPC port
Thread count
Shutdown level
CSR_SESSION
Flags
One per
CSR_SERVER DLL
Server data
Client View data
Sequence #
CSR_PROCESS
CSR_PROCESS
CSR_THREAD
CSR_PROCESS
FIGURE 5-4 Fields of the CSR process structure
EXPERIMENT: Examining the CSR_PROCESS
You can dump the CSR_PROCESS structure with the !dp command in the user-mode debugger
while attached to the Csrss process of the session you want to inspect. Use the File, Attach To
A Process option to get a list of processes, and select the Csrss process for the correct session.
(You can see the session of the process by expanding the tree item for it.) Make sure to select
the Noninvasive check box to avoid freezing your system.
The !dp command takes as input the PID of the process whose CSR_PROCESS structure
should be dumped. Alternatively, the structure pointer can be given directly as an argument.
Because !dp already performs a dt command internally, there is no need to use dt on your own.
0:000> !dp v 0x1c0aa8-8
PCSR_PROCESS @ 001c0aa0:
+0x000 ClientId : _CLIENT_ID
+0x008 ListLink : _LIST_ENTRY [ 0x1d8618 - 0x1b1b10 ]
+0x010 ThreadList : _LIST_ENTRY [ 0x1c0b80 - 0x1c7638 ]
+0x018 NtSession : 0x001c0bb8 _CSR_NT_SESSION
...
+0x054 Luid : _LUID
+0x05c ServerDllPerProcessData : [1] (null)
Threads:
Thread 001c0b78, Process 001c0aa0, ClientId 198.19c, Flags 0, Ref Count 1
Thread 001c0e78, Process 001c0aa0, ClientId 198.1cc, Flags 0, Ref Count 1
...](https://image.slidesharecdn.com/windowsinternalspart16thedition-230122041507-daca5e1d/85/Windows-Internals-Part-1_6th-Edition-pdf-388-320.jpg)
![CHAPTER 5 Processes, Threads, and Jobs 375
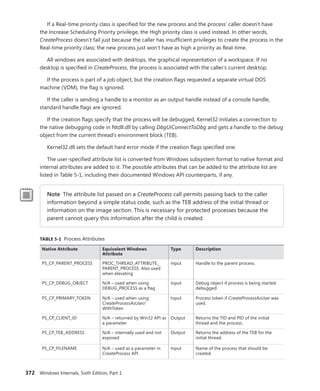
TABLE 5-2 Decision Tree for Stage 1 of CreateProcess
If the Image . . . Create State Code This Image Will
Run . . .
. . . and This Will Happen
Is a POSIX executable file PsCreateSuccess Posix.exe CreateProcess restarts
Stage 1.
Is an MS-DOS application with
an .exe, .com, or .pif extension
PsCreateFailOnSectionCreate Ntvdm.exe CreateProcess restarts
Stage 1.
Is a Win16 application PsCreateFailOnSectionCreate Ntvdm.exe CreateProcess restarts
Stage 1.
Is a Win64 application on a
32-bit system (or a PPC, MIPS,
or Alpha Binary)
PsCreateFailMachineMismatch N/A CreateProcess will fail.
Has a Debugger key with
another image name
PsCreateFailExeName Name specified in
the Debugger key
CreateProcess restarts
Stage 1.
Is an invalid or damaged
Windows EXE
PsCreateFailExeFormat N/A CreateProcess will fail.
Cannot be opened PsCreateFailOnFileOpen N/A CreateProcess will fail.
Is a command procedure
(
application with a .bat or .cmd
extension)
PsCreateFailOnSectionCreate Cmd.exe CreateProcess restarts
Stage 1.
Specifically, the decision tree that CreateProcess goes through to run an image is as follows:
■
■ If the image is an MS-DOS application with an .exe, .com, or .pif extension, a message is
sent to the Windows subsystem to check whether an MS-DOS support process (Ntvdm.exe,
specified in the registry value HKLMSYSTEMCurrentControlSetControlWOWcmdline) has
already been created for this session. If a support process has been created, it is used to run
the MS-DOS application. (The Windows subsystem sends the message to the VDM [Virtual
DOS Machine] process to run the new image.) Then CreateProcess returns. If a support process
hasn’t been created, the image to be run changes to Ntvdm.exe and CreateProcess restarts at
Stage 1.
■
■ If the file to run has a .bat or .cmd extension, the image to be run becomes Cmd.exe, the
Windows command prompt, and CreateProcess restarts at Stage 1. (The name of the batch file
is passed as the first parameter to Cmd.exe.)
■
■ If the image is a Win16 (Windows 3.1) executable, CreateProcess must decide whether a
new VDM process must be created to run it or whether it should use the default session-
wide shared VDM process (which might not yet have been created). The CreateProcess flags
CREATE_
SEPARATE_WOW_VDM and CREATE_SHARED_WOW_VDM control this decision. If
these flags aren’t specified, the registry value HKLMSYSTEMCurrentControlSetControl
WOWDefaultSeparateVDM dictates the default behavior. If the application is to be run in
a separate VDM, the image to be run changes to ntvdm.exe followed by some configuration
parameters and the 16-bit process’ name and CreateProcess restarts at Stage 1. Otherwise, the
Windows subsystem sends a message to see whether the shared VDM process exists and can
be used. (If the VDM process is running on a different desktop or isn’t running under the same](https://image.slidesharecdn.com/windowsinternalspart16thedition-230122041507-daca5e1d/85/Windows-Internals-Part-1_6th-Edition-pdf-397-320.jpg)
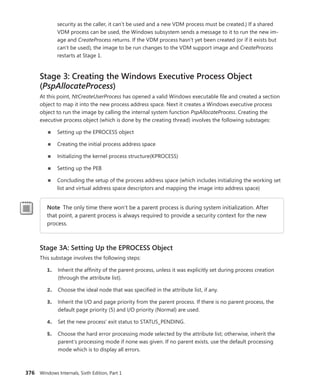
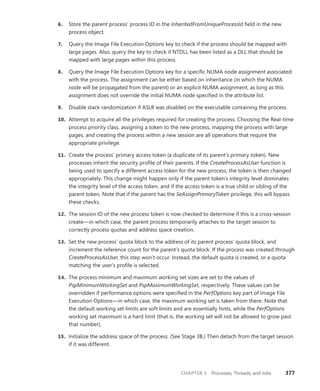
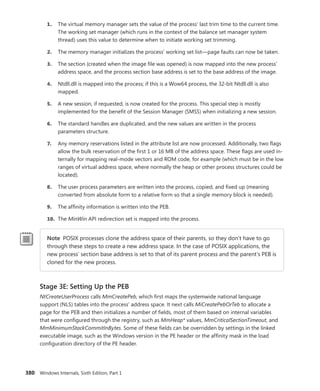
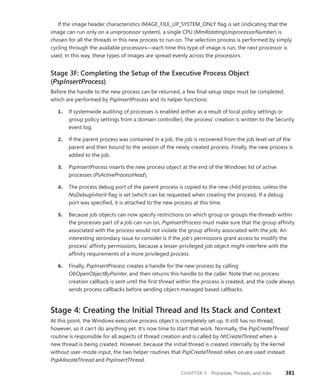
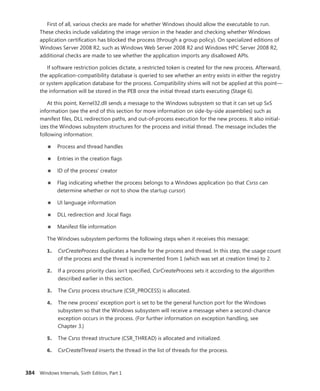
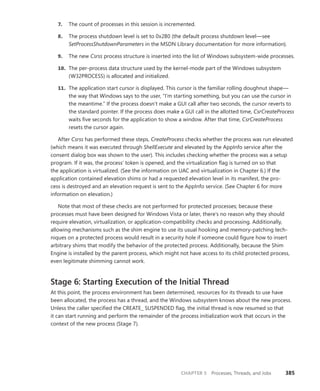
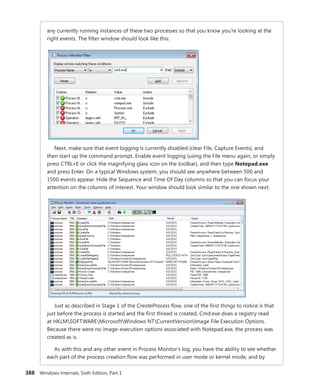
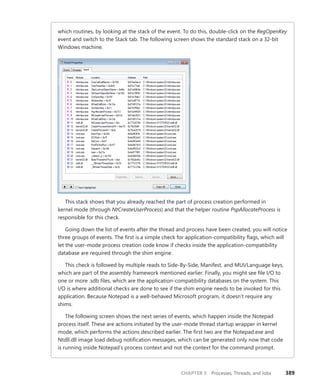
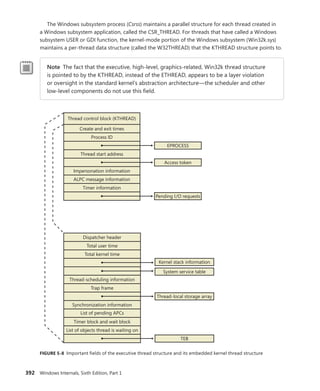
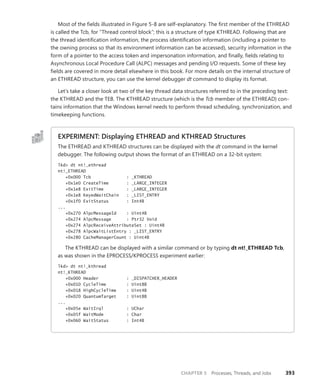
![396 Windows Internals, Sixth Edition, Part 1
The CSR_THREAD, illustrated in Figure 5-10 is analogous to the data structure of CSR_PROCESS, but
it’s applied to threads. As you might recall, this is maintained by each Csrss process within a session
and identifies the Windows subsystem threads running within it. The CSR_THREAD stores a handle
that Csrss keeps for the thread, various flags, and a pointer to the CSR_PROCESS for the thread. It also
stores another copy of the thread’s creation time.
Reference count
Create time
Thread links
Hash links
Client ID
Wait block
Thread handle
CSR_WAITBLOCK
Flags
Impersonation count
CSR_THREAD
CSR_THREAD
FIGURE 5-10 Fields of the CSR thread
EXPERIMENT: Examining the CSR_THREAD
You can dump the CSR_THREAD structure with the !dt command in the user-mode debugger
while attached to a Csrss process. Follow the instructions in the CSR_PROCESS experiment from
earlier to safely perform this operation. The output looks like this:
0:000> !dt v 001c7630
PCSR_THREAD @ 001c7630:
+0x000 CreateTime : _LARGE_INTEGER 0x1cb9fb6'00f90498
+0x008 Link : _LIST_ENTRY [ 0x1c0ab0 - 0x1c0f00 ]
+0x010 HashLinks : _LIST_ENTRY [ 0x75f19b38 - 0x75f19b38 ]
+0x018 ClientId : _CLIENT_ID
+0x020 Process : 0x001c0aa0 _CSR_PROCESS
+0x024 ThreadHandle : 0x000005c4
+0x028 Flags : 0
+0x02c ReferenceCount : 1
+0x030 ImpersonateCount : 0
Finally, the W32THREAD structure, illustrated in Figure 5-11, is analogous to the data structure
of WIN32PROCESS, but it’s applied to threads This structure mainly contains information useful for
the GDI subsystem (brushes and DC attributes) as well as for the User Mode Print Driver framework
(UMPD) that vendors use to write user-mode printer drivers. Finally, it contains a rendering state
useful for desktop compositing and anti-aliasing.](https://image.slidesharecdn.com/windowsinternalspart16thedition-230122041507-daca5e1d/85/Windows-Internals-Part-1_6th-Edition-pdf-418-320.jpg)