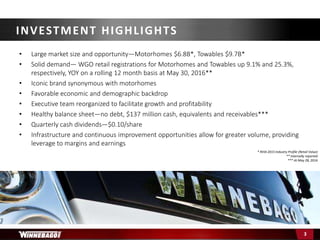
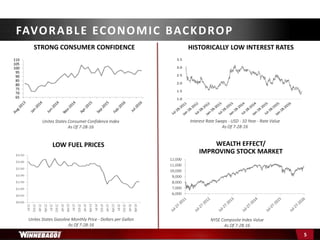
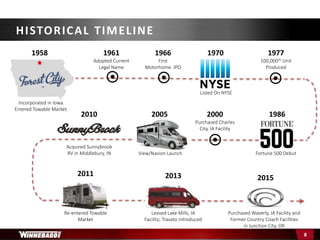
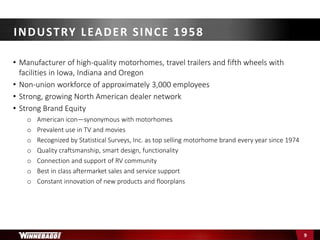
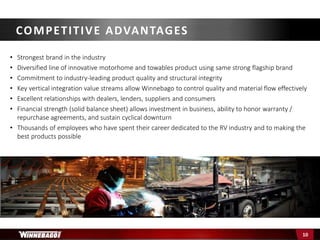
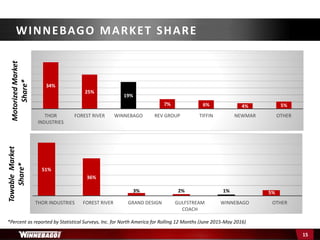
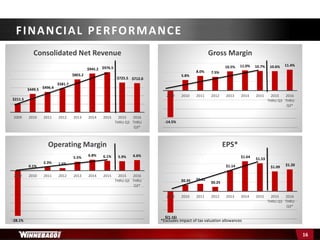
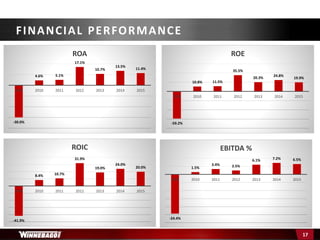
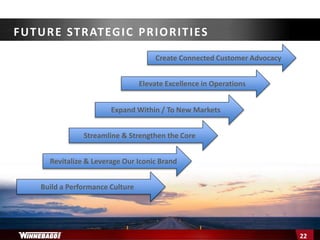
INVESTOR PRESENTATION
AUGUST 2016
This presentation contains forward-looking statements within the meaning of the
Private Securities Litigation Reform Act of 1995. Investors are cautioned that forward-
looking statements are inherently uncertain. A number of factors could cause actual
results to differ materially from these statements. These factors are contained in the
Company’s filings with the Securities and Exchange Commission over the last 12
months, copies of which are available from the SEC or from the Company upon request.
FORWARD LOOKING STATEMENTS
2
• Large market size and opportunity—Motorhomes $6.8B*, Towables $9.7B*
• Solid demand— WGO retail registrations for Motorhomes and Towables up 9.1% and 25.3%,
respectively, YOY on a rolling 12 month basis at May 30, 2016**
• Iconic brand synonymous with motorhomes
• Favorable economic and demographic backdrop
• Executive team reorganized to facilitate growth and profitability
• Healthy balance sheet—no debt, $137 million cash, equivalents and receivables***
• Quarterly cash dividends—$0.10/share
• Infrastructure and continuous improvement opportunities allow for greater volume, providing
leverage to margins and earnings
* RVIA 2015 Industry Profile (Retail Value)
** Internally reported
*** At May 28, 2016
INVESTMENT HIGHLIGHTS
3
INDUSTRY UPDATE
Economic Impact of RV Industry in North America
RVIA 2016 Industry Data
2,797
Number of
RV Businesses
3,001
Number of
RV Dealerships
$5.7
Billion
Taxes Paid
by RV
Industry
$7.9 Billion
Direct Wages
from RV
Industry
155,608
Direct
Jobs
$27 Billion
Total Direct
Economic
Output
$49.7 Billion
Overall Industry Impact
RVS MOVE AMERICA
4
STRONG CONSUMER CONFIDENCE HISTORICALLY LOW INTEREST RATES
Unites States Consumer Confidence Index
As Of 7-28-16
Interest Rate Swaps - USD - 10 Year - Rate Value
As Of 7-28-16
FAVORABLE ECONOMIC BACKDROP
5
LOW FUEL PRICES WEALTH EFFECT/
IMPROVING STOCK MARKET
Unites States Gasoline Monthly Price - Dollars per Gallon
As Of 7-28-16
NYSE Composite Index Value
As Of 7-28-16
U.S. POPULATION AGED 65+ EXPECTED TO GROW 69% FROM 2012 TO 2030
NEARLY HALF OF WINNEBAGO’S OWNERS ARE 60+ YEARS OLD**
Population 65+ by Age: 2010-2050
Source: U.S. Bureau of the Census
FAVORABLE DEMOGRAPHIC BACKDROP
6
• Camping is a solid target market
– Leisure travel and camping continue to be popular*
– Only 22% of the 29 million North American households that camp are RV campers
• Increasingly diverse potential customer base
– Hispanic, African American, Asian and other ethnicities grew from 13% in 2012 to 23% in 2015
– Younger campers (25-34 age) grew from 18% in 2012 to 23% in 2015
– Generation X and Millennials seek more active outdoor experiences
– Growth in use at sporting events and tournaments, craft shows, and collegiate sports activities for alumni and fans
* Kampgrounds of America (KOA) 2015 North American Camping Report
0
100
200
300
400
2009 2010 2011 2012 2013 2014 2015
Towables All Motorhomes
TOTAL SHIPMENTS TO RETAILERS BY CATEGORY
InThousandsofUnits
AVERAGE SELLING PRICE
Motorhome
~$128,000
Towable
~$29,000
INDUSTRY DYNAMICS
7
RECREATION VEHICLE INDUSTRY ASSOCIATION (RVIA)
FORECAST MAY 2016
• Calendar 2016 wholesale shipments for all RV categories
should increase 5.9% over calendar year 2015.*
Source: RVIA 2015 Industry Profile
COMPANY UPDATE
HISTORICAL TIMELINE
8
Incorporated in Iowa.
Entered Towable Market.
1958 1961
Adopted Current
Legal Name
1966
First
Motorhome. IPO
1970 1977
100,000th Unit
Produced
Fortune 500 Debut
2000
Purchased Charles
City, IA Facility
20052010
2011 2013 2015
Listed On NYSE
  
1986
Acquired Sunnybrook
RV in Middlebury, IN View/Navion Launch
Re-entered Towable
Market
Leased Lake Mills, IA
Facility; Travato Introduced
Purchased Waverly, IA Facility and
Former Country Coach Facilities
in Junction City, OR
• Manufacturer of high-quality motorhomes, travel trailers and fifth wheels with
facilities in Iowa, Indiana and Oregon
• Non-union workforce of approximately 3,000 employees
• Strong, growing North American dealer network
• Strong Brand Equity
o American icon—synonymous with motorhomes
o Prevalent use in TV and movies
o Recognized by Statistical Surveys, Inc. as top selling motorhome brand every year since 1974
o Quality craftsmanship, smart design, functionality
o Connection and support of RV community
o Best in class aftermarket sales and service support
o Constant innovation of new products and floorplans
INDUSTRY LEADER SINCE 1958
9
• Strongest brand in the industry
• Diversified line of innovative motorhome and towables product using same strong flagship brand
• Commitment to industry-leading product quality and structural integrity
• Key vertical integration value streams allow Winnebago to control quality and material flow effectively
• Excellent relationships with dealers, lenders, suppliers and consumers
• Financial strength (solid balance sheet) allows investment in business, ability to honor warranty /
repurchase agreements, and sustain cyclical downturn
• Thousands of employees who have spent their career dedicated to the RV industry and to making the
best products possible
COMPETITIVE ADVANTAGES
10
*Suggested base retail price
Class B
$90,910 - $124,100*
• Travato
• Era
Class C
$70,567 - $125,574*
• Minnie
Winnie/Spirit
• Fuse
• Trend
• Aspect/Cambria
• View/Navion
Class A Gas
$93,545 - $202,433*
• Vista/Sunstar
• Vista LX/Sunstar LX
• Sightseer/Sunova
• Adventurer/
Suncruiser
Class A Diesel
$133,420 - $467,670*
• Via
• Forza
• Journey/Meridian
• Tour/Ellipse
• Grand Tour/Ellipse
Ultra
MOTORHOME LINEUP
11
Travel Trailers
$15,798 – $42,616*
• Micro Minnie
• Winnie Drop
• Minnie
• Instinct
• Ultralite
• Spyder Toy Hauler
Fifth Wheels
$34,793 - $74,305*
• Voyage
• Latitude
• Destination
• Scorpion Toy Hauler
*Suggested base retail price
TOWABLE LINEUP
12
TOWABLE OPPORTUNITIES
13
$16.7
$56.8 $54.7
$58.1
$71.7
$48.9
$62.8
2011 2012 2013 2014 2015 2015 thru
Q3
2016 thru
Q3
Revenue Growth
In Millions
$88.0
$440.0
$880.0
$1,760.0
1% 5% 10% 20%
Net Revenue at Various Market
Shares*
Current WGO
Towable Market
Share
Emphasis on WGO
Brand Began
In Millions
• Significant growth opportunity
available
• Continue to leverage premium brand
– Growth and profit accelerated
when emphasized
• Expand distribution points
• Differentiated customer experience
• Exploring non-organic growth
*Assumes $8.8 Billion Market
Provides incremental growth and diversification
Winnebago Fuse
Built on new Ford Transit
chassis, offers fuel efficient
diesel engine
Instinct
Luxury travel trailer with
upscale amenities
Winnie Drop
Retro tear drop trailer with
modern amenities
INNOVATIVE NEW PRODUCTS
14
Winnebago Vista
New floorplans at entry price points
WINNEBAGO MARKET SHARE
15
51%
36%
3% 2% 1% 5%
THOR INDUSTRIES FOREST RIVER GRAND DESIGN GULFSTREAM
COACH
WINNEBAGO OTHER
*Percent as reported by Statistical Surveys, Inc. for North America for Rolling 12 Months (June 2015-May 2016)
34%
25%
19%
7% 6% 4% 5%
THOR
INDUSTRIES
FOREST RIVER WINNEBAGO REV GROUP TIFFIN NEWMAR OTHER
MotorizedMarket
Share*
TowableMarket
Share*
$(1.16)
$0.35 $0.41
$0.25
$1.14
$1.64
$1.53
$1.09
$1.20
2009 2010 2011 2012 2013 2014 2015 2015
THRU Q3
2016
THRU
Q3*
EPS*
FINANCIAL PERFORMANCE
16
$211.5
$449.5 $496.4
$581.7
$803.2
$945.2 $976.5
$725.5 $712.0
2009 2010 2011 2012 2013 2014 2015 2015
THRU Q3
2016
THRU
Q3*
Consolidated Net Revenue
-14.5%
5.8%
8.0% 7.5%
10.5% 11.0% 10.7% 10.6% 11.4%
2009 2010 2011 2012 2013 2014 2015 2015
THRU Q3
2016
THRU
Q3*
Gross Margin
*Excludes impact of tax valuation allowances-28.1%
0.1%
2.3% 1.6%
5.5%
6.8% 6.1% 5.9% 6.6%
2009 2010 2011 2012 2013 2014 2015 2015
THRU Q3
2016
THRU
Q3*
Operating Margin
-24.4%
1.5%
3.4% 2.5%
6.1% 7.2% 6.5%
2009 2010 2011 2012 2013 2014 2015
EBITDA %
FINANCIAL PERFORMANCE
17
-30.0%
4.6% 5.1%
17.1%
10.7%
13.5%
11.4%
2009 2010 2011 2012 2013 2014 2015
ROA
-59.2%
10.8% 11.5%
35.5%
20.3%
24.8%
19.9%
2009 2010 2011 2012 2013 2014 2015
ROE
-41.9%
8.4% 10.7%
31.9%
19.0%
24.0%
20.0%
2009 2010 2011 2012 2013 2014 2015
ROIC
PLANNING THE JOURNEY
THE ROADMAP TO SUCCESS
18
• Market & Financial Feedback
• Independent Assessments
Setting
a Vision
• New Corporate Vision
• Updated Values
• Refreshed Leadership & Org. Design
• Define Future MSP Value
• Modernize/Align Employee Incentives
• Normalize Major Initiatives (ERP, Oregon & Sourcing
• Fuel Towables Growth
• Seed Strategic Competencies & Partnership
• Brand Revitalization
• Create 3-5 Year Strategy
• Identify Target NBD Segments
Case
for
Change
LRP +
NBD
2017
Bridge
Staging
the
Organ-
ization
2020
Initiative
• Multi-Year Employee Drive Initiative
• Market and Financial BHAGs
19
Our Purpose
We help our customers explore
the outdoor lifestyle, enabling
extraordinary experiences as they
travel, live, work and play.
Our Vision
We will be the trusted leader
in outdoor lifestyle solutions by
providing unmatched innovation,
quality and service in the industries
we engage.
Our Mission
To create lifetime advocates
through a relentless focus on
delivering an unsurpassed
customer experience.
Our Values
Customer-Centric Results Driven Innovative Quality-Focused Collaborative Trusted
Guiding Principles
We respect our roots and legacy of success; we do not rest on them. We work to understand our customers’ unmet needs and
develop solutions and an experience that creates lifelong advocates. Our employees are driven and caring. We strive to develop
the best talent possible and enable a culture of servant leadership. We embrace thoughtful change in order to compete effectively
and deliver market leadership as well as superior profitability.
We will work strategically with our channel partners to help them succeed and exceed our mutual end-customers’ expectations. We
will continue to build respected brands that will be among our greatest assets. In every part of our company, we relentlessly pursue
continuous improvement and enhanced productivity, driving out waste and creating ongoing and meaningful differentiation.
WINNEBAGO INDUSTRIES VISION
REFRESHED LEADERSHIP TEAM
20
• Executive Leadership Team
– 50% of CEO Direct Reports Ultimately New to Winnebago Industries
– Stronger Business Unit Approach to Strategy and Execution
• Executive Officer (Former WGO Motorhome Executive) Now Leading Towables Business Unit
• New, Dedicated Leader of the Motorhome Business
– Matrixed Shared Services Support & Oversight Leads to Extended Best Practices Across WGO
– Increased Leadership Competencies Around Lean and Business Development
– True Enterprise Mindset and Accountability
VP – General
Counsel
VP - CFO
VP -
Towables
VP - CIO
VP – Corp
Strat & Dev
VP – Ops & CI
VP -
Motorized
VP – HR &
Admin
ERP Optimization
Business Intelligence
Digital Infrastructure
Connected Experience
Strategic Culture
NBD Capabilities
Brand Revitalization
Differentiation
CI Transformation
Untrap Capacity
Future State Footprint
Enterprise Leverage
Focused Leadership
NPD Vitality
Dealer Trust
Ownership Experience
Exec Officer Champion
NPD Vitality
Leverage MH Strengths
Plan for Growth
President &
CEO
Existing Talent
New Talent
Repositioned Talent
• ERP system will empower timely and effective business decisions and increase productivity
• Strategic sourcing initiative will identify material short-term COGS savings and establish long-term
procurement discipline
• New manufacturing and service facility in Oregon will create more streamlined assembly process
for Class A diesel product line and free up significant capacity in Iowa facility for increased
motorized production of Class A gas and C categories
• Reshaped executive leadership team structure will effectively blend current and new ideas, while
creating stronger organizational design for success
• New Minneapolis / Saint Paul office provides base to recruit additional intellectual capital, access
key partner relationships, engage customers / BOD differently, and broaden network of possible
allies and engagement of best practices
• Major assessments around Brand Health and Operational Health conducted to identify key and
multiple business improvement opportunities
• Utilized outside firm to assist Board of Directors in internal engagement assessment and define
experience / skills inventory to aid in future evolution
TODAY’S INVESTMENTS FOR TOMORROW’S GROWTH
21
FUTURE STRATEGIC PRIORITIES
22
Build a Performance Culture
Revitalize & Leverage Our Iconic Brand
Streamline & Strengthen the Core
Expand Within / To New Markets
Elevate Excellence in Operations
Create Connected Customer Advocacy
1. Drive Profitable Organic Growth
2. Deliver Consistent and Increasing Dividends
3. Smart Acquisitions
4. Share Buyback
CAPITAL ALLOCATION PRIORITIES
23
* RVIA 2015 Industry Profile (Retail Value)
** Internally reported
*** At May 28, 2016
INVESTMENT HIGHLIGHTS
24
• Large market size and opportunity—Motorhomes $6.8B*, Towables $9.7B*
• Solid demand— WGO retail registrations for Motorhomes and Towables up 9.1% and 25.3%,
respectively, YOY on a rolling 12 month basis at May 30, 2016**
• Iconic brand synonymous with motorhomes
• Favorable economic and demographic backdrop
• Executive team reorganized to facilitate growth and profitability
• Healthy balance sheet—no debt, $137 million cash, equivalents and receivables***
• Quarterly cash dividends—$0.10/share
• Infrastructure and continuous improvement opportunities allow for greater volume, providing
leverage to margins and earnings
MOVING FORWARD

Wi ir preso_20160801 updated v4

  • 1.
  • 2.
    This presentation containsforward-looking statements within the meaning of the Private Securities Litigation Reform Act of 1995. Investors are cautioned that forward- looking statements are inherently uncertain. A number of factors could cause actual results to differ materially from these statements. These factors are contained in the Company’s filings with the Securities and Exchange Commission over the last 12 months, copies of which are available from the SEC or from the Company upon request. FORWARD LOOKING STATEMENTS 2
  • 3.
    • Large marketsize and opportunity—Motorhomes $6.8B*, Towables $9.7B* • Solid demand— WGO retail registrations for Motorhomes and Towables up 9.1% and 25.3%, respectively, YOY on a rolling 12 month basis at May 30, 2016** • Iconic brand synonymous with motorhomes • Favorable economic and demographic backdrop • Executive team reorganized to facilitate growth and profitability • Healthy balance sheet—no debt, $137 million cash, equivalents and receivables*** • Quarterly cash dividends—$0.10/share • Infrastructure and continuous improvement opportunities allow for greater volume, providing leverage to margins and earnings * RVIA 2015 Industry Profile (Retail Value) ** Internally reported *** At May 28, 2016 INVESTMENT HIGHLIGHTS 3
  • 4.
  • 5.
    Economic Impact ofRV Industry in North America RVIA 2016 Industry Data 2,797 Number of RV Businesses 3,001 Number of RV Dealerships $5.7 Billion Taxes Paid by RV Industry $7.9 Billion Direct Wages from RV Industry 155,608 Direct Jobs $27 Billion Total Direct Economic Output $49.7 Billion Overall Industry Impact RVS MOVE AMERICA 4
  • 6.
    STRONG CONSUMER CONFIDENCEHISTORICALLY LOW INTEREST RATES Unites States Consumer Confidence Index As Of 7-28-16 Interest Rate Swaps - USD - 10 Year - Rate Value As Of 7-28-16 FAVORABLE ECONOMIC BACKDROP 5 LOW FUEL PRICES WEALTH EFFECT/ IMPROVING STOCK MARKET Unites States Gasoline Monthly Price - Dollars per Gallon As Of 7-28-16 NYSE Composite Index Value As Of 7-28-16
  • 7.
    U.S. POPULATION AGED65+ EXPECTED TO GROW 69% FROM 2012 TO 2030 NEARLY HALF OF WINNEBAGO’S OWNERS ARE 60+ YEARS OLD** Population 65+ by Age: 2010-2050 Source: U.S. Bureau of the Census FAVORABLE DEMOGRAPHIC BACKDROP 6 • Camping is a solid target market – Leisure travel and camping continue to be popular* – Only 22% of the 29 million North American households that camp are RV campers • Increasingly diverse potential customer base – Hispanic, African American, Asian and other ethnicities grew from 13% in 2012 to 23% in 2015 – Younger campers (25-34 age) grew from 18% in 2012 to 23% in 2015 – Generation X and Millennials seek more active outdoor experiences – Growth in use at sporting events and tournaments, craft shows, and collegiate sports activities for alumni and fans * Kampgrounds of America (KOA) 2015 North American Camping Report
  • 8.
    0 100 200 300 400 2009 2010 20112012 2013 2014 2015 Towables All Motorhomes TOTAL SHIPMENTS TO RETAILERS BY CATEGORY InThousandsofUnits AVERAGE SELLING PRICE Motorhome ~$128,000 Towable ~$29,000 INDUSTRY DYNAMICS 7 RECREATION VEHICLE INDUSTRY ASSOCIATION (RVIA) FORECAST MAY 2016 • Calendar 2016 wholesale shipments for all RV categories should increase 5.9% over calendar year 2015.* Source: RVIA 2015 Industry Profile
  • 9.
  • 10.
    HISTORICAL TIMELINE 8 Incorporated inIowa. Entered Towable Market. 1958 1961 Adopted Current Legal Name 1966 First Motorhome. IPO 1970 1977 100,000th Unit Produced Fortune 500 Debut 2000 Purchased Charles City, IA Facility 20052010 2011 2013 2015 Listed On NYSE    1986 Acquired Sunnybrook RV in Middlebury, IN View/Navion Launch Re-entered Towable Market Leased Lake Mills, IA Facility; Travato Introduced Purchased Waverly, IA Facility and Former Country Coach Facilities in Junction City, OR
  • 11.
    • Manufacturer ofhigh-quality motorhomes, travel trailers and fifth wheels with facilities in Iowa, Indiana and Oregon • Non-union workforce of approximately 3,000 employees • Strong, growing North American dealer network • Strong Brand Equity o American icon—synonymous with motorhomes o Prevalent use in TV and movies o Recognized by Statistical Surveys, Inc. as top selling motorhome brand every year since 1974 o Quality craftsmanship, smart design, functionality o Connection and support of RV community o Best in class aftermarket sales and service support o Constant innovation of new products and floorplans INDUSTRY LEADER SINCE 1958 9
  • 12.
    • Strongest brandin the industry • Diversified line of innovative motorhome and towables product using same strong flagship brand • Commitment to industry-leading product quality and structural integrity • Key vertical integration value streams allow Winnebago to control quality and material flow effectively • Excellent relationships with dealers, lenders, suppliers and consumers • Financial strength (solid balance sheet) allows investment in business, ability to honor warranty / repurchase agreements, and sustain cyclical downturn • Thousands of employees who have spent their career dedicated to the RV industry and to making the best products possible COMPETITIVE ADVANTAGES 10
  • 13.
    *Suggested base retailprice Class B $90,910 - $124,100* • Travato • Era Class C $70,567 - $125,574* • Minnie Winnie/Spirit • Fuse • Trend • Aspect/Cambria • View/Navion Class A Gas $93,545 - $202,433* • Vista/Sunstar • Vista LX/Sunstar LX • Sightseer/Sunova • Adventurer/ Suncruiser Class A Diesel $133,420 - $467,670* • Via • Forza • Journey/Meridian • Tour/Ellipse • Grand Tour/Ellipse Ultra MOTORHOME LINEUP 11
  • 14.
    Travel Trailers $15,798 –$42,616* • Micro Minnie • Winnie Drop • Minnie • Instinct • Ultralite • Spyder Toy Hauler Fifth Wheels $34,793 - $74,305* • Voyage • Latitude • Destination • Scorpion Toy Hauler *Suggested base retail price TOWABLE LINEUP 12
  • 15.
    TOWABLE OPPORTUNITIES 13 $16.7 $56.8 $54.7 $58.1 $71.7 $48.9 $62.8 20112012 2013 2014 2015 2015 thru Q3 2016 thru Q3 Revenue Growth In Millions $88.0 $440.0 $880.0 $1,760.0 1% 5% 10% 20% Net Revenue at Various Market Shares* Current WGO Towable Market Share Emphasis on WGO Brand Began In Millions • Significant growth opportunity available • Continue to leverage premium brand – Growth and profit accelerated when emphasized • Expand distribution points • Differentiated customer experience • Exploring non-organic growth *Assumes $8.8 Billion Market
  • 16.
    Provides incremental growthand diversification Winnebago Fuse Built on new Ford Transit chassis, offers fuel efficient diesel engine Instinct Luxury travel trailer with upscale amenities Winnie Drop Retro tear drop trailer with modern amenities INNOVATIVE NEW PRODUCTS 14 Winnebago Vista New floorplans at entry price points
  • 17.
    WINNEBAGO MARKET SHARE 15 51% 36% 3%2% 1% 5% THOR INDUSTRIES FOREST RIVER GRAND DESIGN GULFSTREAM COACH WINNEBAGO OTHER *Percent as reported by Statistical Surveys, Inc. for North America for Rolling 12 Months (June 2015-May 2016) 34% 25% 19% 7% 6% 4% 5% THOR INDUSTRIES FOREST RIVER WINNEBAGO REV GROUP TIFFIN NEWMAR OTHER MotorizedMarket Share* TowableMarket Share*
  • 18.
    $(1.16) $0.35 $0.41 $0.25 $1.14 $1.64 $1.53 $1.09 $1.20 2009 20102011 2012 2013 2014 2015 2015 THRU Q3 2016 THRU Q3* EPS* FINANCIAL PERFORMANCE 16 $211.5 $449.5 $496.4 $581.7 $803.2 $945.2 $976.5 $725.5 $712.0 2009 2010 2011 2012 2013 2014 2015 2015 THRU Q3 2016 THRU Q3* Consolidated Net Revenue -14.5% 5.8% 8.0% 7.5% 10.5% 11.0% 10.7% 10.6% 11.4% 2009 2010 2011 2012 2013 2014 2015 2015 THRU Q3 2016 THRU Q3* Gross Margin *Excludes impact of tax valuation allowances-28.1% 0.1% 2.3% 1.6% 5.5% 6.8% 6.1% 5.9% 6.6% 2009 2010 2011 2012 2013 2014 2015 2015 THRU Q3 2016 THRU Q3* Operating Margin
  • 19.
    -24.4% 1.5% 3.4% 2.5% 6.1% 7.2%6.5% 2009 2010 2011 2012 2013 2014 2015 EBITDA % FINANCIAL PERFORMANCE 17 -30.0% 4.6% 5.1% 17.1% 10.7% 13.5% 11.4% 2009 2010 2011 2012 2013 2014 2015 ROA -59.2% 10.8% 11.5% 35.5% 20.3% 24.8% 19.9% 2009 2010 2011 2012 2013 2014 2015 ROE -41.9% 8.4% 10.7% 31.9% 19.0% 24.0% 20.0% 2009 2010 2011 2012 2013 2014 2015 ROIC
  • 20.
  • 21.
    THE ROADMAP TOSUCCESS 18 • Market & Financial Feedback • Independent Assessments Setting a Vision • New Corporate Vision • Updated Values • Refreshed Leadership & Org. Design • Define Future MSP Value • Modernize/Align Employee Incentives • Normalize Major Initiatives (ERP, Oregon & Sourcing • Fuel Towables Growth • Seed Strategic Competencies & Partnership • Brand Revitalization • Create 3-5 Year Strategy • Identify Target NBD Segments Case for Change LRP + NBD 2017 Bridge Staging the Organ- ization 2020 Initiative • Multi-Year Employee Drive Initiative • Market and Financial BHAGs
  • 22.
    19 Our Purpose We helpour customers explore the outdoor lifestyle, enabling extraordinary experiences as they travel, live, work and play. Our Vision We will be the trusted leader in outdoor lifestyle solutions by providing unmatched innovation, quality and service in the industries we engage. Our Mission To create lifetime advocates through a relentless focus on delivering an unsurpassed customer experience. Our Values Customer-Centric Results Driven Innovative Quality-Focused Collaborative Trusted Guiding Principles We respect our roots and legacy of success; we do not rest on them. We work to understand our customers’ unmet needs and develop solutions and an experience that creates lifelong advocates. Our employees are driven and caring. We strive to develop the best talent possible and enable a culture of servant leadership. We embrace thoughtful change in order to compete effectively and deliver market leadership as well as superior profitability. We will work strategically with our channel partners to help them succeed and exceed our mutual end-customers’ expectations. We will continue to build respected brands that will be among our greatest assets. In every part of our company, we relentlessly pursue continuous improvement and enhanced productivity, driving out waste and creating ongoing and meaningful differentiation. WINNEBAGO INDUSTRIES VISION
  • 23.
    REFRESHED LEADERSHIP TEAM 20 •Executive Leadership Team – 50% of CEO Direct Reports Ultimately New to Winnebago Industries – Stronger Business Unit Approach to Strategy and Execution • Executive Officer (Former WGO Motorhome Executive) Now Leading Towables Business Unit • New, Dedicated Leader of the Motorhome Business – Matrixed Shared Services Support & Oversight Leads to Extended Best Practices Across WGO – Increased Leadership Competencies Around Lean and Business Development – True Enterprise Mindset and Accountability VP – General Counsel VP - CFO VP - Towables VP - CIO VP – Corp Strat & Dev VP – Ops & CI VP - Motorized VP – HR & Admin ERP Optimization Business Intelligence Digital Infrastructure Connected Experience Strategic Culture NBD Capabilities Brand Revitalization Differentiation CI Transformation Untrap Capacity Future State Footprint Enterprise Leverage Focused Leadership NPD Vitality Dealer Trust Ownership Experience Exec Officer Champion NPD Vitality Leverage MH Strengths Plan for Growth President & CEO Existing Talent New Talent Repositioned Talent
  • 24.
    • ERP systemwill empower timely and effective business decisions and increase productivity • Strategic sourcing initiative will identify material short-term COGS savings and establish long-term procurement discipline • New manufacturing and service facility in Oregon will create more streamlined assembly process for Class A diesel product line and free up significant capacity in Iowa facility for increased motorized production of Class A gas and C categories • Reshaped executive leadership team structure will effectively blend current and new ideas, while creating stronger organizational design for success • New Minneapolis / Saint Paul office provides base to recruit additional intellectual capital, access key partner relationships, engage customers / BOD differently, and broaden network of possible allies and engagement of best practices • Major assessments around Brand Health and Operational Health conducted to identify key and multiple business improvement opportunities • Utilized outside firm to assist Board of Directors in internal engagement assessment and define experience / skills inventory to aid in future evolution TODAY’S INVESTMENTS FOR TOMORROW’S GROWTH 21
  • 25.
    FUTURE STRATEGIC PRIORITIES 22 Builda Performance Culture Revitalize & Leverage Our Iconic Brand Streamline & Strengthen the Core Expand Within / To New Markets Elevate Excellence in Operations Create Connected Customer Advocacy
  • 26.
    1. Drive ProfitableOrganic Growth 2. Deliver Consistent and Increasing Dividends 3. Smart Acquisitions 4. Share Buyback CAPITAL ALLOCATION PRIORITIES 23
  • 27.
    * RVIA 2015Industry Profile (Retail Value) ** Internally reported *** At May 28, 2016 INVESTMENT HIGHLIGHTS 24 • Large market size and opportunity—Motorhomes $6.8B*, Towables $9.7B* • Solid demand— WGO retail registrations for Motorhomes and Towables up 9.1% and 25.3%, respectively, YOY on a rolling 12 month basis at May 30, 2016** • Iconic brand synonymous with motorhomes • Favorable economic and demographic backdrop • Executive team reorganized to facilitate growth and profitability • Healthy balance sheet—no debt, $137 million cash, equivalents and receivables*** • Quarterly cash dividends—$0.10/share • Infrastructure and continuous improvement opportunities allow for greater volume, providing leverage to margins and earnings
  • 28.