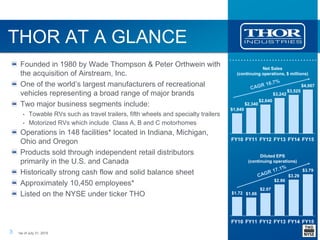
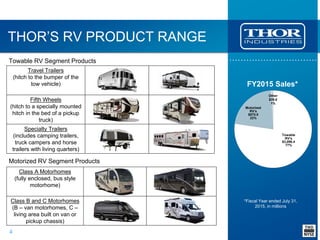
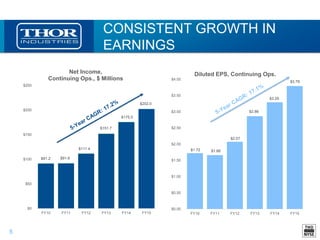
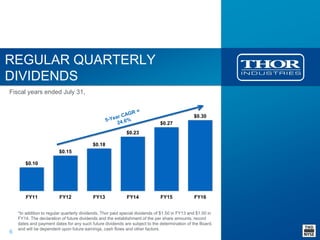
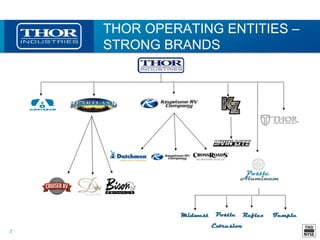
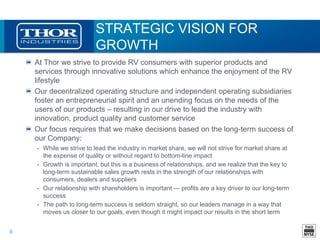
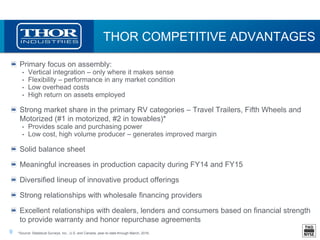
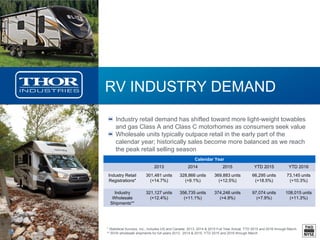
SlideShare a Scribd company logo
www.thorindustries.com
INVESTOR PRESENTATION
JUNE 6, 2016
2
FORWARD LOOKING STATEMENTS
This presentation includes certain statements that are “forward looking” statements within the meaning of the
U.S. Private Securities Litigation Reform Act of 1995, Section 27A of the Securities Act of 1933, as amended,
and Section 21E of the Securities Exchange Act of 1934, as amended. These forward looking statements are
made based on management’s current expectations and beliefs regarding future and anticipated
developments and their effects upon Thor Industries, Inc., and inherently involve uncertainties and risks.
These forward looking statements are not a guarantee of future performance. There can be no assurance that
actual results will not differ from our expectations. Factors which could cause materially different results
include, among others, raw material and commodity price fluctuations, material or chassis supply restrictions,
legislative and regulatory developments, the costs of compliance with increased governmental regulation,
legal issues, the potential impact of increased tax burdens on our dealers and retail consumers, lower
consumer confidence and the level of discretionary consumer spending, interest rate fluctuations and the
potential economic impact of rising interest rates, restrictive lending practices, management changes, the
success of new product introductions, the pace of obtaining and producing at new production facilities, the
pace of acquisitions, the potential loss of existing customers of acquisitions, the integration of new
acquisitions, the loss or reduction of sales to key dealers, the availability of delivery personnel, asset
impairment charges, cost structure changes, competition, the impact of potential losses under repurchase
agreements, the potential impact of the strengthening U.S. dollar on international demand, general economic,
market and political conditions and the other risks and uncertainties discussed more fully in ITEM 1A of our
Annual Report on Form 10-K for the year ended July 31, 2015 and Part II, Item 1A of our quarterly report on
Form 10-Q for the period ending April 30, 2016. We disclaim any obligation or undertaking to disseminate any
updates or revisions to any forward looking statements contained in this presentation or to reflect any change
in our expectations after the date of this presentation or any change in events, conditions or circumstances on
which any statement is based, except as required by law.
3
THOR AT A GLANCE
Founded in 1980 by Wade Thompson & Peter Orthwein with
the acquisition of Airstream, Inc.
One of the world’s largest manufacturers of recreational
vehicles representing a broad range of major brands
Two major business segments include:
• Towable RVs such as travel trailers, fifth wheels and specialty trailers
• Motorized RVs which include Class A, B and C motorhomes
Operations in 148 facilities* located in Indiana, Michigan,
Ohio and Oregon
Products sold through independent retail distributors
primarily in the U.S. and Canada
Historically strong cash flow and solid balance sheet
Approximately 10,450 employees*
Listed on the NYSE under ticker THO
$1,849
$2,340
$2,640
$3,242
$3,525
$4,007
FY10 FY11 FY12 FY13 FY14 FY15
Net Sales
(continuing operations, $ millions)
$1.72 $1.66
$2.07
$2.86
$3.29
$3.79
FY10 FY11 FY12 FY13 FY14 FY15
Diluted EPS
(continuing operations)
*as of July 31, 2015
4
THOR’S RV PRODUCT RANGE
Travel Trailers
(hitch to the bumper of the
tow vehicle)
Fifth Wheels
(hitch to a specially mounted
hitch in the bed of a pickup
truck)
Specialty Trailers
(includes camping trailers,
truck campers and horse
trailers with living quarters)
Towable
RV's
$3,096.4
77%
Motorized
RV's
$870.8
22%
Other
$39.6
1%
FY2015 Sales*
Towable RV Segment Products
Class A Motorhomes
(fully enclosed, bus style
motorhome)
Class B and C Motorhomes
(B – van motorhomes, C –
living area built on van or
pickup chassis)
Motorized RV Segment Products
*Fiscal Year ended July 31,
2015, in millions
5
CONSISTENT GROWTH IN
EARNINGS
$1.72 $1.66
$2.07
$2.86
$3.29
$3.79
$0.00
$0.50
$1.00
$1.50
$2.00
$2.50
$3.00
$3.50
$4.00
FY10 FY11 FY12 FY13 FY14 FY15
Diluted EPS, Continuing Ops.
$91.2 $91.6
$111.4
$151.7
$175.5
$202.0
$0
$50
$100
$150
$200
$250
FY10 FY11 FY12 FY13 FY14 FY15
Net Income,
Continuing Ops., $ Millions
6
REGULAR QUARTERLY
DIVIDENDS
Fiscal years ended July 31,
$0.10
$0.15
$0.18
$0.23
$0.27
$0.30
FY11 FY12 FY13 FY14 FY15 FY16
*In addition to regular quarterly dividends, Thor paid special dividends of $1.50 in FY13 and $1.00 in
FY14. The declaration of future dividends and the establishment of the per share amounts, record
dates and payment dates for any such future dividends are subject to the determination of the Board,
and will be dependent upon future earnings, cash flows and other factors.
7
THOR OPERATING ENTITIES –
STRONG BRANDS
8
STRATEGIC VISION FOR
GROWTH
At Thor we strive to provide RV consumers with superior products and
services through innovative solutions which enhance the enjoyment of the RV
lifestyle
Our decentralized operating structure and independent operating subsidiaries
foster an entrepreneurial spirit and an unending focus on the needs of the
users of our products – resulting in our drive to lead the industry with
innovation, product quality and customer service
Our focus requires that we make decisions based on the long-term success of
our Company:
• While we strive to lead the industry in market share, we will not strive for market share at
the expense of quality or without regard to bottom-line impact
• Growth is important, but this is a business of relationships, and we realize that the key to
long-term sustainable sales growth rests in the strength of our relationships with
consumers, dealers and suppliers
• Our relationship with shareholders is important ― profits are a key driver to our long-term
success
• The path to long-term success is seldom straight, so our leaders manage in a way that
moves us closer to our goals, even though it might impact our results in the short term
9
THOR COMPETITIVE ADVANTAGES
Primary focus on assembly:
• Vertical integration – only where it makes sense
• Flexibility – performance in any market condition
• Low overhead costs
• High return on assets employed
Strong market share in the primary RV categories – Travel Trailers, Fifth Wheels and
Motorized (#1 in motorized, #2 in towables)*
• Provides scale and purchasing power
• Low cost, high volume producer – generates improved margin
Solid balance sheet
Meaningful increases in production capacity during FY14 and FY15
Diversified lineup of innovative product offerings
Strong relationships with wholesale financing providers
Excellent relationships with dealers, lenders and consumers based on financial strength
to provide warranty and honor repurchase agreements
*Source: Statistical Surveys, Inc., U.S. and Canada, year-to-date through March, 2016.
10
INVESTING IN THE FUTURE -
CAPACITY
$12,767
$33,698
$10,442
$24,190
$30,438
$43,055
$0
$10,000
$20,000
$30,000
$40,000
$50,000
FY10 FY11 FY12 FY13 FY14 FY15
Thousands
Capital Acquisitions
$19,756
$99,562
$170
$10,718
$86,092
$194,486
$0
$50,000
$100,000
$150,000
$200,000
$250,000
FY10 FY11 FY12 FY13 FY14 FY15
Thousands
Business Acquisitions
11
CORPORATE INTEGRITY
No golden parachutes
No ‘pro forma’ earnings. We report net income,
not adjusted earnings to cover up performance
Consistent focus on shareholder value
Simple compensation philosophy:
• Mainly cash compensation based on pre-tax income – a true pay-
for-performance philosophy
• Restricted stock units also awarded based on performance to
provide broader, long-term focus on overall Company results
12
RV INDUSTRY CONDITIONS
REMAIN POSITIVE
Although consumer confidence has remained range bound since the beginning of 2016, it
remains at the highest levels since the recession. Final results rose to 94.7 in May from
89.0 in April. This compares with 90.7 a year ago.*
Consumers are more optimistic about their financial prospects and anticipate somewhat
lower inflation rates in the future. The main areas of uncertainty for consumers surround
whether the Federal Reserve will increase interest rates over the next few months and the
potential impact of the Presidential election on the overall economy.*
Recreation Vehicle Industry Association (RVIA) forecast in May 2016 that calendar 2016
wholesale shipments for all RV categories should increase to 396,400 units, or an increase
of 5.9% over calendar year 2015.**
Pricing and promotional environment remains competitive, but generally improved over
prior year.
Domestic travel offers fewer risks than international travel at a more compelling value.
Low fuel prices make RV travel increasingly attractive for consumers.
*Source: University of Michigan final Consumer Sentiment Index for May 2016
**Source: RVIA Roadsigns Summer 2016
13
CONSUMER TRENDS:
GROWING RV POPULARITY
Leisure travel such as camping continues to be popular*
Approximately 29.7 million households in North America camp at least once a year, but only
22% of them are RV campers.
The remaining campers primarily use tents or cabins, which makes them a solid target market
for the RV industry.
Favorable demographics*
Baby boomers (a prime RV target market for many years) represent 24% of the population
and are a target market as they reach retirement age and have more time for travel.
Generation X and Millennials offer future opportunities as they seek more active outdoor
experiences with their families.
Increasingly diverse potential customer base – Hispanic, African American, Asian and other
ethnicities grew from 13% in 2012 to 23% in 2015.
Younger campers (25-34 age) are also a growing market – from 18% in 2012 to 23% in 2015.
New applications – broader usage
Growth in use at extreme sporting events, youth sports leagues and tournaments, dog and
craft shows, and collegiate sports activities for alumni and fans.
*Source: Kampgrounds of America (KOA) 2015 North American Camping Report
14
CONSUMER TRENDS:
GROWING RV POPULARITY
Opportunities with Millennials*
Millennials (defined as age 19-35) are camping more, with 58% surveyed indicating they
plan to camp more nights in 2016.
This dempgraphic is camping in groups, as they view camping as an opportunity to spend
time with family and friends.
Younger campers also view camping as a way to reduce stress, escape the pressures of
everyday life, be more active and lead a healthier lifestyle.
Increasing Diversity Among Campers*
Although Hispanic, African American, Asian and other ethnicities accounted for 23% of
campers in 2015, they represented 40% of new campers in 2015 – showing their strong,
long-term growth potential.
These increasingly diverse campers view camping as an affordable vacation option that
allows them to be more active, reduce stress and spend more time with family and friends.
Hispanic campers have grown from 6% to 8% of campers over the past year. Based on
survey responses, they also seem much more likely to continue camping, as they were the
group most likely to say they plan to spend more nights camping in 2016.
*Source: Kampgrounds of America (KOA) 2015 North American Camping Report
15
POSTLE ALUMINUM ACQUISITION ENSURES
SUPPLY OF KEY MATERIAL COMPONENT
On May 1, 2015 Thor acquired Postle Aluminum, based in
Elkhart, Indiana, for approximately $144 million in cash, net
of cash acquired.
Postle generated sales of approximately $220 million in
calendar 2014 and we expect the acquisition to be accretive
to earnings.
Approximately 30% of total sales are to Thor subsidiaries and
approximately 75% of total sales were to the RV industry.
The remaining sales are to the specialty truck and trailer,
cargo, marine and fencing industries.
Postle produces a variety of aluminum extrusions,
specialized components and powder coating and painting
services.
The current management team will continue to lead the
company as a separate Thor subsidiary.
16
THIRD QUARTER REFLECTS
RECORD PERFORMANCE
Three Months Ended April 30,
2016 2015 % Chg.
Net Sales $1,284.1 $1,174.3 9.4%
Gross Profit 201.9 166.6 21.2%
% of Sales 15.7% 14.2%
SG&A 80.8 68.9 17.3%
% of Sales 6.3% 5.9%
Income Before Tax (cont. ops.) $116.3 $94.6 23.0%
% of Sales 9.1% 8.1%
Income Taxes 37.1 31.0
Net Income (cont. ops.) $79.2 $63.6 24.6%
Diluted EPS (cont. ops.) $1.51 $1.19 26.9%
Amounts in millions, except per share data
17
THIRD QUARTER 2016 RESULTS FROM CONTINUING
OPERATIONS UP DOUBLE DIGITS
Bob Martin – Thor President & CEO:
“We continued to see the benefits of executing our strategic operating plan in the third quarter, resulting in record sales and bottom-line results. As our
core markets continued to grow, we were able to generate improved margins and profitability based on growth in revenues, improved product mix and
lower material costs. This spring we have visited dealers and attended dealer meetings where we have heard consistent feedback that our dealer
partners are seeing an influx of younger consumers entering our markets, which gives us optimism for the long-term growth of our business and
industry. As we see growth of younger and more ethnically diverse consumers, we continue to invest in new product features and floorplans to meet
their needs. Thor leads in innovation with new technology features that make RVs easier to use and better connected, positioning us to expand our
markets over the long term.”
Peter Orthwein – Thor Executive Chairman:
“Since our founding, Thor has pursued strategic growth through acquisitions in markets with the greatest opportunities, followed by investments to
support their growth and long-term success. The record results we posted this quarter illustrate the power of our business model, particularly when
the market is performing as well as it is currently. As we continue to build on our history, we have every reason to be optimistic about the future of
Thor and our industry, particularly as we attract younger families into the RV lifestyle to drive future growth in sales, net income and total returns to our
shareholders.”
$1,174.3
$1,284.1
FY15 FY16
Net Sales
($ millions)
+9%
$63.6
$79.2
FY15 FY16
Net Income
(Continuing Ops.)
+25%
$1.19
$1.51
FY15 FY16
Diluted EPS
(Continuing Ops.)
+27%
$726.8
$1,056.8
FY15 FY16
RV Backlog
($ millions)
+45%
Note: Third quarter 2016 Results include Postle acquired May 1, 2015.
18
KEY TAKEAWAYS
Profitable every year since our founding in 1980 – 35 years of
profitability
We are primarily assemblers, not manufacturers
Variable cost structure provides flexibility in cyclical industry
Known as innovators in the industry
Strong market share in all main RV product categories
Solid balance sheet – history of returning cash to shareholders
Strong consumer, dealer and lender relationships
Experienced team
www.thorindustries.com
Appendix: Financial
and Market Data
20
INVESTOR Q&A: THIRD QUARTER AND YEAR-
TO-DATE OPERATING RESULTS
Sales growth for the third quarter of 9.4% decelerated from the first half of the year of 13.0%, what
was different in the first half?
• The growth rate in third quarter revenues was driven by the continued growth in the overall RV
market as well as the solid market acceptance of our numerous new products and features
introduced at Open House last fall. The growth in the Open House over the past several years has
resulted in a shift in revenues earlier in the fiscal year as dealers tend to place more of their orders in
September rather than at Louisville in early December, resulting in deliveries and related revenues
occurring earlier in the fiscal year. In addition, some of the growth in the first half of fiscal 2016 was
due to acquisitions that were not included in prior year figures.
• Compared with the growth in industry wholesale shipments, we have been significantly
outperforming in the motorized segment (36% growth vs. 17% industry growth), and slightly
underperforming in the towable segment (7% growth vs. 10% industry growth). Our performance in
the towable market is driven, in part, by our outsized presence in the fifth wheel segment of the
towables market, which has been much softer than the travel trailer segment of the towables market
so far this calendar year. In travel trailers, we have been nimble in shifting production and growing
our production capacity toward the market trends of lower-cost travel trailers that have been popular
with new, younger consumers entering the market.
21
INVESTOR Q&A: THIRD QUARTER AND YEAR-
TO-DATE OPERATING RESULTS (CONTINUED)
What were the drivers of third-quarter and year-to-date gross margin improvements? Is the current
gross margin percentage sustainable?
• Improvements in gross margin were due primarily to favorable changes in product mix and
improvements in material costs compared to the prior year. Growth in gross profit margin will become
more challenging in the fourth quarter as certain benefits to gross margin, specifically the $10 million
impact of the retroactive reinstatement of tariff rebates on certain imported raw material in the fourth
quarter of fiscal 2015, will not repeat in the fourth quarter of fiscal 2016. We believe it is important to
view the sustainability of gross margin rates on an annual basis and we believe our current annual
gross margin rates are sustainable so long as current market and economic conditions remain
positive.
Can you explain the factors that drove the 150 basis-point increase in gross margin in the quarter?
• The increase in overall gross margin was primarily the result of improved gross margin in the Towable
Segment driven primarily by improvements in product mix and material costs as a percent of sales.
For Towable RVs material, labor, freight-out and warranty costs as a combined percentage of
Towable net sales decreased to 78.3% for the three months ended April 30, 2016 compared to 80.0%
for the three months ended April 30, 2015. This decrease in percentage was primarily the result of a
decrease in the material cost percentage of sales due to favorable product mix, selective net selling
price increases and improved material management since the prior year period. Freight-out improved
as a percentage of sales as well.
22
INVESTOR Q&A: QUARTER AND YEAR-TO-
DATE OPERATING RESULTS (CONTINUED)
What factors are causing Corporate selling, general and administrative expenses to increase for
both the quarter and year-to-date periods?
• For the quarter, Corporate selling, general and administrative expenses increased $2.4 million to
$12.1 million for the three months ended April 30, 2016 compared to $9.7 million for the three months
ended April 30, 2015. The increase is primarily due to an increase in compensation costs, as bonuses
increased $0.3 million in correlation with the increase in income from continuing operations before
income taxes compared to the prior year, and stock-based compensation increased $0.6 million. The
stock-based compensation increase is due to increasing income from continuing operations before
income taxes over the past three years, as most stock awards vest ratably over a three-year period. In
addition, deferred compensation expense increased $0.3 million, which relates to the equal and
offsetting increase in net other Corporate income, due to the market value change in the deferred
compensation plan assets. Legal and professional fees also increased $0.7 million, largely attributable
to fees incurred related to strategic growth initiatives and increased sales and marketing initiatives.
23
INVESTOR Q&A: THIRD QUARTER AND YEAR-
TO-DATE OPERATING RESULTS (CONTINUED)
What factors are causing Corporate selling, general and administrative expenses to increase for
both the quarter and year to date periods (continued)?
• For the year-to-date period, Corporate selling, general and administrative expenses increased $5.7
million to $32.0 million for the nine months ended April 30, 2016 compared to $26.3 million for the nine
months ended April 30, 2015. The increase is primarily due to an increase in legal and professional
service fees of $2.2 million, largely attributable to professional fees incurred related to the
development of long-term strategic growth initiatives and increased sales and marketing initiatives. In
addition, compensation costs also increased, as bonuses increased $1.5 million in correlation with the
increase in income from continuing operations before income taxes compared to the prior year, and
stock-based compensation increased $1.9 million. The stock-based compensation increase is due to
increasing income from continuing operations before income taxes over the past three years, as most
stock awards vest ratably over a three-year period. Costs related to the actuarially determined
workers’ compensation and product liability reserves recorded at Corporate also increased by a total
of $1.0 million. These increases were partially offset by a decrease in deferred compensation expense
of $0.8 million, which relates to the equal and offsetting increase in net other Corporate income due to
the market value change in the deferred compensation plan assets.
24
INVESTOR Q&A: THIRD QUARTER AND YEAR-
TO-DATE OPERATING RESULTS (CONTINUED)
What has been the impact of the Restricted Stock Unit (RSU) program on SG&A expenses?
• As more fully explained in Note 14 of our quarterly report filed on Form 10-Q with the SEC, total
expense recognized in the three-month periods ended April 30, 2016 and April 30, 2015 for these
restricted stock unit awards and other stock-based compensation was $2.3 million and $1.7 million,
respectively. Total expense recognized in the nine-month periods ended April 30, 2016 and April 30,
2015 for these restricted stock unit awards and other stock-based compensation was $7.0 million and
$5.0 million, respectively. The increase in expense for both periods is due to increasing income from
continuing operations before income taxes over the past three years. The RSUs vest ratably over a
three-year period.
25
INVESTOR Q&A: THIRD QUARTER AND YEAR-
TO-DATE OPERATING RESULTS (CONTINUED)
What was the impact of new acquisitions on third-quarter and year-to-date sales and pre-tax
income?
• Cruiser RV, LLC and DRV, LLC (CRV/DRV) were acquired effective January 1, 2015, therefore the
third quarter of 2015 and the third quarter of 2016 both reflected a full quarter of sales and pre-tax
income related to this acquisition. On a year-to-date basis, the increase in the total Towable net sales
for the nine month period ended April 30, 2016 over the corresponding period in 2015 was impacted
by the inclusion of the five months of incremental activity of CRV/DRV. When we initially purchased
CRV/DRV, we indicated their annual revenues were approximately $135 million, or approximately $11
million per month, with margin comparable to our existing margin.
• In addition to CRV/DRV, the Company acquired Postle Aluminum Company, LLC in the fourth quarter
of fiscal 2015, effective May 1, 2015, therefore the third quarter of 2016 includes three months of
activity from Postle with no corresponding activity in the third quarter of 2015. The operating results of
Postle for the three and nine month periods ended April 30, 2016 are included in the “Other” segment
information of Footnote 4, “Business Segments,” of the Notes to the Condensed Consolidated
Financial Statements (unaudited).
Q What was the impact of new RV acquisitions to April 30, 2016 backlogs and dealer inventory?
• The reported backlogs and dealer inventory at April 30, 2015 and 2016 both include information
related to the CRV/DRV acquisition and therefore are comparable statistics.
26
INVESTOR Q&A: THIRD QUARTER AND YEAR-
TO-DATE OPERATING RESULTS (CONTINUED)
Has the Postle acquisition met expectations?
• Yes, Postle has met our expectations and is providing incremental net income before tax to Thor.
What caused the discontinued operations impact this quarter?
• The operating loss of discontinued operations before income taxes reflects expenses incurred directly
related to the former bus segment, including ongoing costs related to liabilities retained by the
Company under the Stock Purchase Agreement (SPA) with Allied Specialty Vehicles, Inc. (ASV) for
bus product liability and worker’s compensation claims occurring prior to the closing date of the sale.
What was the year-to-date tax rate? Also, in the earnings press release, you mention that you
expect the fourth-quarter tax rate to be higher than the prior year rate, why is that?
• The overall effective income tax rate for the nine months ended April 30, 2016 was 32.6% compared
with 31.9% for the nine months ended April 30, 2015. The primary reason for the increase in the
effective income tax rate is due to the larger amount of uncertain tax benefits that settled favorably in
the nine months ended April 30, 2015 when compared to the nine months ended April 30, 2016. We
expect similar conditions to prevail in the fourth quarter resulting in a higher effective tax rate for the
full year of fiscal 2016 compared to the prior year. This will have a more significant impact on year-
over-year comparisons in the fourth quarter, as the effective tax rate in the fourth quarter of 2015 was
approximately 29.2%, driven by the favorable settlement of various uncertain state tax positions that
are not expected to repeat in the fourth quarter of fiscal 2016.
27
INVESTOR Q&A: THIRD QUARTER AND YEAR-
TO-DATE OPERATING RESULTS (CONTINUED)
You’ve been making some changes to reporting structure among your subsidiaries lately, has that
helped to drive gross margin growth? Are you finding that centralization is actually working better
than you thought and proving more efficient than the running of each operating entity
independently?
• Since our founding, our decentralized structure is one of the long-term keys to our success as a
Company. By vesting responsibility and ownership of our operations with those individuals closest to
the customer, we are able to respond quickly to the needs and demands of the market which in turn
drives the success of our operations. We also recognize that as our business changes and market
conditions change, we need to make appropriate changes to optimize our reporting structure. This
has helped in improving our financial results indirectly, as we improved our overall operations to the
benefit of our dealers, consumers and the broader RV market.
28
INVESTOR Q&A: BALANCE SHEET AND CASH
FLOW
What drove the sizable increase in accounts receivable?
• Although accounts receivable has increased by $112.5 million from July 31, 2015, on a year-over-year
basis, the increase was $16.6 million. The increase in accounts receivable at April 30, 2016 was due
primarily to the increase in sales as well as the timing of sales associated with those receivables near
the end of the quarter.
What are your priorities for cash utilization?
• We strive to maintain a healthy cash balance to ensure we have adequate resources to respond to
opportunities and changing market conditions within the RV industry. Our priorities for cash utilization
remain consistent – our first priority is to support and grow our core RV business, both organically and
through acquisitions. Our second priority is maintaining and growing our regular dividend rate over time.
Our third priority is for strategic share repurchases or special dividends, as determined by the
Company’s Board.
29
INVESTOR Q&A: MARKET CONDITIONS AND
OUTLOOK
What is your longer-term outlook for the overall RV market?
• At this point, we see many reasons for optimism regarding the future growth of the RV industry. Our
dealers remain optimistic about the long-term growth of the RV industry. Consumers remain
positive, as the impact of lower fuel prices, increasing job creation, historically low interest rates and
lower inflation expectations have helped consumer confidence to remain strong. This positive
consumer confidence combined with innovative product offerings, including a broader array of lower
priced units in each category of products, have driven the industry growth in excess of the growth
rate of the broader economy. In addition, a positive future outlook for the RV segment is supported
by favorable demographics – both as more people reach the age brackets that historically have
accounted for the bulk of the retail RV sales as well as an influx of younger and ethnically diverse
consumers that are attracted to the RV lifestyle. These younger consumers in particular are
generally attracted to lower and moderately priced products and are, in part, fueling additional growth
in the industry beyond historical levels. The Recreation Vehicle Industry Association (RVIA) also
recently updated their forecast for calendar 2016 and are now projecting 5.9% growth, to 396,400
units. While forecasts of future industry growth are always difficult, subject to a number of risks and
can change rapidly, based on current indicators from the industry, dealers and consumers, we
remain optimistic that the RV industry and Thor have several more years of solid growth ahead.
30
INVESTOR Q&A: MARKET CONDITIONS AND
OUTLOOK (CONTINUED)
What is your outlook for the rest of the year?
• Current capacity limitations, combined with the strength of the prior year fourth quarter and continued
strength in the RV market, along with a continued shift toward more moderately priced towable
products, should result in high-single-digit revenue growth in the fourth quarter, as compared with the
prior year. The impact of the retroactive reinstatement of tariff rebates on certain imported raw
material, which had a $10 million, or 95 basis point, positive impact on gross margin in the fourth
quarter of fiscal 2015, will not repeat in the fourth quarter of fiscal 2016. The estimated effective
income tax rate is anticipated to remain comparable to the effective rate incurred in the first nine
months of fiscal 2016, versus the unusually low rate of the fourth quarter of 2015.
Have you seen any softness in markets that have been heavily impacted by the oil industry?
• The largest state with exposure to the oil industry is Texas, which, based on retail registration data
from Statistical Surveys, accounted for 31,911 units in 2015, which was up 7.9% for the year. For
the first three months of 2016, total retail registrations in Texas increased by 6.9%. At this point, we
have not seen signs of reduced demand in the large metro regions of Texas.
What is the current state of Dealer inventory levels?
• Dealers in general remain optimistic regarding calendar 2016. Dealer orders are generally expected
to reflect a 1-for-1 replacement as units are sold at retail. Dealer inventory remains appropriate for
current conditions in both towables and motorized.
31
INVESTOR Q&A: MARKET CONDITIONS AND
OUTLOOK (CONTINUED)
Can you comment on your rental business?
• Thor Motor Coach (TMC) has been a leader in the rental business, particularly Class C motorhomes.
TMC is the exclusive provider of rental units for a number of leading national RV rental companies
and is continuing to focus on growing this business with other rental companies. Typically, rental
units are standardized with more limited options than typical retail units. Rental orders tend to be
produced in larger runs that can result in improved productivity that may offset lower-margin content
within these units.
What is the current state of the Canadian RV market?
• The Canadian market is still challenging as we see continued volatility in the value of the Canadian
dollar relative to the U.S. dollar. Since we sell our products to Canadian dealers priced in U.S.
dollars, this creates an upward pressure on prices in local currency which has an adverse impact on
demand. For calendar year 2015, total Canadian retail registrations as reported by Statistical
Surveys, Inc. fell 12.9% from calendar 2014. For 2016, total Canadian retail registrations as reported
by Statistical Surveys, Inc., fell 17.9% for the first three months of 2016, with towables decreasing
17.5% and motorized decreasing 23.7%, though it’s important to note that the Canadian market
typically has limited activity in the early months of the calendar year.
What is the status of the new Heartland plant in Idaho?
• The Heartland facility in Idaho is progressing according to our original timeline. We are ramping up
production at the new western facility that began producing and shipping units in the fiscal third
quarter. The Nampa facility will produce travel trailers to meet the strong demands of the West
Coast dealers of our Heartland subsidiary.
32
INVESTOR Q&A: MARKET CONDITIONS AND
COMPETITION (CONTINUED)
What is the status of the new Thor Motor Coach plant in Bristol, Indiana?
• The team at Thor Motor Coach has worked to quickly begin production at this plant given the strong
reception to the new Class C products we introduced last year at Open House. That plant began
production in May and the team plans to ramp up production over the fourth quarter.
Do you have plans for additional geographic expansion esp. considering your comments on
capacity constraints?
• We are continually evaluating a variety of options for additional capacity, including potential
acquisitions of existing and newly-constructed facilities in northern Indiana and in the western U.S,
as well as potential construction of new facilities. Each potential location is evaluated on a number
of factors including market demand, proximity to suppliers and dealers, infrastructure and access to
an adequate labor force, as well as cost. As we evaluate these options, we remain mindful that our
industry is defined by its seasonality and cyclicality, and we make decisions on expansion with a
long-term view and are conscious of the threats of over-expansion or under-expansion to meet a
shorter-term market condition. Management’s decision-making seeks to find the optimal positioning
to drive both short-term and long-term performance for our shareholders.
What else are you doing to address the capacity constraints?
• Each of our subsidiary management teams evaluates current orders, backlog and expected future
demand in light of current production capacity for their products. In some cases we choose to
expand capacity, such as the recent expansion of Class C production at Thor Motor Coach. In other
cases, the subsidiaries may shift production between plants based on seasonal demand or shift
production flow to increase effective capacity at existing facilities.
33
INVESTOR Q&A: MARKET CONDITIONS AND
OUTLOOK (CONTINUED)
Thor has lost market share in calendar 2015. Why have you lost market share and what does the
Company plan on doing to address or reverse the losses?
• From a share perspective, we have gained significant market share in motorized, which has been
partially offset by some decreases in towable share, most notably in high-end fifth wheels and some
travel trailers. Market share is certainly a key metric that we monitor for all our product categories –
however, it is not the only metric. Overall, we generally try to take a balanced approach to growing or
maintaining market share across our portfolio of products and growing or maintaining gross margin.
In addition, we have made some critical moves in the past, such as the consolidation of the two
smaller Dutchmen facilities in Idaho and Oregon into the existing Keystone facility in Pendleton,
Oregon. We understood when we closed those plants that it would likely adversely affect our market
share, but that the long-term benefit of improved operating efficiency at the Pendleton plant would
more than offset the cost. In addition, the RV industry is extremely competitive. We have developed
a variety of new products that we believe address the largest and fastest growing segments of the
market, which should help to improve share as they penetrate the broader market.
Describe the current competitive environment, is there much discounting going on?
• The RV industry is always competitive, as our subsidiaries and our outside competitors continue to
drive the industry forward with new and better products for dealers and consumers. However, given
the capacity constraints on certain products, most notably towable RVs, we have seen less
traditional discounting pressure overall in the market than we did several years ago.
34
INVESTOR Q&A: MARKET CONDITIONS AND
OUTLOOK (CONTINUED)
Do we anticipate further RV industry consolidation?
• Although a significant amount of consolidation has already happened within the industry since the
last recession, we do believe that opportunities remain for additional consolidation within the
industry. Consolidation in our industry does not threaten the competitive environment as years of
consolidation have evidenced. In fact, it tends to benefit the industry and broadens the customer
base by driving innovation and attracting more individuals to the RV lifestyle. So, even with more
consolidation, we are confident that the competitive environment that drives innovation and improved
product offerings throughout our industry will continue. In addition, we have seen a number of new
or returning entrants to the RV manufacturer base since the recession as well.
What is your strategic plan for future acquisitions?
• We have established a very disciplined approach to acquisitions to ensure we remain focused on the
factors that provide the greatest likelihood to a successful acquisition and that will provide long-term
value to our shareholders. We are opportunistic in our approach and seek willing sellers at a
reasonable sales price. We also seek companies with strong management teams. We remain
focused on acquisition opportunities within or adjacent to the RV industry.
35
RV WHOLESALE MARKET
TRENDS (UNITS 000s)
295.8
339.6
441.1
413.9
389.9
199.2
106.9
133.6
140.6
196.6
215.7
186.9
189.9
211.7
215.8
187.9
173.1
163.1
203.4
227.8
259.5
247.2
247.5
254.5
292.7
321.2
300.1
256.8
311.0
320.8
370.1
384.4
390.5
353.5
237.0
165.6
242.3
252.3
285.8
321.2
356.8
374.2
396.4
1974
1975
1976
1977
1978
1979
1980
1981
1982
1983
1984
1985
1986
1987
1988
1989
1990
1991
1992
1993
1994
1995
1996
1997
1998
1999
2000
2001
2002
2003
2004
2005
2006
2007
2008
2009
2010
2011
2012
2013
2014
2015
2016(e)
Historical Data: Recreation Vehicle Industry Association, Calendar year 2016: RVIA estimate as of Summer RV Roadsigns, published in May 2016
36
RV MARKET MOTORIZED
WHOLESALE TRENDS (UNITS 000s)
68.9
96.6
156.1
160.2
157.2
64.1
28.5
35.4
41.2
69.5
82.0
68.7
67.7
73.7
72.8
61.1
52.3
41.9
46.9
51.3
58.2
52.8
55.3
55.1
63.5
71.5
61.0
49.2
60.4
62.0
71.7
61.4
55.8
55.4
28.4
13.2
25.2
24.8
28.2
38.4
44.0
47.3
50.9
1974
1975
1976
1977
1978
1979
1980
1981
1982
1983
1984
1985
1986
1987
1988
1989
1990
1991
1992
1993
1994
1995
1996
1997
1998
1999
2000
2001
2002
2003
2004
2005
2006
2007
2008
2009
2010
2011
2012
2013
2014
2015
2016(e)
Historical Data: Recreation Vehicle Industry Association, Calendar year 2016: RVIA estimate as of Summer RV Roadsigns, published in May 2016
37
RV MARKET TOWABLE
WHOLESALE TRENDS (UNITS 000s)
226.9
243.0
285.0
253.7
232.7
135.1
78.4
98.1
99.4
127.1
133.7
118.1
122.1
137.9
142.9
126.7
120.8
121.1
156.5
176.5
201.3
194.3
192.2
199.5
229.1
249.6
239.1
207.6
250.6
258.9
298.3
323.0
334.5
298.1
208.6
152.4
217.1
227.5
257.6
282.8
312.8
326.9
345.5
1974
1975
1976
1977
1978
1979
1980
1981
1982
1983
1984
1985
1986
1987
1988
1989
1990
1991
1992
1993
1994
1995
1996
1997
1998
1999
2000
2001
2002
2003
2004
2005
2006
2007
2008
2009
2010
2011
2012
2013
2014
2015
2016(e)
Historical Data: Recreation Vehicle Industry Association, Calendar year 2016: RVIA estimate as of Summer RV Roadsigns, published in May 2016
38
RV INDUSTRY DEMAND
Industry retail demand has shifted toward more light-weight towables
and gas Class A and Class C motorhomes as consumers seek value
Wholesale units typically outpace retail in the early part of the
calendar year; historically sales become more balanced as we reach
the peak retail selling season
Calendar Year
2013 2014 2015 YTD 2015 YTD 2016
Industry Retail
Registrations*
301,481 units
(+14.7%)
328,866 units
(+9.1%)
369,883 units
(+12.5%)
66,295 units
(+18.5%)
73,145 units
(+10.3%)
Industry
Wholesale
Shipments**
321,127 units
(+12.4%)
356,735 units
(+11.1%)
374,246 units
(+4.9%)
97,074 units
(+7.9%)
108,015 units
(+11.3%)
* Statistical Surveys, Inc., includes US and Canada. 2013, 2014 & 2015 Full Year Actual, YTD 2015 and 2016 through March
** RVIA wholesale shipments for full years 2013, 2014 & 2015, YTD 2015 and 2016 through March
39
THOR BACKLOG AND DEALER
INVENTORY
Dealers remain confident with orders reflecting a shift toward more normal ordering patterns
Orders generally expected to reflect 1-for-1 replacement as units are sold at retail
Backlog: April 30 ($000s),
2016 2015 % Change
Towables $727,539 $484,228 50.2%
Motorized $329,272 $242,560 35.7%
Total RV $1,056,811 $726,788 45.4%
Dealers inventory remains appropriate for current conditions in both towable and motorized
Lenders still comfortable with current dealer inventory turns and current credit line utilization; year-
over-year turns have increased modestly, resulting in a slight reduction in average age of Thor units
on dealers’ lots
Dealer Inventory: April 30, (units)
2016 2015 % Change
RV 82,100 81,300 1.0%
40
RV INDUSTRY RETAIL MARKET
SHARE
Total Share % Total Share % Total Share % Total Share %
THOR* 24,341 33.3% 127,528 34.5% 119,089 36.2% 115,572 38.3%
Forest River** 25,693 35.1% 131,198 35.5% 112,979 34.4% 99,822 33.1%
Jayco*** 9,818 13.4% 49,650 13.4% 41,574 12.6% 37,942 12.6%
Winnebago 2,175 3.0% 11,857 3.2% 10,395 3.2% 8,661 2.9%
Grand Design 1,994 2.7% 6,967 1.9% 4,174 1.3% 813 0.3%
REV Group 773 1.1% 3,380 0.9% 4,888 1.5% 6,034 2.0%
Gulfstream 731 1.0% 4,743 1.3% 4,562 1.4% 4,882 1.6%
Subtotal 65,525 89.6% 335,323 90.7% 297,661 90.5% 273,726 90.8%
All Others 7,620 10.4% 34,560 9.3% 31,205 9.5% 27,755 9.2%
Grand Total 73,145 100.0% 369,883 100.0% 328,866 100.0% 301,481 100.0%
Y/E 12/31/15 Y/E 12/31/14 Y/E 12/31/13YTD 3/31/16
Source: Statistical Surveys, Inc., U.S. and Canada
* Thor adjusted to include historical results of Livin’ Lite, Bison Coach, K-Z, Inc., Cruiser RV and DRV Luxury Suites for all periods presented ** Forest River includes Palomino,
Coachmen, Prime Time, Shasta and Dynamax *** Jayco adjusted to include historical results of Open Range
41
THOR RV RETAIL MARKET SHARE
TREND (UNITS)
40.9% 41.2%
40.2%
37.9%
35.8%
34.2%
19.5% 20.0%
23.3% 23.9%
25.1%
28.0%
14.4%
16.7%
22.1% 21.9% 22.5%
19.0%
2011 2012 2013 2014 2015 2016 YTD**
Towable Retail Share* Class A/C Retail Share* Class B Retail Share*
*Source: Statistical Surveys Inc., U.S. and Canada, calendar year 2010-15. Historical results adjusted to include results of Heartland, Livin’ Lite, Bison Coach, K-Z,
Inc., Cruiser RV and DRV Luxury Suites for all periods presented. **2016 YTD through March.
42
QUARTERLY THOR RV UNIT
SHIPMENTS
0
5,000
10,000
15,000
20,000
25,000
30,000
35,000
40,000
45,000
1Q2006 1Q2007 1Q2008 1Q2009 1Q2010 1Q2011 1Q2012 1Q2013 1Q2014 1Q2015 1Q2016
www.thorindustries.com

More Related Content

What's hot

WGO Investor Presentation - June 2017
WGO Investor Presentation - June 2017WGO Investor Presentation - June 2017
WGO Investor Presentation - June 2017
WinnebagoInd
 
Thor investor presentation 11.30.2015 final
Thor investor presentation 11.30.2015 finalThor investor presentation 11.30.2015 final
Thor investor presentation 11.30.2015 final
Thor_Industries
 
Thor investor presentation fy17 q4 9.27.17 final
Thor investor presentation   fy17 q4 9.27.17 finalThor investor presentation   fy17 q4 9.27.17 final
Thor investor presentation fy17 q4 9.27.17 final
Thor_Industries
 
WGO Investor Presentation - June 2017
WGO Investor Presentation - June 2017WGO Investor Presentation - June 2017
WGO Investor Presentation - June 2017
WinnebagoInd
 
WGO Investor Presentation September 2017
WGO Investor Presentation September 2017WGO Investor Presentation September 2017
WGO Investor Presentation September 2017
WinnebagoInd
 
Thor investor presentation 3.6.14 final
Thor investor presentation 3.6.14   finalThor investor presentation 3.6.14   final
Thor investor presentation 3.6.14 finalThor_Industries
 
Thor basics presentation fy17 q4 9.27.17 final
Thor basics presentation   fy17 q4 9.27.17 finalThor basics presentation   fy17 q4 9.27.17 final
Thor basics presentation fy17 q4 9.27.17 final
Thor_Industries
 
Winnebago Industries Investor Day Presentation
Winnebago Industries Investor Day PresentationWinnebago Industries Investor Day Presentation
Winnebago Industries Investor Day Presentation
WinnebagoInd
 
CL King Conference September 2019
CL King Conference   September 2019CL King Conference   September 2019
CL King Conference September 2019
WinnebagoInd
 
SunTrust NDR - February 2019
SunTrust NDR - February 2019SunTrust NDR - February 2019
SunTrust NDR - February 2019
WinnebagoInd
 
Acquisition of Chris-Craft
Acquisition of Chris-CraftAcquisition of Chris-Craft
Acquisition of Chris-Craft
WinnebagoInd
 
Baird Conference Investor Deck
Baird Conference Investor DeckBaird Conference Investor Deck
Baird Conference Investor Deck
WinnebagoInd
 
Thor Citi Investor Meetings
Thor Citi Investor MeetingsThor Citi Investor Meetings
Thor Citi Investor Meetings
Thor_Industries
 
Sidoti NDR - February 19 & 20, 2019
Sidoti NDR - February 19 & 20, 2019Sidoti NDR - February 19 & 20, 2019
Sidoti NDR - February 19 & 20, 2019
WinnebagoInd
 
Baird Conference Presentation June, 7, 2018
Baird Conference Presentation June, 7, 2018 Baird Conference Presentation June, 7, 2018
Baird Conference Presentation June, 7, 2018
WinnebagoInd
 
Thor basics presentation fy18 q2 final v2
Thor basics presentation   fy18 q2 final v2Thor basics presentation   fy18 q2 final v2
Thor basics presentation fy18 q2 final v2
Thor_Industries
 
Polaris Q3 2016 Earnings Presentation
Polaris Q3 2016 Earnings PresentationPolaris Q3 2016 Earnings Presentation
Polaris Q3 2016 Earnings Presentation
investorpolaris
 
CL King Best Ideas Conference – September, 2018
CL King Best Ideas Conference – September, 2018CL King Best Ideas Conference – September, 2018
CL King Best Ideas Conference – September, 2018
WinnebagoInd
 
Winnebago Industries IR Presentation - April 2019
Winnebago Industries IR Presentation - April 2019Winnebago Industries IR Presentation - April 2019
Winnebago Industries IR Presentation - April 2019
WinnebagoInd
 
Polaris to Acquire Transamerican Auto Parts Presentation
Polaris to Acquire Transamerican Auto Parts PresentationPolaris to Acquire Transamerican Auto Parts Presentation
Polaris to Acquire Transamerican Auto Parts Presentation
investorpolaris
 

What's hot (20)

WGO Investor Presentation - June 2017
WGO Investor Presentation - June 2017WGO Investor Presentation - June 2017
WGO Investor Presentation - June 2017
 
Thor investor presentation 11.30.2015 final
Thor investor presentation 11.30.2015 finalThor investor presentation 11.30.2015 final
Thor investor presentation 11.30.2015 final
 
Thor investor presentation fy17 q4 9.27.17 final
Thor investor presentation   fy17 q4 9.27.17 finalThor investor presentation   fy17 q4 9.27.17 final
Thor investor presentation fy17 q4 9.27.17 final
 
WGO Investor Presentation - June 2017
WGO Investor Presentation - June 2017WGO Investor Presentation - June 2017
WGO Investor Presentation - June 2017
 
WGO Investor Presentation September 2017
WGO Investor Presentation September 2017WGO Investor Presentation September 2017
WGO Investor Presentation September 2017
 
Thor investor presentation 3.6.14 final
Thor investor presentation 3.6.14   finalThor investor presentation 3.6.14   final
Thor investor presentation 3.6.14 final
 
Thor basics presentation fy17 q4 9.27.17 final
Thor basics presentation   fy17 q4 9.27.17 finalThor basics presentation   fy17 q4 9.27.17 final
Thor basics presentation fy17 q4 9.27.17 final
 
Winnebago Industries Investor Day Presentation
Winnebago Industries Investor Day PresentationWinnebago Industries Investor Day Presentation
Winnebago Industries Investor Day Presentation
 
CL King Conference September 2019
CL King Conference   September 2019CL King Conference   September 2019
CL King Conference September 2019
 
SunTrust NDR - February 2019
SunTrust NDR - February 2019SunTrust NDR - February 2019
SunTrust NDR - February 2019
 
Acquisition of Chris-Craft
Acquisition of Chris-CraftAcquisition of Chris-Craft
Acquisition of Chris-Craft
 
Baird Conference Investor Deck
Baird Conference Investor DeckBaird Conference Investor Deck
Baird Conference Investor Deck
 
Thor Citi Investor Meetings
Thor Citi Investor MeetingsThor Citi Investor Meetings
Thor Citi Investor Meetings
 
Sidoti NDR - February 19 & 20, 2019
Sidoti NDR - February 19 & 20, 2019Sidoti NDR - February 19 & 20, 2019
Sidoti NDR - February 19 & 20, 2019
 
Baird Conference Presentation June, 7, 2018
Baird Conference Presentation June, 7, 2018 Baird Conference Presentation June, 7, 2018
Baird Conference Presentation June, 7, 2018
 
Thor basics presentation fy18 q2 final v2
Thor basics presentation   fy18 q2 final v2Thor basics presentation   fy18 q2 final v2
Thor basics presentation fy18 q2 final v2
 
Polaris Q3 2016 Earnings Presentation
Polaris Q3 2016 Earnings PresentationPolaris Q3 2016 Earnings Presentation
Polaris Q3 2016 Earnings Presentation
 
CL King Best Ideas Conference – September, 2018
CL King Best Ideas Conference – September, 2018CL King Best Ideas Conference – September, 2018
CL King Best Ideas Conference – September, 2018
 
Winnebago Industries IR Presentation - April 2019
Winnebago Industries IR Presentation - April 2019Winnebago Industries IR Presentation - April 2019
Winnebago Industries IR Presentation - April 2019
 
Polaris to Acquire Transamerican Auto Parts Presentation
Polaris to Acquire Transamerican Auto Parts PresentationPolaris to Acquire Transamerican Auto Parts Presentation
Polaris to Acquire Transamerican Auto Parts Presentation
 

Viewers also liked

SVN Live™ Open Sales Call 7-11-16
SVN Live™ Open Sales Call 7-11-16SVN Live™ Open Sales Call 7-11-16
SVN Live™ Open Sales Call 7-11-16
SVN International Corp.
 
Unconventional Oil & Gas: Reshaping Energy Markets
Unconventional Oil & Gas: Reshaping Energy MarketsUnconventional Oil & Gas: Reshaping Energy Markets
Unconventional Oil & Gas: Reshaping Energy Markets
Enel S.p.A.
 
Using a Community Health System to Strengthen the performance of Village Heal...
Using a Community Health System to Strengthen the performance of Village Heal...Using a Community Health System to Strengthen the performance of Village Heal...
Using a Community Health System to Strengthen the performance of Village Heal...
CORE Group
 
Selling your business and creating a business sales pack for the buyer
Selling your business and creating a business sales pack for the buyerSelling your business and creating a business sales pack for the buyer
Selling your business and creating a business sales pack for the buyer
Brent Spilkin
 
Unconventional oil and gas implications for global field development
Unconventional oil and gas implications for global field developmentUnconventional oil and gas implications for global field development
Unconventional oil and gas implications for global field development
Drillinginfo
 
How to Value Your Business
How to Value Your BusinessHow to Value Your Business
How to Value Your Business
Tom MacPherson
 
BUSINESS NETWORK
BUSINESS NETWORKBUSINESS NETWORK
BUSINESS NETWORK
Emerson Ehouman
 
Engagio - Norwest Webinar - Ken Rutsky's Slides: What Do We Say
Engagio - Norwest Webinar - Ken Rutsky's Slides: What Do We SayEngagio - Norwest Webinar - Ken Rutsky's Slides: What Do We Say
Engagio - Norwest Webinar - Ken Rutsky's Slides: What Do We Say
Engagio
 
Petrolio e benzina 28.2.15
Petrolio e benzina  28.2.15Petrolio e benzina  28.2.15
Petrolio e benzina 28.2.15
Francesco Alberto Comellini ∴
 
Social Media - Basics & Beyond
Social Media - Basics & BeyondSocial Media - Basics & Beyond
Social Media - Basics & Beyond
Paul Segreto
 

Viewers also liked (10)

SVN Live™ Open Sales Call 7-11-16
SVN Live™ Open Sales Call 7-11-16SVN Live™ Open Sales Call 7-11-16
SVN Live™ Open Sales Call 7-11-16
 
Unconventional Oil & Gas: Reshaping Energy Markets
Unconventional Oil & Gas: Reshaping Energy MarketsUnconventional Oil & Gas: Reshaping Energy Markets
Unconventional Oil & Gas: Reshaping Energy Markets
 
Using a Community Health System to Strengthen the performance of Village Heal...
Using a Community Health System to Strengthen the performance of Village Heal...Using a Community Health System to Strengthen the performance of Village Heal...
Using a Community Health System to Strengthen the performance of Village Heal...
 
Selling your business and creating a business sales pack for the buyer
Selling your business and creating a business sales pack for the buyerSelling your business and creating a business sales pack for the buyer
Selling your business and creating a business sales pack for the buyer
 
Unconventional oil and gas implications for global field development
Unconventional oil and gas implications for global field developmentUnconventional oil and gas implications for global field development
Unconventional oil and gas implications for global field development
 
How to Value Your Business
How to Value Your BusinessHow to Value Your Business
How to Value Your Business
 
BUSINESS NETWORK
BUSINESS NETWORKBUSINESS NETWORK
BUSINESS NETWORK
 
Engagio - Norwest Webinar - Ken Rutsky's Slides: What Do We Say
Engagio - Norwest Webinar - Ken Rutsky's Slides: What Do We SayEngagio - Norwest Webinar - Ken Rutsky's Slides: What Do We Say
Engagio - Norwest Webinar - Ken Rutsky's Slides: What Do We Say
 
Petrolio e benzina 28.2.15
Petrolio e benzina  28.2.15Petrolio e benzina  28.2.15
Petrolio e benzina 28.2.15
 
Social Media - Basics & Beyond
Social Media - Basics & BeyondSocial Media - Basics & Beyond
Social Media - Basics & Beyond
 

Similar to Thor investor presentation 6.6.16

Investor presentation20140317
Investor presentation20140317Investor presentation20140317
Investor presentation20140317Thor_Industries
 
First Quarter 2015 Investor Presentation
First Quarter 2015 Investor PresentationFirst Quarter 2015 Investor Presentation
First Quarter 2015 Investor Presentation
Thor_Industries
 
THOR Investor Presentation December 2014
THOR Investor Presentation December 2014THOR Investor Presentation December 2014
THOR Investor Presentation December 2014
Thor_Industries
 
Thor investor presentation20140422_v001_m302cw
Thor investor presentation20140422_v001_m302cwThor investor presentation20140422_v001_m302cw
Thor investor presentation20140422_v001_m302cwThor_Industries
 
Baird 2015 Growth Stock Conference
Baird 2015 Growth Stock ConferenceBaird 2015 Growth Stock Conference
Baird 2015 Growth Stock Conference
Thor_Industries
 
Thor investor presentation 8.5.13
Thor investor presentation 8.5.13Thor investor presentation 8.5.13
Thor investor presentation 8.5.13Thor_Industries
 
Fourth Quarter 2013 Investor Presentation
Fourth Quarter 2013 Investor PresentationFourth Quarter 2013 Investor Presentation
Fourth Quarter 2013 Investor Presentation
Thor_Industries
 
Fourth Quarter 2013 Investor Presentation
Fourth Quarter 2013 Investor PresentationFourth Quarter 2013 Investor Presentation
Fourth Quarter 2013 Investor PresentationThor_Industries
 
Thor investor presentation 2.4.14 final v001-r65kg4
Thor investor presentation 2.4.14   final v001-r65kg4Thor investor presentation 2.4.14   final v001-r65kg4
Thor investor presentation 2.4.14 final v001-r65kg4Thor_Industries
 
Morgan stanley conference final
Morgan stanley conference   finalMorgan stanley conference   final
Morgan stanley conference final
irusfoods
 
Q4 2017 earnings slides
Q4 2017 earnings slidesQ4 2017 earnings slides
Q4 2017 earnings slides
molsoncoorsir
 
First quarter 2014 investor presentation
First quarter 2014 investor presentationFirst quarter 2014 investor presentation
First quarter 2014 investor presentationThor_Industries
 
Thor Investor Presentation Citi Conference 5.30.13
Thor Investor Presentation Citi Conference 5.30.13Thor Investor Presentation Citi Conference 5.30.13
Thor Investor Presentation Citi Conference 5.30.13Thor_Industries
 
2018 used car market report
2018 used car market report2018 used car market report
2018 used car market report
RMS Automotive, A Cox Automotive Company
 
20160113 icr presentation vfinal
20160113 icr presentation vfinal20160113 icr presentation vfinal
20160113 icr presentation vfinal
Sysco_Investors
 
Sysco at 2016 Barclays Global Consumer Staples Conference
Sysco at 2016 Barclays Global Consumer Staples Conference Sysco at 2016 Barclays Global Consumer Staples Conference
Sysco at 2016 Barclays Global Consumer Staples Conference
Sysco_Investors
 
Q3 fy17 earnings presentation v final
Q3 fy17 earnings presentation v finalQ3 fy17 earnings presentation v final
Q3 fy17 earnings presentation v final
ir_westrock
 
First quarter 2014 investor presentation 2013 10-02
First quarter 2014 investor presentation 2013 10-02First quarter 2014 investor presentation 2013 10-02
First quarter 2014 investor presentation 2013 10-02Thor_Industries
 
Ifc investor presentation (march 6 2017)
Ifc investor presentation (march 6 2017)Ifc investor presentation (march 6 2017)
Ifc investor presentation (march 6 2017)
Intact
 
Why invest-page-update-071017
Why invest-page-update-071017Why invest-page-update-071017
Why invest-page-update-071017
molsoncoorsir
 

Similar to Thor investor presentation 6.6.16 (20)

Investor presentation20140317
Investor presentation20140317Investor presentation20140317
Investor presentation20140317
 
First Quarter 2015 Investor Presentation
First Quarter 2015 Investor PresentationFirst Quarter 2015 Investor Presentation
First Quarter 2015 Investor Presentation
 
THOR Investor Presentation December 2014
THOR Investor Presentation December 2014THOR Investor Presentation December 2014
THOR Investor Presentation December 2014
 
Thor investor presentation20140422_v001_m302cw
Thor investor presentation20140422_v001_m302cwThor investor presentation20140422_v001_m302cw
Thor investor presentation20140422_v001_m302cw
 
Baird 2015 Growth Stock Conference
Baird 2015 Growth Stock ConferenceBaird 2015 Growth Stock Conference
Baird 2015 Growth Stock Conference
 
Thor investor presentation 8.5.13
Thor investor presentation 8.5.13Thor investor presentation 8.5.13
Thor investor presentation 8.5.13
 
Fourth Quarter 2013 Investor Presentation
Fourth Quarter 2013 Investor PresentationFourth Quarter 2013 Investor Presentation
Fourth Quarter 2013 Investor Presentation
 
Fourth Quarter 2013 Investor Presentation
Fourth Quarter 2013 Investor PresentationFourth Quarter 2013 Investor Presentation
Fourth Quarter 2013 Investor Presentation
 
Thor investor presentation 2.4.14 final v001-r65kg4
Thor investor presentation 2.4.14   final v001-r65kg4Thor investor presentation 2.4.14   final v001-r65kg4
Thor investor presentation 2.4.14 final v001-r65kg4
 
Morgan stanley conference final
Morgan stanley conference   finalMorgan stanley conference   final
Morgan stanley conference final
 
Q4 2017 earnings slides
Q4 2017 earnings slidesQ4 2017 earnings slides
Q4 2017 earnings slides
 
First quarter 2014 investor presentation
First quarter 2014 investor presentationFirst quarter 2014 investor presentation
First quarter 2014 investor presentation
 
Thor Investor Presentation Citi Conference 5.30.13
Thor Investor Presentation Citi Conference 5.30.13Thor Investor Presentation Citi Conference 5.30.13
Thor Investor Presentation Citi Conference 5.30.13
 
2018 used car market report
2018 used car market report2018 used car market report
2018 used car market report
 
20160113 icr presentation vfinal
20160113 icr presentation vfinal20160113 icr presentation vfinal
20160113 icr presentation vfinal
 
Sysco at 2016 Barclays Global Consumer Staples Conference
Sysco at 2016 Barclays Global Consumer Staples Conference Sysco at 2016 Barclays Global Consumer Staples Conference
Sysco at 2016 Barclays Global Consumer Staples Conference
 
Q3 fy17 earnings presentation v final
Q3 fy17 earnings presentation v finalQ3 fy17 earnings presentation v final
Q3 fy17 earnings presentation v final
 
First quarter 2014 investor presentation 2013 10-02
First quarter 2014 investor presentation 2013 10-02First quarter 2014 investor presentation 2013 10-02
First quarter 2014 investor presentation 2013 10-02
 
Ifc investor presentation (march 6 2017)
Ifc investor presentation (march 6 2017)Ifc investor presentation (march 6 2017)
Ifc investor presentation (march 6 2017)
 
Why invest-page-update-071017
Why invest-page-update-071017Why invest-page-update-071017
Why invest-page-update-071017
 

More from Thor_Industries

Fourth Quarter 2013 Investor Presentation
Fourth Quarter 2013 Investor PresentationFourth Quarter 2013 Investor Presentation
Fourth Quarter 2013 Investor Presentation
Thor_Industries
 
Fourth Quarter 2013 Investor Presentation
Fourth Quarter 2013 Investor PresentationFourth Quarter 2013 Investor Presentation
Fourth Quarter 2013 Investor Presentation
Thor_Industries
 
Thor Wedbush Investor Meetings
Thor Wedbush Investor MeetingsThor Wedbush Investor Meetings
Thor Wedbush Investor Meetings
Thor_Industries
 
Thor Fiscal Third Quarter 2013 Investor Presentation
Thor Fiscal Third Quarter 2013 Investor PresentationThor Fiscal Third Quarter 2013 Investor Presentation
Thor Fiscal Third Quarter 2013 Investor Presentation
Thor_Industries
 
Fiscal Third Quarter 2013 Investor Presentation
Fiscal Third Quarter 2013 Investor PresentationFiscal Third Quarter 2013 Investor Presentation
Fiscal Third Quarter 2013 Investor Presentation
Thor_Industries
 
Thor at Baird 2013 Growth Stock Conference
Thor at Baird 2013 Growth Stock ConferenceThor at Baird 2013 Growth Stock Conference
Thor at Baird 2013 Growth Stock Conference
Thor_Industries
 
Fiscal Third Quarter 2013 Investor Presentation
Fiscal Third Quarter 2013 Investor PresentationFiscal Third Quarter 2013 Investor Presentation
Fiscal Third Quarter 2013 Investor Presentation
Thor_Industries
 

More from Thor_Industries (7)

Fourth Quarter 2013 Investor Presentation
Fourth Quarter 2013 Investor PresentationFourth Quarter 2013 Investor Presentation
Fourth Quarter 2013 Investor Presentation
 
Fourth Quarter 2013 Investor Presentation
Fourth Quarter 2013 Investor PresentationFourth Quarter 2013 Investor Presentation
Fourth Quarter 2013 Investor Presentation
 
Thor Wedbush Investor Meetings
Thor Wedbush Investor MeetingsThor Wedbush Investor Meetings
Thor Wedbush Investor Meetings
 
Thor Fiscal Third Quarter 2013 Investor Presentation
Thor Fiscal Third Quarter 2013 Investor PresentationThor Fiscal Third Quarter 2013 Investor Presentation
Thor Fiscal Third Quarter 2013 Investor Presentation
 
Fiscal Third Quarter 2013 Investor Presentation
Fiscal Third Quarter 2013 Investor PresentationFiscal Third Quarter 2013 Investor Presentation
Fiscal Third Quarter 2013 Investor Presentation
 
Thor at Baird 2013 Growth Stock Conference
Thor at Baird 2013 Growth Stock ConferenceThor at Baird 2013 Growth Stock Conference
Thor at Baird 2013 Growth Stock Conference
 
Fiscal Third Quarter 2013 Investor Presentation
Fiscal Third Quarter 2013 Investor PresentationFiscal Third Quarter 2013 Investor Presentation
Fiscal Third Quarter 2013 Investor Presentation
 

Recently uploaded

Investor Day 2024 Presentation Sysco 2024
Investor Day 2024 Presentation Sysco 2024Investor Day 2024 Presentation Sysco 2024
Investor Day 2024 Presentation Sysco 2024
Sysco_Investors
 
Osisko Development - Investor Presentation - June 24
Osisko Development - Investor Presentation - June 24Osisko Development - Investor Presentation - June 24
Osisko Development - Investor Presentation - June 24
Philip Rabenok
 
Collective Mining | Corporate Presentation - May 2024
Collective Mining | Corporate Presentation - May 2024Collective Mining | Corporate Presentation - May 2024
Collective Mining | Corporate Presentation - May 2024
CollectiveMining1
 
Collective Mining | Corporate Presentation - May 2024
Collective Mining | Corporate Presentation - May 2024Collective Mining | Corporate Presentation - May 2024
Collective Mining | Corporate Presentation - May 2024
CollectiveMining1
 
cyberagent_For New Investors_EN_240424.pdf
cyberagent_For New Investors_EN_240424.pdfcyberagent_For New Investors_EN_240424.pdf
cyberagent_For New Investors_EN_240424.pdf
CyberAgent, Inc.
 
New Tax Regime User Guide Flexi Plan Revised (1).pptx
New Tax Regime User Guide Flexi Plan Revised (1).pptxNew Tax Regime User Guide Flexi Plan Revised (1).pptx
New Tax Regime User Guide Flexi Plan Revised (1).pptx
RajkumarRajamanikam
 
Snam 2023-27 Industrial Plan - Financial Presentation
Snam 2023-27 Industrial Plan - Financial PresentationSnam 2023-27 Industrial Plan - Financial Presentation
Snam 2023-27 Industrial Plan - Financial Presentation
Valentina Ottini
 
Corporate Presentation Probe June 2024.pdf
Corporate Presentation Probe June 2024.pdfCorporate Presentation Probe June 2024.pdf
Corporate Presentation Probe June 2024.pdf
Probe Gold
 

Recently uploaded (8)

Investor Day 2024 Presentation Sysco 2024
Investor Day 2024 Presentation Sysco 2024Investor Day 2024 Presentation Sysco 2024
Investor Day 2024 Presentation Sysco 2024
 
Osisko Development - Investor Presentation - June 24
Osisko Development - Investor Presentation - June 24Osisko Development - Investor Presentation - June 24
Osisko Development - Investor Presentation - June 24
 
Collective Mining | Corporate Presentation - May 2024
Collective Mining | Corporate Presentation - May 2024Collective Mining | Corporate Presentation - May 2024
Collective Mining | Corporate Presentation - May 2024
 
Collective Mining | Corporate Presentation - May 2024
Collective Mining | Corporate Presentation - May 2024Collective Mining | Corporate Presentation - May 2024
Collective Mining | Corporate Presentation - May 2024
 
cyberagent_For New Investors_EN_240424.pdf
cyberagent_For New Investors_EN_240424.pdfcyberagent_For New Investors_EN_240424.pdf
cyberagent_For New Investors_EN_240424.pdf
 
New Tax Regime User Guide Flexi Plan Revised (1).pptx
New Tax Regime User Guide Flexi Plan Revised (1).pptxNew Tax Regime User Guide Flexi Plan Revised (1).pptx
New Tax Regime User Guide Flexi Plan Revised (1).pptx
 
Snam 2023-27 Industrial Plan - Financial Presentation
Snam 2023-27 Industrial Plan - Financial PresentationSnam 2023-27 Industrial Plan - Financial Presentation
Snam 2023-27 Industrial Plan - Financial Presentation
 
Corporate Presentation Probe June 2024.pdf
Corporate Presentation Probe June 2024.pdfCorporate Presentation Probe June 2024.pdf
Corporate Presentation Probe June 2024.pdf
 

Thor investor presentation 6.6.16

  • 2. 2 FORWARD LOOKING STATEMENTS This presentation includes certain statements that are “forward looking” statements within the meaning of the U.S. Private Securities Litigation Reform Act of 1995, Section 27A of the Securities Act of 1933, as amended, and Section 21E of the Securities Exchange Act of 1934, as amended. These forward looking statements are made based on management’s current expectations and beliefs regarding future and anticipated developments and their effects upon Thor Industries, Inc., and inherently involve uncertainties and risks. These forward looking statements are not a guarantee of future performance. There can be no assurance that actual results will not differ from our expectations. Factors which could cause materially different results include, among others, raw material and commodity price fluctuations, material or chassis supply restrictions, legislative and regulatory developments, the costs of compliance with increased governmental regulation, legal issues, the potential impact of increased tax burdens on our dealers and retail consumers, lower consumer confidence and the level of discretionary consumer spending, interest rate fluctuations and the potential economic impact of rising interest rates, restrictive lending practices, management changes, the success of new product introductions, the pace of obtaining and producing at new production facilities, the pace of acquisitions, the potential loss of existing customers of acquisitions, the integration of new acquisitions, the loss or reduction of sales to key dealers, the availability of delivery personnel, asset impairment charges, cost structure changes, competition, the impact of potential losses under repurchase agreements, the potential impact of the strengthening U.S. dollar on international demand, general economic, market and political conditions and the other risks and uncertainties discussed more fully in ITEM 1A of our Annual Report on Form 10-K for the year ended July 31, 2015 and Part II, Item 1A of our quarterly report on Form 10-Q for the period ending April 30, 2016. We disclaim any obligation or undertaking to disseminate any updates or revisions to any forward looking statements contained in this presentation or to reflect any change in our expectations after the date of this presentation or any change in events, conditions or circumstances on which any statement is based, except as required by law.
  • 3. 3 THOR AT A GLANCE Founded in 1980 by Wade Thompson & Peter Orthwein with the acquisition of Airstream, Inc. One of the world’s largest manufacturers of recreational vehicles representing a broad range of major brands Two major business segments include: • Towable RVs such as travel trailers, fifth wheels and specialty trailers • Motorized RVs which include Class A, B and C motorhomes Operations in 148 facilities* located in Indiana, Michigan, Ohio and Oregon Products sold through independent retail distributors primarily in the U.S. and Canada Historically strong cash flow and solid balance sheet Approximately 10,450 employees* Listed on the NYSE under ticker THO $1,849 $2,340 $2,640 $3,242 $3,525 $4,007 FY10 FY11 FY12 FY13 FY14 FY15 Net Sales (continuing operations, $ millions) $1.72 $1.66 $2.07 $2.86 $3.29 $3.79 FY10 FY11 FY12 FY13 FY14 FY15 Diluted EPS (continuing operations) *as of July 31, 2015
  • 4. 4 THOR’S RV PRODUCT RANGE Travel Trailers (hitch to the bumper of the tow vehicle) Fifth Wheels (hitch to a specially mounted hitch in the bed of a pickup truck) Specialty Trailers (includes camping trailers, truck campers and horse trailers with living quarters) Towable RV's $3,096.4 77% Motorized RV's $870.8 22% Other $39.6 1% FY2015 Sales* Towable RV Segment Products Class A Motorhomes (fully enclosed, bus style motorhome) Class B and C Motorhomes (B – van motorhomes, C – living area built on van or pickup chassis) Motorized RV Segment Products *Fiscal Year ended July 31, 2015, in millions
  • 5. 5 CONSISTENT GROWTH IN EARNINGS $1.72 $1.66 $2.07 $2.86 $3.29 $3.79 $0.00 $0.50 $1.00 $1.50 $2.00 $2.50 $3.00 $3.50 $4.00 FY10 FY11 FY12 FY13 FY14 FY15 Diluted EPS, Continuing Ops. $91.2 $91.6 $111.4 $151.7 $175.5 $202.0 $0 $50 $100 $150 $200 $250 FY10 FY11 FY12 FY13 FY14 FY15 Net Income, Continuing Ops., $ Millions
  • 6. 6 REGULAR QUARTERLY DIVIDENDS Fiscal years ended July 31, $0.10 $0.15 $0.18 $0.23 $0.27 $0.30 FY11 FY12 FY13 FY14 FY15 FY16 *In addition to regular quarterly dividends, Thor paid special dividends of $1.50 in FY13 and $1.00 in FY14. The declaration of future dividends and the establishment of the per share amounts, record dates and payment dates for any such future dividends are subject to the determination of the Board, and will be dependent upon future earnings, cash flows and other factors.
  • 7. 7 THOR OPERATING ENTITIES – STRONG BRANDS
  • 8. 8 STRATEGIC VISION FOR GROWTH At Thor we strive to provide RV consumers with superior products and services through innovative solutions which enhance the enjoyment of the RV lifestyle Our decentralized operating structure and independent operating subsidiaries foster an entrepreneurial spirit and an unending focus on the needs of the users of our products – resulting in our drive to lead the industry with innovation, product quality and customer service Our focus requires that we make decisions based on the long-term success of our Company: • While we strive to lead the industry in market share, we will not strive for market share at the expense of quality or without regard to bottom-line impact • Growth is important, but this is a business of relationships, and we realize that the key to long-term sustainable sales growth rests in the strength of our relationships with consumers, dealers and suppliers • Our relationship with shareholders is important ― profits are a key driver to our long-term success • The path to long-term success is seldom straight, so our leaders manage in a way that moves us closer to our goals, even though it might impact our results in the short term
  • 9. 9 THOR COMPETITIVE ADVANTAGES Primary focus on assembly: • Vertical integration – only where it makes sense • Flexibility – performance in any market condition • Low overhead costs • High return on assets employed Strong market share in the primary RV categories – Travel Trailers, Fifth Wheels and Motorized (#1 in motorized, #2 in towables)* • Provides scale and purchasing power • Low cost, high volume producer – generates improved margin Solid balance sheet Meaningful increases in production capacity during FY14 and FY15 Diversified lineup of innovative product offerings Strong relationships with wholesale financing providers Excellent relationships with dealers, lenders and consumers based on financial strength to provide warranty and honor repurchase agreements *Source: Statistical Surveys, Inc., U.S. and Canada, year-to-date through March, 2016.
  • 10. 10 INVESTING IN THE FUTURE - CAPACITY $12,767 $33,698 $10,442 $24,190 $30,438 $43,055 $0 $10,000 $20,000 $30,000 $40,000 $50,000 FY10 FY11 FY12 FY13 FY14 FY15 Thousands Capital Acquisitions $19,756 $99,562 $170 $10,718 $86,092 $194,486 $0 $50,000 $100,000 $150,000 $200,000 $250,000 FY10 FY11 FY12 FY13 FY14 FY15 Thousands Business Acquisitions
  • 11. 11 CORPORATE INTEGRITY No golden parachutes No ‘pro forma’ earnings. We report net income, not adjusted earnings to cover up performance Consistent focus on shareholder value Simple compensation philosophy: • Mainly cash compensation based on pre-tax income – a true pay- for-performance philosophy • Restricted stock units also awarded based on performance to provide broader, long-term focus on overall Company results
  • 12. 12 RV INDUSTRY CONDITIONS REMAIN POSITIVE Although consumer confidence has remained range bound since the beginning of 2016, it remains at the highest levels since the recession. Final results rose to 94.7 in May from 89.0 in April. This compares with 90.7 a year ago.* Consumers are more optimistic about their financial prospects and anticipate somewhat lower inflation rates in the future. The main areas of uncertainty for consumers surround whether the Federal Reserve will increase interest rates over the next few months and the potential impact of the Presidential election on the overall economy.* Recreation Vehicle Industry Association (RVIA) forecast in May 2016 that calendar 2016 wholesale shipments for all RV categories should increase to 396,400 units, or an increase of 5.9% over calendar year 2015.** Pricing and promotional environment remains competitive, but generally improved over prior year. Domestic travel offers fewer risks than international travel at a more compelling value. Low fuel prices make RV travel increasingly attractive for consumers. *Source: University of Michigan final Consumer Sentiment Index for May 2016 **Source: RVIA Roadsigns Summer 2016
  • 13. 13 CONSUMER TRENDS: GROWING RV POPULARITY Leisure travel such as camping continues to be popular* Approximately 29.7 million households in North America camp at least once a year, but only 22% of them are RV campers. The remaining campers primarily use tents or cabins, which makes them a solid target market for the RV industry. Favorable demographics* Baby boomers (a prime RV target market for many years) represent 24% of the population and are a target market as they reach retirement age and have more time for travel. Generation X and Millennials offer future opportunities as they seek more active outdoor experiences with their families. Increasingly diverse potential customer base – Hispanic, African American, Asian and other ethnicities grew from 13% in 2012 to 23% in 2015. Younger campers (25-34 age) are also a growing market – from 18% in 2012 to 23% in 2015. New applications – broader usage Growth in use at extreme sporting events, youth sports leagues and tournaments, dog and craft shows, and collegiate sports activities for alumni and fans. *Source: Kampgrounds of America (KOA) 2015 North American Camping Report
  • 14. 14 CONSUMER TRENDS: GROWING RV POPULARITY Opportunities with Millennials* Millennials (defined as age 19-35) are camping more, with 58% surveyed indicating they plan to camp more nights in 2016. This dempgraphic is camping in groups, as they view camping as an opportunity to spend time with family and friends. Younger campers also view camping as a way to reduce stress, escape the pressures of everyday life, be more active and lead a healthier lifestyle. Increasing Diversity Among Campers* Although Hispanic, African American, Asian and other ethnicities accounted for 23% of campers in 2015, they represented 40% of new campers in 2015 – showing their strong, long-term growth potential. These increasingly diverse campers view camping as an affordable vacation option that allows them to be more active, reduce stress and spend more time with family and friends. Hispanic campers have grown from 6% to 8% of campers over the past year. Based on survey responses, they also seem much more likely to continue camping, as they were the group most likely to say they plan to spend more nights camping in 2016. *Source: Kampgrounds of America (KOA) 2015 North American Camping Report
  • 15. 15 POSTLE ALUMINUM ACQUISITION ENSURES SUPPLY OF KEY MATERIAL COMPONENT On May 1, 2015 Thor acquired Postle Aluminum, based in Elkhart, Indiana, for approximately $144 million in cash, net of cash acquired. Postle generated sales of approximately $220 million in calendar 2014 and we expect the acquisition to be accretive to earnings. Approximately 30% of total sales are to Thor subsidiaries and approximately 75% of total sales were to the RV industry. The remaining sales are to the specialty truck and trailer, cargo, marine and fencing industries. Postle produces a variety of aluminum extrusions, specialized components and powder coating and painting services. The current management team will continue to lead the company as a separate Thor subsidiary.
  • 16. 16 THIRD QUARTER REFLECTS RECORD PERFORMANCE Three Months Ended April 30, 2016 2015 % Chg. Net Sales $1,284.1 $1,174.3 9.4% Gross Profit 201.9 166.6 21.2% % of Sales 15.7% 14.2% SG&A 80.8 68.9 17.3% % of Sales 6.3% 5.9% Income Before Tax (cont. ops.) $116.3 $94.6 23.0% % of Sales 9.1% 8.1% Income Taxes 37.1 31.0 Net Income (cont. ops.) $79.2 $63.6 24.6% Diluted EPS (cont. ops.) $1.51 $1.19 26.9% Amounts in millions, except per share data
  • 17. 17 THIRD QUARTER 2016 RESULTS FROM CONTINUING OPERATIONS UP DOUBLE DIGITS Bob Martin – Thor President & CEO: “We continued to see the benefits of executing our strategic operating plan in the third quarter, resulting in record sales and bottom-line results. As our core markets continued to grow, we were able to generate improved margins and profitability based on growth in revenues, improved product mix and lower material costs. This spring we have visited dealers and attended dealer meetings where we have heard consistent feedback that our dealer partners are seeing an influx of younger consumers entering our markets, which gives us optimism for the long-term growth of our business and industry. As we see growth of younger and more ethnically diverse consumers, we continue to invest in new product features and floorplans to meet their needs. Thor leads in innovation with new technology features that make RVs easier to use and better connected, positioning us to expand our markets over the long term.” Peter Orthwein – Thor Executive Chairman: “Since our founding, Thor has pursued strategic growth through acquisitions in markets with the greatest opportunities, followed by investments to support their growth and long-term success. The record results we posted this quarter illustrate the power of our business model, particularly when the market is performing as well as it is currently. As we continue to build on our history, we have every reason to be optimistic about the future of Thor and our industry, particularly as we attract younger families into the RV lifestyle to drive future growth in sales, net income and total returns to our shareholders.” $1,174.3 $1,284.1 FY15 FY16 Net Sales ($ millions) +9% $63.6 $79.2 FY15 FY16 Net Income (Continuing Ops.) +25% $1.19 $1.51 FY15 FY16 Diluted EPS (Continuing Ops.) +27% $726.8 $1,056.8 FY15 FY16 RV Backlog ($ millions) +45% Note: Third quarter 2016 Results include Postle acquired May 1, 2015.
  • 18. 18 KEY TAKEAWAYS Profitable every year since our founding in 1980 – 35 years of profitability We are primarily assemblers, not manufacturers Variable cost structure provides flexibility in cyclical industry Known as innovators in the industry Strong market share in all main RV product categories Solid balance sheet – history of returning cash to shareholders Strong consumer, dealer and lender relationships Experienced team
  • 20. 20 INVESTOR Q&A: THIRD QUARTER AND YEAR- TO-DATE OPERATING RESULTS Sales growth for the third quarter of 9.4% decelerated from the first half of the year of 13.0%, what was different in the first half? • The growth rate in third quarter revenues was driven by the continued growth in the overall RV market as well as the solid market acceptance of our numerous new products and features introduced at Open House last fall. The growth in the Open House over the past several years has resulted in a shift in revenues earlier in the fiscal year as dealers tend to place more of their orders in September rather than at Louisville in early December, resulting in deliveries and related revenues occurring earlier in the fiscal year. In addition, some of the growth in the first half of fiscal 2016 was due to acquisitions that were not included in prior year figures. • Compared with the growth in industry wholesale shipments, we have been significantly outperforming in the motorized segment (36% growth vs. 17% industry growth), and slightly underperforming in the towable segment (7% growth vs. 10% industry growth). Our performance in the towable market is driven, in part, by our outsized presence in the fifth wheel segment of the towables market, which has been much softer than the travel trailer segment of the towables market so far this calendar year. In travel trailers, we have been nimble in shifting production and growing our production capacity toward the market trends of lower-cost travel trailers that have been popular with new, younger consumers entering the market.
  • 21. 21 INVESTOR Q&A: THIRD QUARTER AND YEAR- TO-DATE OPERATING RESULTS (CONTINUED) What were the drivers of third-quarter and year-to-date gross margin improvements? Is the current gross margin percentage sustainable? • Improvements in gross margin were due primarily to favorable changes in product mix and improvements in material costs compared to the prior year. Growth in gross profit margin will become more challenging in the fourth quarter as certain benefits to gross margin, specifically the $10 million impact of the retroactive reinstatement of tariff rebates on certain imported raw material in the fourth quarter of fiscal 2015, will not repeat in the fourth quarter of fiscal 2016. We believe it is important to view the sustainability of gross margin rates on an annual basis and we believe our current annual gross margin rates are sustainable so long as current market and economic conditions remain positive. Can you explain the factors that drove the 150 basis-point increase in gross margin in the quarter? • The increase in overall gross margin was primarily the result of improved gross margin in the Towable Segment driven primarily by improvements in product mix and material costs as a percent of sales. For Towable RVs material, labor, freight-out and warranty costs as a combined percentage of Towable net sales decreased to 78.3% for the three months ended April 30, 2016 compared to 80.0% for the three months ended April 30, 2015. This decrease in percentage was primarily the result of a decrease in the material cost percentage of sales due to favorable product mix, selective net selling price increases and improved material management since the prior year period. Freight-out improved as a percentage of sales as well.
  • 22. 22 INVESTOR Q&A: QUARTER AND YEAR-TO- DATE OPERATING RESULTS (CONTINUED) What factors are causing Corporate selling, general and administrative expenses to increase for both the quarter and year-to-date periods? • For the quarter, Corporate selling, general and administrative expenses increased $2.4 million to $12.1 million for the three months ended April 30, 2016 compared to $9.7 million for the three months ended April 30, 2015. The increase is primarily due to an increase in compensation costs, as bonuses increased $0.3 million in correlation with the increase in income from continuing operations before income taxes compared to the prior year, and stock-based compensation increased $0.6 million. The stock-based compensation increase is due to increasing income from continuing operations before income taxes over the past three years, as most stock awards vest ratably over a three-year period. In addition, deferred compensation expense increased $0.3 million, which relates to the equal and offsetting increase in net other Corporate income, due to the market value change in the deferred compensation plan assets. Legal and professional fees also increased $0.7 million, largely attributable to fees incurred related to strategic growth initiatives and increased sales and marketing initiatives.
  • 23. 23 INVESTOR Q&A: THIRD QUARTER AND YEAR- TO-DATE OPERATING RESULTS (CONTINUED) What factors are causing Corporate selling, general and administrative expenses to increase for both the quarter and year to date periods (continued)? • For the year-to-date period, Corporate selling, general and administrative expenses increased $5.7 million to $32.0 million for the nine months ended April 30, 2016 compared to $26.3 million for the nine months ended April 30, 2015. The increase is primarily due to an increase in legal and professional service fees of $2.2 million, largely attributable to professional fees incurred related to the development of long-term strategic growth initiatives and increased sales and marketing initiatives. In addition, compensation costs also increased, as bonuses increased $1.5 million in correlation with the increase in income from continuing operations before income taxes compared to the prior year, and stock-based compensation increased $1.9 million. The stock-based compensation increase is due to increasing income from continuing operations before income taxes over the past three years, as most stock awards vest ratably over a three-year period. Costs related to the actuarially determined workers’ compensation and product liability reserves recorded at Corporate also increased by a total of $1.0 million. These increases were partially offset by a decrease in deferred compensation expense of $0.8 million, which relates to the equal and offsetting increase in net other Corporate income due to the market value change in the deferred compensation plan assets.
  • 24. 24 INVESTOR Q&A: THIRD QUARTER AND YEAR- TO-DATE OPERATING RESULTS (CONTINUED) What has been the impact of the Restricted Stock Unit (RSU) program on SG&A expenses? • As more fully explained in Note 14 of our quarterly report filed on Form 10-Q with the SEC, total expense recognized in the three-month periods ended April 30, 2016 and April 30, 2015 for these restricted stock unit awards and other stock-based compensation was $2.3 million and $1.7 million, respectively. Total expense recognized in the nine-month periods ended April 30, 2016 and April 30, 2015 for these restricted stock unit awards and other stock-based compensation was $7.0 million and $5.0 million, respectively. The increase in expense for both periods is due to increasing income from continuing operations before income taxes over the past three years. The RSUs vest ratably over a three-year period.
  • 25. 25 INVESTOR Q&A: THIRD QUARTER AND YEAR- TO-DATE OPERATING RESULTS (CONTINUED) What was the impact of new acquisitions on third-quarter and year-to-date sales and pre-tax income? • Cruiser RV, LLC and DRV, LLC (CRV/DRV) were acquired effective January 1, 2015, therefore the third quarter of 2015 and the third quarter of 2016 both reflected a full quarter of sales and pre-tax income related to this acquisition. On a year-to-date basis, the increase in the total Towable net sales for the nine month period ended April 30, 2016 over the corresponding period in 2015 was impacted by the inclusion of the five months of incremental activity of CRV/DRV. When we initially purchased CRV/DRV, we indicated their annual revenues were approximately $135 million, or approximately $11 million per month, with margin comparable to our existing margin. • In addition to CRV/DRV, the Company acquired Postle Aluminum Company, LLC in the fourth quarter of fiscal 2015, effective May 1, 2015, therefore the third quarter of 2016 includes three months of activity from Postle with no corresponding activity in the third quarter of 2015. The operating results of Postle for the three and nine month periods ended April 30, 2016 are included in the “Other” segment information of Footnote 4, “Business Segments,” of the Notes to the Condensed Consolidated Financial Statements (unaudited). Q What was the impact of new RV acquisitions to April 30, 2016 backlogs and dealer inventory? • The reported backlogs and dealer inventory at April 30, 2015 and 2016 both include information related to the CRV/DRV acquisition and therefore are comparable statistics.
  • 26. 26 INVESTOR Q&A: THIRD QUARTER AND YEAR- TO-DATE OPERATING RESULTS (CONTINUED) Has the Postle acquisition met expectations? • Yes, Postle has met our expectations and is providing incremental net income before tax to Thor. What caused the discontinued operations impact this quarter? • The operating loss of discontinued operations before income taxes reflects expenses incurred directly related to the former bus segment, including ongoing costs related to liabilities retained by the Company under the Stock Purchase Agreement (SPA) with Allied Specialty Vehicles, Inc. (ASV) for bus product liability and worker’s compensation claims occurring prior to the closing date of the sale. What was the year-to-date tax rate? Also, in the earnings press release, you mention that you expect the fourth-quarter tax rate to be higher than the prior year rate, why is that? • The overall effective income tax rate for the nine months ended April 30, 2016 was 32.6% compared with 31.9% for the nine months ended April 30, 2015. The primary reason for the increase in the effective income tax rate is due to the larger amount of uncertain tax benefits that settled favorably in the nine months ended April 30, 2015 when compared to the nine months ended April 30, 2016. We expect similar conditions to prevail in the fourth quarter resulting in a higher effective tax rate for the full year of fiscal 2016 compared to the prior year. This will have a more significant impact on year- over-year comparisons in the fourth quarter, as the effective tax rate in the fourth quarter of 2015 was approximately 29.2%, driven by the favorable settlement of various uncertain state tax positions that are not expected to repeat in the fourth quarter of fiscal 2016.
  • 27. 27 INVESTOR Q&A: THIRD QUARTER AND YEAR- TO-DATE OPERATING RESULTS (CONTINUED) You’ve been making some changes to reporting structure among your subsidiaries lately, has that helped to drive gross margin growth? Are you finding that centralization is actually working better than you thought and proving more efficient than the running of each operating entity independently? • Since our founding, our decentralized structure is one of the long-term keys to our success as a Company. By vesting responsibility and ownership of our operations with those individuals closest to the customer, we are able to respond quickly to the needs and demands of the market which in turn drives the success of our operations. We also recognize that as our business changes and market conditions change, we need to make appropriate changes to optimize our reporting structure. This has helped in improving our financial results indirectly, as we improved our overall operations to the benefit of our dealers, consumers and the broader RV market.
  • 28. 28 INVESTOR Q&A: BALANCE SHEET AND CASH FLOW What drove the sizable increase in accounts receivable? • Although accounts receivable has increased by $112.5 million from July 31, 2015, on a year-over-year basis, the increase was $16.6 million. The increase in accounts receivable at April 30, 2016 was due primarily to the increase in sales as well as the timing of sales associated with those receivables near the end of the quarter. What are your priorities for cash utilization? • We strive to maintain a healthy cash balance to ensure we have adequate resources to respond to opportunities and changing market conditions within the RV industry. Our priorities for cash utilization remain consistent – our first priority is to support and grow our core RV business, both organically and through acquisitions. Our second priority is maintaining and growing our regular dividend rate over time. Our third priority is for strategic share repurchases or special dividends, as determined by the Company’s Board.
  • 29. 29 INVESTOR Q&A: MARKET CONDITIONS AND OUTLOOK What is your longer-term outlook for the overall RV market? • At this point, we see many reasons for optimism regarding the future growth of the RV industry. Our dealers remain optimistic about the long-term growth of the RV industry. Consumers remain positive, as the impact of lower fuel prices, increasing job creation, historically low interest rates and lower inflation expectations have helped consumer confidence to remain strong. This positive consumer confidence combined with innovative product offerings, including a broader array of lower priced units in each category of products, have driven the industry growth in excess of the growth rate of the broader economy. In addition, a positive future outlook for the RV segment is supported by favorable demographics – both as more people reach the age brackets that historically have accounted for the bulk of the retail RV sales as well as an influx of younger and ethnically diverse consumers that are attracted to the RV lifestyle. These younger consumers in particular are generally attracted to lower and moderately priced products and are, in part, fueling additional growth in the industry beyond historical levels. The Recreation Vehicle Industry Association (RVIA) also recently updated their forecast for calendar 2016 and are now projecting 5.9% growth, to 396,400 units. While forecasts of future industry growth are always difficult, subject to a number of risks and can change rapidly, based on current indicators from the industry, dealers and consumers, we remain optimistic that the RV industry and Thor have several more years of solid growth ahead.
  • 30. 30 INVESTOR Q&A: MARKET CONDITIONS AND OUTLOOK (CONTINUED) What is your outlook for the rest of the year? • Current capacity limitations, combined with the strength of the prior year fourth quarter and continued strength in the RV market, along with a continued shift toward more moderately priced towable products, should result in high-single-digit revenue growth in the fourth quarter, as compared with the prior year. The impact of the retroactive reinstatement of tariff rebates on certain imported raw material, which had a $10 million, or 95 basis point, positive impact on gross margin in the fourth quarter of fiscal 2015, will not repeat in the fourth quarter of fiscal 2016. The estimated effective income tax rate is anticipated to remain comparable to the effective rate incurred in the first nine months of fiscal 2016, versus the unusually low rate of the fourth quarter of 2015. Have you seen any softness in markets that have been heavily impacted by the oil industry? • The largest state with exposure to the oil industry is Texas, which, based on retail registration data from Statistical Surveys, accounted for 31,911 units in 2015, which was up 7.9% for the year. For the first three months of 2016, total retail registrations in Texas increased by 6.9%. At this point, we have not seen signs of reduced demand in the large metro regions of Texas. What is the current state of Dealer inventory levels? • Dealers in general remain optimistic regarding calendar 2016. Dealer orders are generally expected to reflect a 1-for-1 replacement as units are sold at retail. Dealer inventory remains appropriate for current conditions in both towables and motorized.
  • 31. 31 INVESTOR Q&A: MARKET CONDITIONS AND OUTLOOK (CONTINUED) Can you comment on your rental business? • Thor Motor Coach (TMC) has been a leader in the rental business, particularly Class C motorhomes. TMC is the exclusive provider of rental units for a number of leading national RV rental companies and is continuing to focus on growing this business with other rental companies. Typically, rental units are standardized with more limited options than typical retail units. Rental orders tend to be produced in larger runs that can result in improved productivity that may offset lower-margin content within these units. What is the current state of the Canadian RV market? • The Canadian market is still challenging as we see continued volatility in the value of the Canadian dollar relative to the U.S. dollar. Since we sell our products to Canadian dealers priced in U.S. dollars, this creates an upward pressure on prices in local currency which has an adverse impact on demand. For calendar year 2015, total Canadian retail registrations as reported by Statistical Surveys, Inc. fell 12.9% from calendar 2014. For 2016, total Canadian retail registrations as reported by Statistical Surveys, Inc., fell 17.9% for the first three months of 2016, with towables decreasing 17.5% and motorized decreasing 23.7%, though it’s important to note that the Canadian market typically has limited activity in the early months of the calendar year. What is the status of the new Heartland plant in Idaho? • The Heartland facility in Idaho is progressing according to our original timeline. We are ramping up production at the new western facility that began producing and shipping units in the fiscal third quarter. The Nampa facility will produce travel trailers to meet the strong demands of the West Coast dealers of our Heartland subsidiary.
  • 32. 32 INVESTOR Q&A: MARKET CONDITIONS AND COMPETITION (CONTINUED) What is the status of the new Thor Motor Coach plant in Bristol, Indiana? • The team at Thor Motor Coach has worked to quickly begin production at this plant given the strong reception to the new Class C products we introduced last year at Open House. That plant began production in May and the team plans to ramp up production over the fourth quarter. Do you have plans for additional geographic expansion esp. considering your comments on capacity constraints? • We are continually evaluating a variety of options for additional capacity, including potential acquisitions of existing and newly-constructed facilities in northern Indiana and in the western U.S, as well as potential construction of new facilities. Each potential location is evaluated on a number of factors including market demand, proximity to suppliers and dealers, infrastructure and access to an adequate labor force, as well as cost. As we evaluate these options, we remain mindful that our industry is defined by its seasonality and cyclicality, and we make decisions on expansion with a long-term view and are conscious of the threats of over-expansion or under-expansion to meet a shorter-term market condition. Management’s decision-making seeks to find the optimal positioning to drive both short-term and long-term performance for our shareholders. What else are you doing to address the capacity constraints? • Each of our subsidiary management teams evaluates current orders, backlog and expected future demand in light of current production capacity for their products. In some cases we choose to expand capacity, such as the recent expansion of Class C production at Thor Motor Coach. In other cases, the subsidiaries may shift production between plants based on seasonal demand or shift production flow to increase effective capacity at existing facilities.
  • 33. 33 INVESTOR Q&A: MARKET CONDITIONS AND OUTLOOK (CONTINUED) Thor has lost market share in calendar 2015. Why have you lost market share and what does the Company plan on doing to address or reverse the losses? • From a share perspective, we have gained significant market share in motorized, which has been partially offset by some decreases in towable share, most notably in high-end fifth wheels and some travel trailers. Market share is certainly a key metric that we monitor for all our product categories – however, it is not the only metric. Overall, we generally try to take a balanced approach to growing or maintaining market share across our portfolio of products and growing or maintaining gross margin. In addition, we have made some critical moves in the past, such as the consolidation of the two smaller Dutchmen facilities in Idaho and Oregon into the existing Keystone facility in Pendleton, Oregon. We understood when we closed those plants that it would likely adversely affect our market share, but that the long-term benefit of improved operating efficiency at the Pendleton plant would more than offset the cost. In addition, the RV industry is extremely competitive. We have developed a variety of new products that we believe address the largest and fastest growing segments of the market, which should help to improve share as they penetrate the broader market. Describe the current competitive environment, is there much discounting going on? • The RV industry is always competitive, as our subsidiaries and our outside competitors continue to drive the industry forward with new and better products for dealers and consumers. However, given the capacity constraints on certain products, most notably towable RVs, we have seen less traditional discounting pressure overall in the market than we did several years ago.
  • 34. 34 INVESTOR Q&A: MARKET CONDITIONS AND OUTLOOK (CONTINUED) Do we anticipate further RV industry consolidation? • Although a significant amount of consolidation has already happened within the industry since the last recession, we do believe that opportunities remain for additional consolidation within the industry. Consolidation in our industry does not threaten the competitive environment as years of consolidation have evidenced. In fact, it tends to benefit the industry and broadens the customer base by driving innovation and attracting more individuals to the RV lifestyle. So, even with more consolidation, we are confident that the competitive environment that drives innovation and improved product offerings throughout our industry will continue. In addition, we have seen a number of new or returning entrants to the RV manufacturer base since the recession as well. What is your strategic plan for future acquisitions? • We have established a very disciplined approach to acquisitions to ensure we remain focused on the factors that provide the greatest likelihood to a successful acquisition and that will provide long-term value to our shareholders. We are opportunistic in our approach and seek willing sellers at a reasonable sales price. We also seek companies with strong management teams. We remain focused on acquisition opportunities within or adjacent to the RV industry.
  • 35. 35 RV WHOLESALE MARKET TRENDS (UNITS 000s) 295.8 339.6 441.1 413.9 389.9 199.2 106.9 133.6 140.6 196.6 215.7 186.9 189.9 211.7 215.8 187.9 173.1 163.1 203.4 227.8 259.5 247.2 247.5 254.5 292.7 321.2 300.1 256.8 311.0 320.8 370.1 384.4 390.5 353.5 237.0 165.6 242.3 252.3 285.8 321.2 356.8 374.2 396.4 1974 1975 1976 1977 1978 1979 1980 1981 1982 1983 1984 1985 1986 1987 1988 1989 1990 1991 1992 1993 1994 1995 1996 1997 1998 1999 2000 2001 2002 2003 2004 2005 2006 2007 2008 2009 2010 2011 2012 2013 2014 2015 2016(e) Historical Data: Recreation Vehicle Industry Association, Calendar year 2016: RVIA estimate as of Summer RV Roadsigns, published in May 2016
  • 36. 36 RV MARKET MOTORIZED WHOLESALE TRENDS (UNITS 000s) 68.9 96.6 156.1 160.2 157.2 64.1 28.5 35.4 41.2 69.5 82.0 68.7 67.7 73.7 72.8 61.1 52.3 41.9 46.9 51.3 58.2 52.8 55.3 55.1 63.5 71.5 61.0 49.2 60.4 62.0 71.7 61.4 55.8 55.4 28.4 13.2 25.2 24.8 28.2 38.4 44.0 47.3 50.9 1974 1975 1976 1977 1978 1979 1980 1981 1982 1983 1984 1985 1986 1987 1988 1989 1990 1991 1992 1993 1994 1995 1996 1997 1998 1999 2000 2001 2002 2003 2004 2005 2006 2007 2008 2009 2010 2011 2012 2013 2014 2015 2016(e) Historical Data: Recreation Vehicle Industry Association, Calendar year 2016: RVIA estimate as of Summer RV Roadsigns, published in May 2016
  • 37. 37 RV MARKET TOWABLE WHOLESALE TRENDS (UNITS 000s) 226.9 243.0 285.0 253.7 232.7 135.1 78.4 98.1 99.4 127.1 133.7 118.1 122.1 137.9 142.9 126.7 120.8 121.1 156.5 176.5 201.3 194.3 192.2 199.5 229.1 249.6 239.1 207.6 250.6 258.9 298.3 323.0 334.5 298.1 208.6 152.4 217.1 227.5 257.6 282.8 312.8 326.9 345.5 1974 1975 1976 1977 1978 1979 1980 1981 1982 1983 1984 1985 1986 1987 1988 1989 1990 1991 1992 1993 1994 1995 1996 1997 1998 1999 2000 2001 2002 2003 2004 2005 2006 2007 2008 2009 2010 2011 2012 2013 2014 2015 2016(e) Historical Data: Recreation Vehicle Industry Association, Calendar year 2016: RVIA estimate as of Summer RV Roadsigns, published in May 2016
  • 38. 38 RV INDUSTRY DEMAND Industry retail demand has shifted toward more light-weight towables and gas Class A and Class C motorhomes as consumers seek value Wholesale units typically outpace retail in the early part of the calendar year; historically sales become more balanced as we reach the peak retail selling season Calendar Year 2013 2014 2015 YTD 2015 YTD 2016 Industry Retail Registrations* 301,481 units (+14.7%) 328,866 units (+9.1%) 369,883 units (+12.5%) 66,295 units (+18.5%) 73,145 units (+10.3%) Industry Wholesale Shipments** 321,127 units (+12.4%) 356,735 units (+11.1%) 374,246 units (+4.9%) 97,074 units (+7.9%) 108,015 units (+11.3%) * Statistical Surveys, Inc., includes US and Canada. 2013, 2014 & 2015 Full Year Actual, YTD 2015 and 2016 through March ** RVIA wholesale shipments for full years 2013, 2014 & 2015, YTD 2015 and 2016 through March
  • 39. 39 THOR BACKLOG AND DEALER INVENTORY Dealers remain confident with orders reflecting a shift toward more normal ordering patterns Orders generally expected to reflect 1-for-1 replacement as units are sold at retail Backlog: April 30 ($000s), 2016 2015 % Change Towables $727,539 $484,228 50.2% Motorized $329,272 $242,560 35.7% Total RV $1,056,811 $726,788 45.4% Dealers inventory remains appropriate for current conditions in both towable and motorized Lenders still comfortable with current dealer inventory turns and current credit line utilization; year- over-year turns have increased modestly, resulting in a slight reduction in average age of Thor units on dealers’ lots Dealer Inventory: April 30, (units) 2016 2015 % Change RV 82,100 81,300 1.0%
  • 40. 40 RV INDUSTRY RETAIL MARKET SHARE Total Share % Total Share % Total Share % Total Share % THOR* 24,341 33.3% 127,528 34.5% 119,089 36.2% 115,572 38.3% Forest River** 25,693 35.1% 131,198 35.5% 112,979 34.4% 99,822 33.1% Jayco*** 9,818 13.4% 49,650 13.4% 41,574 12.6% 37,942 12.6% Winnebago 2,175 3.0% 11,857 3.2% 10,395 3.2% 8,661 2.9% Grand Design 1,994 2.7% 6,967 1.9% 4,174 1.3% 813 0.3% REV Group 773 1.1% 3,380 0.9% 4,888 1.5% 6,034 2.0% Gulfstream 731 1.0% 4,743 1.3% 4,562 1.4% 4,882 1.6% Subtotal 65,525 89.6% 335,323 90.7% 297,661 90.5% 273,726 90.8% All Others 7,620 10.4% 34,560 9.3% 31,205 9.5% 27,755 9.2% Grand Total 73,145 100.0% 369,883 100.0% 328,866 100.0% 301,481 100.0% Y/E 12/31/15 Y/E 12/31/14 Y/E 12/31/13YTD 3/31/16 Source: Statistical Surveys, Inc., U.S. and Canada * Thor adjusted to include historical results of Livin’ Lite, Bison Coach, K-Z, Inc., Cruiser RV and DRV Luxury Suites for all periods presented ** Forest River includes Palomino, Coachmen, Prime Time, Shasta and Dynamax *** Jayco adjusted to include historical results of Open Range
  • 41. 41 THOR RV RETAIL MARKET SHARE TREND (UNITS) 40.9% 41.2% 40.2% 37.9% 35.8% 34.2% 19.5% 20.0% 23.3% 23.9% 25.1% 28.0% 14.4% 16.7% 22.1% 21.9% 22.5% 19.0% 2011 2012 2013 2014 2015 2016 YTD** Towable Retail Share* Class A/C Retail Share* Class B Retail Share* *Source: Statistical Surveys Inc., U.S. and Canada, calendar year 2010-15. Historical results adjusted to include results of Heartland, Livin’ Lite, Bison Coach, K-Z, Inc., Cruiser RV and DRV Luxury Suites for all periods presented. **2016 YTD through March.
  • 42. 42 QUARTERLY THOR RV UNIT SHIPMENTS 0 5,000 10,000 15,000 20,000 25,000 30,000 35,000 40,000 45,000 1Q2006 1Q2007 1Q2008 1Q2009 1Q2010 1Q2011 1Q2012 1Q2013 1Q2014 1Q2015 1Q2016