Large drawings in the desert in South America. Who drew them? Why? How? What do they represent? Are some ancient landing strips? An ancient mystery explored. Lots of possibilities.
Large drawings in the desert in South America. Who drew them? Why? How? What do they represent? Are some ancient landing strips? An ancient mystery explored.
The Nazca Lines are a group of very large geoglyphs formed by depressions or shallow incisions made in the soil of the Nazca Desert in southern Peru. Some scholars believe the Nazca Lines were created by the Nazca culture.
In the year 3000, engineers at MIT finally created the technology ne.pdfsanjeevbansal1970
In the year 3000, engineers at MIT finally created the technology necessary for time travel. You,
who somehow are still alive (Time Lord perhaps?), decide that you want to make your AP
biology teacher proud and use this wonderful new time travel technology to do some statistical
analysis. Thinking about where to go, you remember once reading an article that said the
Tyrannosaurus Rex likely had feathers! Since you have a taste for danger, you become
determined to conduct field work on the genetics of this now extinct animal-and of course you
also want to see their short little arms and possibly feather covered bodies! You jump on a plane
and head to South Dakota, where the remains of one of the largest flesh-eaters to have ever
inhabited Earth, named Sue, were found (named after Sue Hendrickson who discovered the
fossils). Once you reach South Dakota, you use your time travel technology to turn back
time...67 million years! Once you turn back time, you begin your studies. To your surprise, not
all Tyrannosaurus Rex have feathers! It seems like having feathers is a dominant trait. You
realize this discovery could change our understanding of evolution*gasp*. You begin gathering
DNA samples from a population of T-Rex. You determine that having feathers (F) is dominant to
not having feathers (f). You obtain the data in the chart below: Time (days)=1 Feathered
(FF)=210 Feathered (Ff)=230 Non-Feathered (ff)=600 total=500 To be confident in your
conclusions about the T-Rex population at day 365, you conduct a Chi Square analysis. Create a
chi square data table.
The Great Sphinx: What is it? Why was it built?Bob Mayer
Is it weathered by rain? Why was it build? What was on the stella between its paws? Does it hold an entrance to a series of tunnels under the Giza Plateau? What is in those tunnels? From the bestselling series that has sold over 3 million copies.
An explosion in a remote area of Siberia in 1908 remains a mystery. No evidence of a meteor has been found. What caused this massive explosion? Is there a connection to Nikola Tesla's lab at Wardenclyffe? What exploded? How?
Did Nikola Tesla have something to do with it?
The Great Sphinx: What is it? Why was it built?Bob Mayer
Is it weather by rain? Why was it build? What was on the stella between its paws? Does it hold an entrance to a series of tunnels under the Giza Plateau?
NATIONAL CENTER FOR CASE STUDY TEACHING IN SCIENCEPage 3C.docxvannagoforth
NATIONAL CENTER FOR CASE STUDY TEACHING IN SCIENCE
Page 3“Crazy About Cryptids!” by Matthew P. Rowe
Part II – Hunting for Nessie
Victoria was a bit of a cyptozoologist herself, and she knew there was more evidence for the Loch Ness monster than
for all the other legendary creatures combined. By one estimate, there have been more than 4,000 sightings of Nessie
over the last 80 years, along with sonar tracings, video records, and some incredible photographs. But her Philosophy
of Science professor had the class read Carl Sagan’s book Th e Demon Haunted World, so she was familiar with Sagan’s
“Baloney Detection Kit.” One of the tools Sagan recommended was to “spin more than one hypothesis”; that is,
consider all reasonable explanations of a phenomenon, weigh the evidence for and against each, then let the evidence
tell you which explanation is most likely correct. While her brother was stuck on a single idea—namely that monsters
were living in a lake in northern Scotland—Victoria understood the limitations of eyewitness accounts, sonar tracings,
and fuzzy photographs. She would introduce her alternative hypotheses to Travis later. Now she was going to take him
on a mental quest using what she had learned in her ecology course.
“Th at was a great game sis, too bad your team lost to the Irish, and on homecoming weekend to boot.”
“No worries,” she responded. “I’ve just poured each of us a big glass of fresh lemonade; want to go on that hunt for
Nessie?”
“Sure. Where, or should I ask ‘how,’ do we start?”
“Well, to begin with, tell me what you know about the monster,” Victoria prodded, “but keep it brief.”
Travis had read every positive report about Nessie, but Victoria requested the “elevator-pitch version,” so he strained to
keep his account short and sweet. “Well, some saint back in the 6th century was the fi rst to encounter it, but it wasn’t
seen again until an elderly couple reported it crossing the road, heading towards the lake, with a lamb in its mouth, in
1933. Th e next year, a fantastic photo was taken of the beast. Called “Th e Surgeon’s Photo,” it is probably the most
widely recognized photograph of any cryptid anywhere.”
“I know the one you’re talking about, this big animal in the middle of a lake, with its head raised out of the water,
looking around, the one that resembles a plesiosaur,” Victoria added.
“Th at’s the one,” Travis continued. “And it spawned a huge public interest. People fl ocked to the loch, and many saw
the monster. Numerous scientifi c expeditions followed, generating some interesting sonar tracings. Th en, in 1975, a
paper was published in the journal Nature that not only assigned a scientifi c name to the beast, but also printed several
underwater pictures of Nessie; two of the
photos clearly revealed her plesiosaur-like
fi ns, while two others, with less resolution,
showed her body, long neck, and head. More
expeditions followed, and a set of vertebrae
were found, but there hasn’t ...
BREEDING METHODS FOR DISEASE RESISTANCE.pptxRASHMI M G
Plant breeding for disease resistance is a strategy to reduce crop losses caused by disease. Plants have an innate immune system that allows them to recognize pathogens and provide resistance. However, breeding for long-lasting resistance often involves combining multiple resistance genes
hematic appreciation test is a psychological assessment tool used to measure an individual's appreciation and understanding of specific themes or topics. This test helps to evaluate an individual's ability to connect different ideas and concepts within a given theme, as well as their overall comprehension and interpretation skills. The results of the test can provide valuable insights into an individual's cognitive abilities, creativity, and critical thinking skills
DERIVATION OF MODIFIED BERNOULLI EQUATION WITH VISCOUS EFFECTS AND TERMINAL V...Wasswaderrick3
In this book, we use conservation of energy techniques on a fluid element to derive the Modified Bernoulli equation of flow with viscous or friction effects. We derive the general equation of flow/ velocity and then from this we derive the Pouiselle flow equation, the transition flow equation and the turbulent flow equation. In the situations where there are no viscous effects , the equation reduces to the Bernoulli equation. From experimental results, we are able to include other terms in the Bernoulli equation. We also look at cases where pressure gradients exist. We use the Modified Bernoulli equation to derive equations of flow rate for pipes of different cross sectional areas connected together. We also extend our techniques of energy conservation to a sphere falling in a viscous medium under the effect of gravity. We demonstrate Stokes equation of terminal velocity and turbulent flow equation. We look at a way of calculating the time taken for a body to fall in a viscous medium. We also look at the general equation of terminal velocity.
This presentation explores a brief idea about the structural and functional attributes of nucleotides, the structure and function of genetic materials along with the impact of UV rays and pH upon them.
Seminar of U.V. Spectroscopy by SAMIR PANDASAMIR PANDA
Spectroscopy is a branch of science dealing the study of interaction of electromagnetic radiation with matter.
Ultraviolet-visible spectroscopy refers to absorption spectroscopy or reflect spectroscopy in the UV-VIS spectral region.
Ultraviolet-visible spectroscopy is an analytical method that can measure the amount of light received by the analyte.
Deep Behavioral Phenotyping in Systems Neuroscience for Functional Atlasing a...Ana Luísa Pinho
Functional Magnetic Resonance Imaging (fMRI) provides means to characterize brain activations in response to behavior. However, cognitive neuroscience has been limited to group-level effects referring to the performance of specific tasks. To obtain the functional profile of elementary cognitive mechanisms, the combination of brain responses to many tasks is required. Yet, to date, both structural atlases and parcellation-based activations do not fully account for cognitive function and still present several limitations. Further, they do not adapt overall to individual characteristics. In this talk, I will give an account of deep-behavioral phenotyping strategies, namely data-driven methods in large task-fMRI datasets, to optimize functional brain-data collection and improve inference of effects-of-interest related to mental processes. Key to this approach is the employment of fast multi-functional paradigms rich on features that can be well parametrized and, consequently, facilitate the creation of psycho-physiological constructs to be modelled with imaging data. Particular emphasis will be given to music stimuli when studying high-order cognitive mechanisms, due to their ecological nature and quality to enable complex behavior compounded by discrete entities. I will also discuss how deep-behavioral phenotyping and individualized models applied to neuroimaging data can better account for the subject-specific organization of domain-general cognitive systems in the human brain. Finally, the accumulation of functional brain signatures brings the possibility to clarify relationships among tasks and create a univocal link between brain systems and mental functions through: (1) the development of ontologies proposing an organization of cognitive processes; and (2) brain-network taxonomies describing functional specialization. To this end, tools to improve commensurability in cognitive science are necessary, such as public repositories, ontology-based platforms and automated meta-analysis tools. I will thus discuss some brain-atlasing resources currently under development, and their applicability in cognitive as well as clinical neuroscience.
More Related Content
Similar to What are the Nazca Lines? What do they mean?
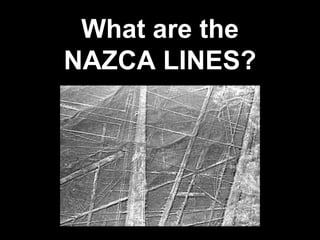
The Great Sphinx: What is it? Why was it built?Bob Mayer
Is it weathered by rain? Why was it build? What was on the stella between its paws? Does it hold an entrance to a series of tunnels under the Giza Plateau? What is in those tunnels? From the bestselling series that has sold over 3 million copies.
An explosion in a remote area of Siberia in 1908 remains a mystery. No evidence of a meteor has been found. What caused this massive explosion? Is there a connection to Nikola Tesla's lab at Wardenclyffe? What exploded? How?
Did Nikola Tesla have something to do with it?
The Great Sphinx: What is it? Why was it built?Bob Mayer
Is it weather by rain? Why was it build? What was on the stella between its paws? Does it hold an entrance to a series of tunnels under the Giza Plateau?
NATIONAL CENTER FOR CASE STUDY TEACHING IN SCIENCEPage 3C.docxvannagoforth
NATIONAL CENTER FOR CASE STUDY TEACHING IN SCIENCE
Page 3“Crazy About Cryptids!” by Matthew P. Rowe
Part II – Hunting for Nessie
Victoria was a bit of a cyptozoologist herself, and she knew there was more evidence for the Loch Ness monster than
for all the other legendary creatures combined. By one estimate, there have been more than 4,000 sightings of Nessie
over the last 80 years, along with sonar tracings, video records, and some incredible photographs. But her Philosophy
of Science professor had the class read Carl Sagan’s book Th e Demon Haunted World, so she was familiar with Sagan’s
“Baloney Detection Kit.” One of the tools Sagan recommended was to “spin more than one hypothesis”; that is,
consider all reasonable explanations of a phenomenon, weigh the evidence for and against each, then let the evidence
tell you which explanation is most likely correct. While her brother was stuck on a single idea—namely that monsters
were living in a lake in northern Scotland—Victoria understood the limitations of eyewitness accounts, sonar tracings,
and fuzzy photographs. She would introduce her alternative hypotheses to Travis later. Now she was going to take him
on a mental quest using what she had learned in her ecology course.
“Th at was a great game sis, too bad your team lost to the Irish, and on homecoming weekend to boot.”
“No worries,” she responded. “I’ve just poured each of us a big glass of fresh lemonade; want to go on that hunt for
Nessie?”
“Sure. Where, or should I ask ‘how,’ do we start?”
“Well, to begin with, tell me what you know about the monster,” Victoria prodded, “but keep it brief.”
Travis had read every positive report about Nessie, but Victoria requested the “elevator-pitch version,” so he strained to
keep his account short and sweet. “Well, some saint back in the 6th century was the fi rst to encounter it, but it wasn’t
seen again until an elderly couple reported it crossing the road, heading towards the lake, with a lamb in its mouth, in
1933. Th e next year, a fantastic photo was taken of the beast. Called “Th e Surgeon’s Photo,” it is probably the most
widely recognized photograph of any cryptid anywhere.”
“I know the one you’re talking about, this big animal in the middle of a lake, with its head raised out of the water,
looking around, the one that resembles a plesiosaur,” Victoria added.
“Th at’s the one,” Travis continued. “And it spawned a huge public interest. People fl ocked to the loch, and many saw
the monster. Numerous scientifi c expeditions followed, generating some interesting sonar tracings. Th en, in 1975, a
paper was published in the journal Nature that not only assigned a scientifi c name to the beast, but also printed several
underwater pictures of Nessie; two of the
photos clearly revealed her plesiosaur-like
fi ns, while two others, with less resolution,
showed her body, long neck, and head. More
expeditions followed, and a set of vertebrae
were found, but there hasn’t ...
BREEDING METHODS FOR DISEASE RESISTANCE.pptxRASHMI M G
Plant breeding for disease resistance is a strategy to reduce crop losses caused by disease. Plants have an innate immune system that allows them to recognize pathogens and provide resistance. However, breeding for long-lasting resistance often involves combining multiple resistance genes
hematic appreciation test is a psychological assessment tool used to measure an individual's appreciation and understanding of specific themes or topics. This test helps to evaluate an individual's ability to connect different ideas and concepts within a given theme, as well as their overall comprehension and interpretation skills. The results of the test can provide valuable insights into an individual's cognitive abilities, creativity, and critical thinking skills
DERIVATION OF MODIFIED BERNOULLI EQUATION WITH VISCOUS EFFECTS AND TERMINAL V...Wasswaderrick3
In this book, we use conservation of energy techniques on a fluid element to derive the Modified Bernoulli equation of flow with viscous or friction effects. We derive the general equation of flow/ velocity and then from this we derive the Pouiselle flow equation, the transition flow equation and the turbulent flow equation. In the situations where there are no viscous effects , the equation reduces to the Bernoulli equation. From experimental results, we are able to include other terms in the Bernoulli equation. We also look at cases where pressure gradients exist. We use the Modified Bernoulli equation to derive equations of flow rate for pipes of different cross sectional areas connected together. We also extend our techniques of energy conservation to a sphere falling in a viscous medium under the effect of gravity. We demonstrate Stokes equation of terminal velocity and turbulent flow equation. We look at a way of calculating the time taken for a body to fall in a viscous medium. We also look at the general equation of terminal velocity.
This presentation explores a brief idea about the structural and functional attributes of nucleotides, the structure and function of genetic materials along with the impact of UV rays and pH upon them.
Seminar of U.V. Spectroscopy by SAMIR PANDASAMIR PANDA
Spectroscopy is a branch of science dealing the study of interaction of electromagnetic radiation with matter.
Ultraviolet-visible spectroscopy refers to absorption spectroscopy or reflect spectroscopy in the UV-VIS spectral region.
Ultraviolet-visible spectroscopy is an analytical method that can measure the amount of light received by the analyte.
Deep Behavioral Phenotyping in Systems Neuroscience for Functional Atlasing a...Ana Luísa Pinho
Functional Magnetic Resonance Imaging (fMRI) provides means to characterize brain activations in response to behavior. However, cognitive neuroscience has been limited to group-level effects referring to the performance of specific tasks. To obtain the functional profile of elementary cognitive mechanisms, the combination of brain responses to many tasks is required. Yet, to date, both structural atlases and parcellation-based activations do not fully account for cognitive function and still present several limitations. Further, they do not adapt overall to individual characteristics. In this talk, I will give an account of deep-behavioral phenotyping strategies, namely data-driven methods in large task-fMRI datasets, to optimize functional brain-data collection and improve inference of effects-of-interest related to mental processes. Key to this approach is the employment of fast multi-functional paradigms rich on features that can be well parametrized and, consequently, facilitate the creation of psycho-physiological constructs to be modelled with imaging data. Particular emphasis will be given to music stimuli when studying high-order cognitive mechanisms, due to their ecological nature and quality to enable complex behavior compounded by discrete entities. I will also discuss how deep-behavioral phenotyping and individualized models applied to neuroimaging data can better account for the subject-specific organization of domain-general cognitive systems in the human brain. Finally, the accumulation of functional brain signatures brings the possibility to clarify relationships among tasks and create a univocal link between brain systems and mental functions through: (1) the development of ontologies proposing an organization of cognitive processes; and (2) brain-network taxonomies describing functional specialization. To this end, tools to improve commensurability in cognitive science are necessary, such as public repositories, ontology-based platforms and automated meta-analysis tools. I will thus discuss some brain-atlasing resources currently under development, and their applicability in cognitive as well as clinical neuroscience.
The use of Nauplii and metanauplii artemia in aquaculture (brine shrimp).pptxMAGOTI ERNEST
Although Artemia has been known to man for centuries, its use as a food for the culture of larval organisms apparently began only in the 1930s, when several investigators found that it made an excellent food for newly hatched fish larvae (Litvinenko et al., 2023). As aquaculture developed in the 1960s and ‘70s, the use of Artemia also became more widespread, due both to its convenience and to its nutritional value for larval organisms (Arenas-Pardo et al., 2024). The fact that Artemia dormant cysts can be stored for long periods in cans, and then used as an off-the-shelf food requiring only 24 h of incubation makes them the most convenient, least labor-intensive, live food available for aquaculture (Sorgeloos & Roubach, 2021). The nutritional value of Artemia, especially for marine organisms, is not constant, but varies both geographically and temporally. During the last decade, however, both the causes of Artemia nutritional variability and methods to improve poorquality Artemia have been identified (Loufi et al., 2024).
Brine shrimp (Artemia spp.) are used in marine aquaculture worldwide. Annually, more than 2,000 metric tons of dry cysts are used for cultivation of fish, crustacean, and shellfish larva. Brine shrimp are important to aquaculture because newly hatched brine shrimp nauplii (larvae) provide a food source for many fish fry (Mozanzadeh et al., 2021). Culture and harvesting of brine shrimp eggs represents another aspect of the aquaculture industry. Nauplii and metanauplii of Artemia, commonly known as brine shrimp, play a crucial role in aquaculture due to their nutritional value and suitability as live feed for many aquatic species, particularly in larval stages (Sorgeloos & Roubach, 2021).
Travis Hills' Endeavors in Minnesota: Fostering Environmental and Economic Pr...Travis Hills MN
Travis Hills of Minnesota developed a method to convert waste into high-value dry fertilizer, significantly enriching soil quality. By providing farmers with a valuable resource derived from waste, Travis Hills helps enhance farm profitability while promoting environmental stewardship. Travis Hills' sustainable practices lead to cost savings and increased revenue for farmers by improving resource efficiency and reducing waste.
Richard's aventures in two entangled wonderlandsRichard Gill
Since the loophole-free Bell experiments of 2020 and the Nobel prizes in physics of 2022, critics of Bell's work have retreated to the fortress of super-determinism. Now, super-determinism is a derogatory word - it just means "determinism". Palmer, Hance and Hossenfelder argue that quantum mechanics and determinism are not incompatible, using a sophisticated mathematical construction based on a subtle thinning of allowed states and measurements in quantum mechanics, such that what is left appears to make Bell's argument fail, without altering the empirical predictions of quantum mechanics. I think however that it is a smoke screen, and the slogan "lost in math" comes to my mind. I will discuss some other recent disproofs of Bell's theorem using the language of causality based on causal graphs. Causal thinking is also central to law and justice. I will mention surprising connections to my work on serial killer nurse cases, in particular the Dutch case of Lucia de Berk and the current UK case of Lucy Letby.
Remote Sensing and Computational, Evolutionary, Supercomputing, and Intellige...University of Maribor
Slides from talk:
Aleš Zamuda: Remote Sensing and Computational, Evolutionary, Supercomputing, and Intelligent Systems.
11th International Conference on Electrical, Electronics and Computer Engineering (IcETRAN), Niš, 3-6 June 2024
Inter-Society Networking Panel GRSS/MTT-S/CIS Panel Session: Promoting Connection and Cooperation
https://www.etran.rs/2024/en/home-english/
2. Basic Facts:
They’re a group of geoglyphs (lines made in the
ground) in the Nazca Desert in Peru.
They were made some time between
500 BC and 500 AD.
They were made by removing the red pebbles on
the surface of the Nazca Plain to a depth of 4 to 6
inches, revealing the white ground underneath.
NAZCA LINES
3. Basic Facts:
They cover a large area, roughly 170 square miles
(450 square kilometers).
Because the weather is so dry there, they’ve been
well-preserved.
Some represent over 70 creatures such as birds,
fish, monkeys, jaguars, etc.
Other are of plants and trees.
Other shapes are geometric, including straight
lines.
NAZCA LINES
4. Basic Facts:
Contrary to popular
belief, they can be
seen from the ground
on the surrounding
hills. But they can also
be seen in satellite
images.
NAZCA LINES
5. Why were they built?
There are numerous theories.
One is that they were drawn to be seen by the
Gods of the Nazca people.
Another is that they are part of a kind of
observatory, pointing at places on the horizon to be
watched, although there is insufficient evidence to
support this.
Perhaps they were drawn as a plea to the Gods to
bring water to this arid place?
NAZCA LINES
12. There are also grids and lines, which some call ley
lines.
NAZCA LINES
13. Then there are lines that inspire the imagination.
A landing strip?
NAZCA LINES
14. Of course, there are those who postulate other
theories about the purpose of the lines and who
made them.
Some say they were made by ancient aliens.
Or perhaps they are ley lines and control some sort
of power from inside the Earth itself?
NAZCA LINES
15. I’ve used the Nazca lines in some of my books,
particularly in Atlantis Gate.
16. The Atlantis Series
“Spell-binding! Will keep you on the edge of your
seat. Call it techno-thriller, call it science fiction, call
it just terrific story-telling.” Terry Brooks, #1 NY
Times Bestselling author of the Shannara series and
Star Wars Phantom Menace
17. More Free Information
If you want to go directly to a document with live
links to all free apps, gear, library, and Jeep stuff,
use your camera on this QR Code. Or copy and
paste:
https://www.dropbox.com/scl/fi/vwgilkne2vsq4jrhkp
gic/GEAR-
LINKS.docx?dl=0&rlkey=i858w1e2zd3irup2lcvhvlb
ma
18. New York Times bestselling author, is a graduate of West Point and
former Green Beret. He’s had over 80 books published, including the
#1 bestselling series Green Berets, Time Patrol, Area 51, and Atlantis.
He’s sold over 5 million books. He was born in the Bronx and has
traveled the world. He’s lived on an island off the east coast, an island
off the west coast, in the Rocky Mountains, the Smoky Mountains and
other places, including time in East Asia studying martial arts.
They haven’t caught him yet.
www.bobmayer.com
Editor's Notes
There’s a common image of a red and white sign for Area 51 you can find