A study on Nonlinear flow through an orifice meter
Weir Poster
1. POSTER TEMPLATE BY:
www.PosterPresentations.com
Effect of Submergence on Flow Measurement in a 90o Weir
Sophia Zumot, Carolina Sanchez, Dr. Jose Saez (Faculty Advisor)
Department of Civil Engineering and Environmental Science
Loyola Marymount University, 1 LMU Dr., Los Angeles, CA 90045
Introduction Laboratory Setup and Methods Laboratory Setup and Methods
Results
Results
Results Conclusions and Future Work
Q (gpm) k n S at 5% Error
18.4 1.4X10⁻³ 7.26 49.3%
53.9 2.5X10⁻³ 6.72 44.6%
79.8 2.1X10⁻³ 6.88 46.1%
112 2.4X10⁻³ 6.66 45.6%
144 3.9X10⁻³ 6.06 42.1%
Submergence Point
References and Acknowledgments
Submergence in open channel flow meters is a major
concern in flow measurement, and has been the focus of
numerous research investigations (e.g., Villemonte, 1947,
Tullis et al., 2007, Tullis, 2009). This study involved
laboratory tests performed in a 90o triangular weir to
determine errors in measured flow rates using standard weir
equations at various levels of submergence. Submergence
was measured by determining the ratio of head levels, with
respect to the weir’s notch, in the weir afterbay (H2) to the
head level in the forebay (H1). Calculations helped determine
the level of submergence that began to cause excessive
(over 5%) error in measured flow rate due to the rise of the
water level in the afterbay. The 5% error is often used as a
maximum acceptable error by agencies that regulate
industrial waste flow meters (Los Angeles County Sanitations
Districts, 2011). Thus, the goal of this work is to determine
the maximum permissible submergence in the weir without
causing excessive errors in flow measurement.
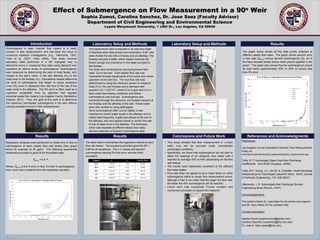
The graph below shows all the data points collected at
different steady flow rates. The graph shows percent error
in flow rate (Qerror) versus percent submergence (S). All of
the flows showed similar trends when placed together in the
graph. The graph also shows that the submergence should
be kept below approximately 40% or 50% to ensure less
than 5% error.
• This study showed that flow measurement in v-notch
weirs may still be accurate under considerable
submerged conditions.
• Specifically, we found that submergence did not start to
affect the readings of an ultrasonic flow meter until it
reached an average 42% to 49% (depending on the flow
rate tested).
• The results were reasonably consistent at the different
flow rates tested.
• Flow rate does not appear to be a major factor on when
submergence starts to cause flow measurement errors,
although it has to be noted that the larger the flow rate,
the faster the 45% submergence will be reached.
• Future work may incorporate Froude numbers and
momentum principles to expand this research.
References:
Los Angeles County Sanitations Districts’ Flow Measurement
Policy at:
www.lacsd.org/info/industrial_waste/policies/flow_measurement.asp
Tullis, B. P. Submerged Ogee Crest Weir Discharge
Coefficients. 33rd IAHR Congress, (2009)
Tullis, B.P., Young, J.C., and M. A. Chandler. Head-Discharge
Relationships for Submerged Labyrinth Weirs. ASCE Journal
of Hydraulic Engineering, 133, 248 (2007).
Villemonte, J. R. Submerged-Weir Discharge Studies.
Engineering News Record, (1947).
Acknowledgements:
The authors thank Dr. Jose Saez for his advice and support,
and Mr. Gary Hikiss for his constant help.
Contact Information:
Sophia Zumot (sophia.zumot@gmail.com)
Carolina Sanchez (csanch33@lion.lmu.edu)
Dr. Jose A. Saez (jsaez@lmu.edu)
The experiments were conducted in an weir box made
of stainless steel (See photos and schematic). A 90o weir
plate divided the box into a forebay and an afterbay. The
forebay included a baffle, which helped minimize the
kinetic energy and turbulence in the water pumped to
the forebay.
The tests were conducted by conveying known flow
rates (Q) to the weir. Each steady flow rate was
maintained through adjustments of the pump and valves
upstream of the weir box. The true flow rate was
determined by using the ultrasonic sensor to measure
head (H) in the weir forebay and a standard weir
equation (Q = 1122 H2.5, where Q is in gpm and H is in
feet) under free-flowing conditions and before
submergence was induced. Submergence was
monitored through the ultrasonic and bubbler sensors at
the forebay and the afterbay of the weir. These levels
were also verified by using staff gages.
Since submergence often occurs rapidly, it was
important to control water levels in the afterbay and to
collect data frequently. A gate was placed at the end of
the afterbay, and was opened slowly to control the rate
of rise of water level in the afterbay. This technique,
which was repeated at different steady flow rates,
allowed collection of frequent submergence data.
Regression analyses were performed to relate error in flow to
submergence at each steady flow rate tested (See graph
below for example at 53 gpm). The following exponential
relationship provided a good fit for the plotted data:
Qerror = k e nS ,
Where: Qerror is the % error in flow, S is the % submergence,
and n and k are constants from the regression equation.
The table below summarizes the regression results at each
flow rate tested. The equations provided good fits (R2 >
0.96 for all equations). The k, n values and percent
submergence causing 5% flow error are also fairly
consistent.