Course Name: SoftwareProject Management
Faculty Name: Dr. Durga Prasad Mohapatra
Department : Computer Sc. & Engg. NIT Rourkela
TOPIC: Project Monitoring and Control
2.
Code Review
Code Walk Through
Code Inspection
Cleanroom Technique
3.
Candidate work productsfor review
• All interim and final work products are usually candidates for review.
• Usually, the work products considered to be suitable candidates for
review are as follows.
– Requirements specification documents
– User interface specification and design documents
– Architectural, high-level, and detailed design documents
– Source code
– Test plan and the designed test cases
– Project management plan and configuration management plan
4.
Code Review
• Reviewis a very effective technique to remove defects from
source code.
• In fact, review has been acknowledged to be more cost-effective
in removing defects as compared to testing.
• Over the years, review techniques have become extremely
popular and have been generalised for use with other work
products.
5.
Code Review cont...
•Code review for a module is undertaken after the module
successfully compiles, i.e. all the syntax errors have been
eliminated from the module.
• Obviously, code review does not target to design syntax errors in
a program, but is designed to detect logical, algorithmic, and
programming errors.
• Code review has been recognised as an extremely cost-effective
strategy for eliminating coding errors and for producing high
quality code.
6.
Code Review cont...
•The reason behind why code review is a much more cost-effective
strategy to eliminate errors from code compared to testing is that
reviews directly detect errors.
• On the other hand, testing only helps detect failures and
significant effort is needed to locate the error during debugging.
7.
Code Review cont...
•The rationale behind the above statement is explained as follows.
Eliminating an error from code involves three main activities—
testing, debugging, and then correcting the errors.
• Testing is carried out to detect if the system fails to work
satisfactorily for certain types of inputs and under certain
circumstances. Once a failure is detected, debugging is carried out
to locate the error that is causing the failure and to remove it.
8.
Code Review cont...
•Of the three testing activities, debugging is possibly the most
laborious and time consuming activity.
• In code inspection (which is a type of review), errors are directly
detected, thereby saving the significant effort that would have
been required to locate the error.
9.
Code Review cont...
Normally,the following two types of reviews are carried out on
the code of a module:
• Code walkthrough.
• Code inspection.
10.
Code inspection andcode walk through
• After a module has been coded,
– code inspection and code walk through are carried out
– ensures that coding standards are followed
– help detect as many errors as possible before testing.
10
11.
Code inspection andcode walk through cont...
• Detect as many errors as possible during inspection and
walkthrough:
– detected errors require less effort for correction
• much higher effort needed if errors were to be
detected during integration or system testing.
11
12.
Code Walk Through
•An informal code analysis technique.
– undertaken after the coding of a module is complete.
• A few members of the development team select some test
cases:
– simulate execution of the code by hand using these test
cases, i.e. the members mentally trace the execution
through different statements and functions of the code.
12
13.
Code Walk Throughcont...
• The members note down their findings of their code walk through
and discuss those in a walkthrough meeting.
• Even though it is an informal technique:
– several guidelines have evolved over the years
– making this naive but useful analysis technique more effective.
– These guidelines are based on
• personal experience, common sense, and several subjective
factors.
13
14.
Code Walk Throughcont...
• The guidelines should be considered as examples:
– rather than accepted as rules to be applied dogmatically.
• The team performing code walk through should not be either too
big or too small.
– Ideally, it should consist of between three to seven members.
14
15.
Code Walk Throughcont...
• Discussion should focus on discovery of errors:
– and not on how to fix the discovered errors.
• To foster cooperation:
– avoid the feeling among engineers that they are being
evaluated in the code walk through meeting,
– managers should not attend the walk through meetings.
15
16.
Code Inspection
• Incontrast to code walk through,
– code inspection aims mainly at discovery of the commonly made
errors that usually creep into code due to programmer mistakes
and oversights .
– also aims at checking adherence to coding standards.
• During code inspection:
– the code is examined for the presence of certain kinds of errors,
– in contrast to the hand simulation of code execution done in code
walk through.
16
17.
Benefits of codeinspection
• Finds the commonly made errors
• Programmer receives feedback on
– programming style,
– choice of algorithm, and
– programming techniques
17
18.
Code Inspection cont...
•For instance, consider:
– classical error of writing a procedure that modifies a formal
parameter
– while the calling routine calls the procedure with a constant
actual parameter.
• It is more likely that such an error will be discovered:
– by looking for this kind of mistakes in the code,
– rather than by simply hand simulating execution of the
procedure.
18
19.
Code Inspection cont...
•Good software development companies:
– collect statistics of errors committed by their engineers
– identify the types of errors most frequently committed.
• A list of common errors:
– can be used during code inspection to look out for possible
errors.
19
20.
Examples of somecommonly made errors
• Use of uninitialized variables.
• Use of incorrect logical operators or incorrect precedence among operators.
• Non-terminating loops.
• Array indices out of bounds.
• Incompatible assignments.
• Improper storage allocation and deallocation.
• Actual and formal parameter mismatch in procedure calls.
• Jumps into loops
• Improper modification of loop variables, etc.
20
21.
Cleanroom Technique
• Pioneeredat IBM
• The term cleanroom was first coined at IBM by drawing analogy
to the semi-conductor fabrication units where the defects are
avoided by manufacturing in an ultra-clean atmosphere.
• Relies heavily on walkthroughs, inspection and formal verification
for bug removal
• Programmers are not allowed to test any of their code by
executing the code other than doing some syntax testing
using a compiler
•
21
22.
Cleanroom Technique cont...
Pros:
• This technique reportedly produces documentation & code that
are more reliable and maintainable than other development
methods relying heavily on code execution based testing.
Cons:
• The testing effort is increased as walkthroughs, inspection and
verification are time consuming for detecting simple errors.
• Some errors might escape during manual inspection. Testing-
based error detection techniques may detect these errors.
22
23.
Summary
• Discussed twoimportant code review techniques such as code
walk through and code inspection.
• Presented a list of some commonly made errors which can be
detected by code review.
• Discussed briefly Cleanroom Technique .
24.
References :
1. B.Hughes, M. Cotterell, R. Mall, Software Project Management,
Sixth Edition, McGraw Hill Education (India) Pvt. Ltd., 2018.
2. R. Mall, Fundamentals of Software Engineering, Fifth Edition,
PHI Learning Pvt. Ltd., 2018.
26.
Course Name: SoftwareProject Management
Faculty Name: Dr. Durga Prasad Mohapatra
Department : Computer Sc. & Engg. NIT Rourkela
TOPIC: Project Monitoring and control
Visualizing Progress
• Havingcollected data about project progress, a manager needs
some way of presenting that data to greatest effect.
• Some methods of presenting a picture of the project and its
future.
– Methods that provide a static picture, a single snapshot (such as
Gantt charts)
– Methods that try to show how the project has progressed and
changed through time (such as timeline charts)
29.
Gantt chart
• Ganttchart has been named after its developer Henry Gantt.
• A Gantt chart is a form of bar chart.
• The vertical axis lists all the tasks to be performed.
• The bars are drawn along the y-axis, one for each task.
• Gantt charts used in software project management are actually
an enhanced version of the standard Gantt charts. In the Gantt,
each bar consists of a unshaded part and a shaded part.
30.
Gantt chart
• Theshaded part of the bar shows the length of time each task is
estimated to take.
• The unshaded part shows the slack time or lax time.
• The lax time represents the leeway or flexibility available in
meeting the latest time by which a task must be finished.
31.
Gantt chart
• AGantt chart is a special type of bar chart where each bar represents
an activity. The bars are drawn along a time line. The length of each bar
is proportional to the duration of time planned for the corresponding
activity.
• Gantt chart representation of a project schedule is helpful in planning
the utilisation of resources, while PERT chart is useful for monitoring
the timely progress of activities.
32.
Gantt chart
• Ganttcharts are useful for resource planning (i.e. allocate
resources to activities). The different types of resources that
need to be allocated to activities include staff, hardware, and
software.
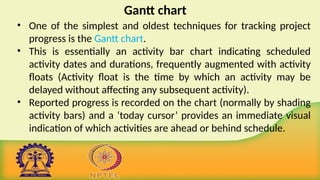
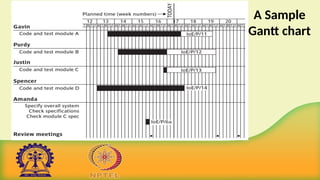
Gantt chart
• Oneof the simplest and oldest techniques for tracking project
progress is the Gantt chart.
• This is essentially an activity bar chart indicating scheduled
activity dates and durations, frequently augmented with activity
floats (Activity float is the time by which an activity may be
delayed without affecting any subsequent activity).
• Reported progress is recorded on the chart (normally by shading
activity bars) and a ‘today cursor’ provides an immediate visual
indication of which activities are ahead or behind schedule.
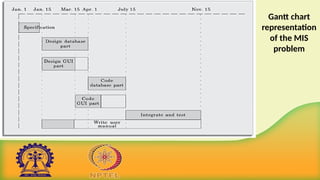
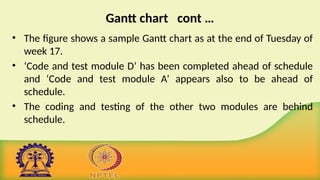
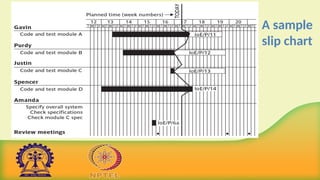
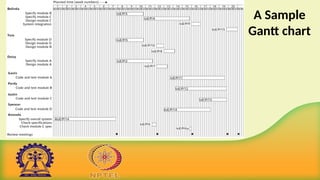
Gantt chart cont…
• The figure shows a sample Gantt chart as at the end of Tuesday of
week 17.
• ‘Code and test module D’ has been completed ahead of schedule
and ‘Code and test module A’ appears also to be ahead of
schedule.
• The coding and testing of the other two modules are behind
schedule.
38.
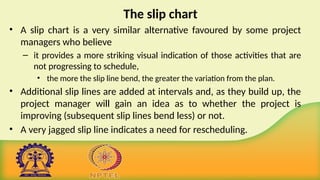
The slip chart
•A slip chart is a very similar alternative favoured by some project
managers who believe
– it provides a more striking visual indication of those activities that are
not progressing to schedule,
• the more the slip line bend, the greater the variation from the plan.
• Additional slip lines are added at intervals and, as they build up, the
project manager will gain an idea as to whether the project is
improving (subsequent slip lines bend less) or not.
• A very jagged slip line indicates a need for rescheduling.
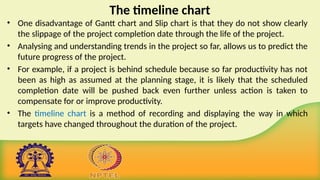
The timeline chart
•One disadvantage of Gantt chart and Slip chart is that they do not show clearly
the slippage of the project completion date through the life of the project.
• Analysing and understanding trends in the project so far, allows us to predict the
future progress of the project.
• For example, if a project is behind schedule because so far productivity has not
been as high as assumed at the planning stage, it is likely that the scheduled
completion date will be pushed back even further unless action is taken to
compensate for or improve productivity.
• The timeline chart is a method of recording and displaying the way in which
targets have changed throughout the duration of the project.
The timeline chartcont …
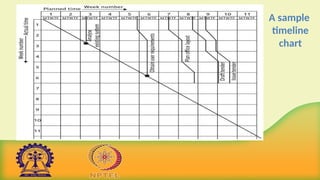
• The figure shows a sample time line chart at the end of the sixth week.
• Planned time is plotted along the horizontal axis and elapsed time
down the vertical axis.
• The lines meandering down the chart represent scheduled activity
completion dates
– At the start of the project ‘analyse existing system’ is scheduled to be
completed by the Tuesday of week 3,
– ‘obtain user requirements’ by Thursday of week 5
– ‘issue tender’, the final activity, by Tuesday of week 9, and so on.
43.
The timeline chartcont …
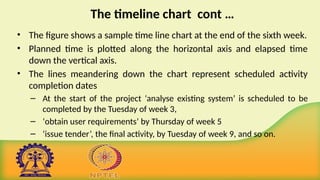
• At the end of the first week, the project manager reviews these
target dates and leaves them as they are
– lines are therefore drawn vertically downwards from the target
dates to the end of week 1 on the actual time axis.
• At the end of week 2, he decides that ‘obtain user requirements’
will not be completed until Tuesday of week 6
– he therefore extends that activity line diagonally to reflect this.
• The other activity completion targets are also delayed
correspondingly.
44.
The timeline chartcont …
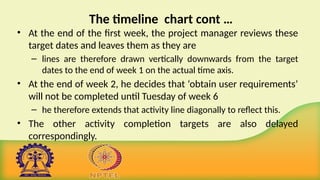
• By the Tuesday of week 3, ‘analyse existing system’ is completed and the project
manager puts a blob on the diagonal timeline to indicate that this has
happened.
• At the end of week 3 he decides to keep to the existing targets.
• At the end of week 4 he adds another three days to ‘draft tender’ and ‘issue
tender’.
• Note that by the end of week 6, two activities have been completed and three
are still unfinished.
• Up to this point she has revised target dates on three occasions and the project
as a whole is running seven days late.
45.
• The timelinechart is useful both during the execution of a
project and as part of the post-implementation review.
• Analysis of the timeline chart, and the reasons for the
changes, can indicate failures in the estimation process or
other errors that might, with that knowledge, be avoided in
future.
The timeline chart cont …
46.
Cost monitoring
• Aproject could be late because the staff originally committed
have not been deployed
• In this case the project will be behind time but under budget
• A project could be on time but only because additional
resources have been added and so be over budget
• Need to monitor both achievements and costs
47.
Cost monitoring cont...
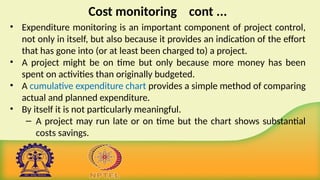
• Expenditure monitoring is an important component of project control,
not only in itself, but also because it provides an indication of the effort
that has gone into (or at least been charged to) a project.
• A project might be on time but only because more money has been
spent on activities than originally budgeted.
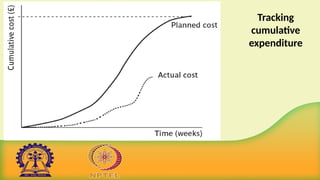
• A cumulative expenditure chart provides a simple method of comparing
actual and planned expenditure.
• By itself it is not particularly meaningful.
– A project may run late or on time but the chart shows substantial
costs savings.
Cost monitoring cont...
• We need to take account of the current status of the project
activities before attempting to interpret the meaning of recorded
expenditure.
• Cost charts become much more useful if we add projected future
costs calculated by adding the estimated costs of uncompleted
work to the costs already incurred.
• Where a computer-based planning tool is used, revision of cost
schedules is generally provided automatically, once actual
expenditure has been recorded.
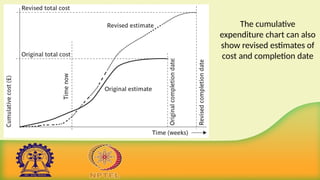
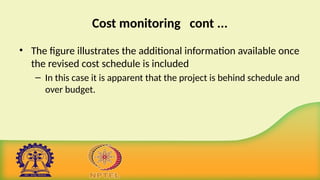
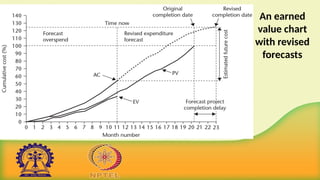
Cost monitoring cont...
• The figure illustrates the additional information available once
the revised cost schedule is included
– In this case it is apparent that the project is behind schedule and
over budget.
52.
Summary
• Discussed variousways to visualize the progress of a project
such as
Gantt chart,
Slip chart and
Time line chart.
• Presented basic concepts of cost monitoring
53.
References :
1. B.Hughes, M. Cotterell, R. Mall, Software Project Management,
Sixth Edition, McGraw Hill Education (India) Pvt. Ltd., 2018.
2. R. Mall, Fundamentals of Software Engineering, Fifth Edition,
PHI Learning Pvt. Ltd., 2018.
55.
Course Name: SoftwareProject Management
Faculty Name: Dr. Durga Prasad Mohapatra
Department : Computer Sc. & Engg. NIT Rourkela
TOPIC: Project Monitoring and control
Earned value analysis
•Earned value analysis has gained in popularity in recent years and
may be seen as a refinement of the cost monitoring.
• It originated in the USA’s Department of Defence (DOD) as a part of
a set of measures to control projects being carried out by
contractors for the DOD.
• It is based on assigning a ‘value’ to each task or work package
based on the original expenditure forecasts.
58.
Earned value analysiscont ...
• One way of looking at this is as the equivalent of the price that
might be agreed by a contractor to do some unit of work.
• The assigned value is the original budgeted cost for the item and
is known as the planned value (PV) or budgeted cost of work
scheduled (BCWS).
• A task that has not started is assigned an earned value of zero
and when it has been completed, it, and hence the project, is
credited with the original planned value of the task.
59.
Earned value analysiscont ...
• The total value credited to a project at any point is known as the
earned value(EV) or budgeted cost of work performed (BCWP)
and this can be represented as a money value, an amount of staff
time or as a percentage of the PV.
• EV is thus analogous to the agreed price to be paid to the
contractor once the work is completed.
60.
Earned value analysiscont ...
• Where tasks have been started but are not yet complete, some
consistent method of assigning an earned value must be applied.
• Common methods in software projects are
– The 0/100 technique
– The 50/50 technique
– The 75/25 technique
– The milestone technique
– The percentage complete technique
61.
Earned value analysiscont ...
• The 0/100 technique is preferred for software development.
• The 50/50 technique can give a false sense of security by over-
valuing the reporting of activity starts.
• The milestone technique might be appropriate for activities with a
long duration estimate but, in such cases, it is better to break that
activity into a number of smaller ones.
62.
The 0/100 technique
•A task is assigned a value of zero until such time that it is
completed, when it is given a value of 100% of the budgeted
value.
63.
The 50/50 technique
•A task is assigned a value of 50% of its value as soon as it is
started and then given a value of 100% once it is complete
– This matches some contractual arrangements where a
contractor is given half the agreed price when starting the work,
perhaps to help pay for raw materials, and the remainder on
successful completion.
64.
The 75/25 technique
•The task is assigned 75% on starting and 25% on completion
– This is often used when a large item of equipment is being
bought:
• 75% is paid when the equipment is actually delivered and the rest
when installation and testing have been satisfactorily completed.
65.
The milestone technique
•A task is given a value based on the achievement of
milestones that have been assigned values as part of the
original budget plan.
66.
The percentage complete
•In some cases there may be a way of objectively measuring
the amount of work completed
– For example, as part of the implementation of an information
system, a number of data records have to be manually typed
into a database.
– The actual number so far completed can be objectively counted
and the value can be assigned accordingly.
67.
Earned value analysis
•Planned value (PV) or Budgeted cost of work scheduled (BCWS) –
original estimate of the effort/cost to complete a task (compare
with idea of a ‘price’)
• Earned value (EV) or Budgeted cost of work performed (BCWP) –
total of PVs for the work completed at this time
68.
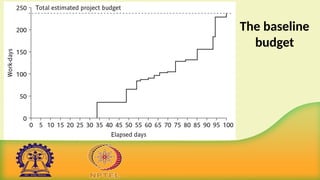
The baseline budget
•The first step in setting up an earned value analysis is to create
the baseline budget.
• The baseline budget is based on the project plan and shows the
forecast growth in earned value through time.
• Earned value may be measured in monetary values but, in the
case of staff-intensive projects such as software development, it
is common to measure earned value in person-hours and
workdays.
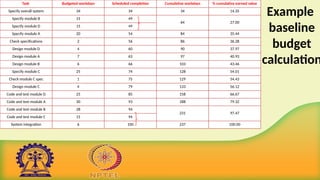
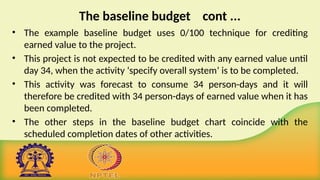
The baseline budgetcont ...
• The example baseline budget uses 0/100 technique for crediting
earned value to the project.
• This project is not expected to be credited with any earned value until
day 34, when the activity ‘specify overall system’ is to be completed.
• This activity was forecast to consume 34 person-days and it will
therefore be credited with 34 person-days of earned value when it has
been completed.
• The other steps in the baseline budget chart coincide with the
scheduled completion dates of other activities.
73.
Summary
• Discussed brieflyearned value analysis
– The 0/100 technique
– The 50/50 technique
– The 75/25 technique
– The milestone technique
– The percentage complete technique
• Presented the concept baseline budget
74.
References :
1. B.Hughes, M. Cotterell, R. Mall, Software Project Management,
Sixth Edition, McGraw Hill Education (India) Pvt. Ltd., 2018.
76.
Course Name: SoftwareProject Management
Faculty Name: Dr. Durga Prasad Mohapatra
Department : Computer Sc. & Engg. NIT Rourkela
TOPIC: Project Monitoring and control
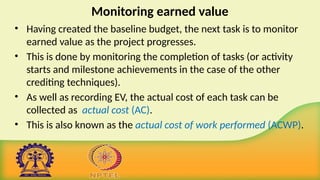
Monitoring earned value
•Having created the baseline budget, the next task is to monitor
earned value as the project progresses.
• This is done by monitoring the completion of tasks (or activity
starts and milestone achievements in the case of the other
crediting techniques).
• As well as recording EV, the actual cost of each task can be
collected as actual cost (AC).
• This is also known as the actual cost of work performed (ACWP).
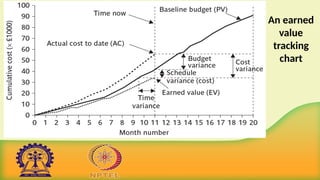
Monitoring earned value
•The figure illustrates the following performance statistics,
which can be shown directly or derived from the earned
value.
– Schedule variance (SV)
– Time variance (TV)
– Cost variance (CV)
– Performance ratios
81.
Schedule variance (SV)
•The schedule variance is measured in cost terms as SV = EV-PV
• It indicates the degree to which the value of completed work
differs from that planned.
• Say, for example, that work with a PV of ₤40,000 should have been
completed by now. In fact, some of that work has not been done,
so that the EV is only ₤35,000.
• So, SV = ₤35,000- ₤40,000 = - ₤5,000.
• A negative SV means the project is behind schedule.
82.
Time variance (TV)
•This is the difference between the time when the achievement of
the current earned value was planned to occur and the time now.
• In this case, the current EV should have been achieved in the
early part of month 9 and as the time now is the end of month
11,
– So, the TV is about -1.75 months.
– TV negative indicates project is running late.
83.
Cost variance (CV)
•This is calculated as CV = EV-AC
• It indicates the difference between the earned value or budgeted cost
and the actual cost of completed work.
• Say that when the SV above was calculated as -₤5,000, ₤55,000 had
actually been spent to get the EV.
• The CV in this case would have been ₤35,000- ₤55,000, i.e. - ₤20,000.
• It can also be an indicator of the accuracy of the original cost estimates.
• A negative CV means that the project is over cost.
84.
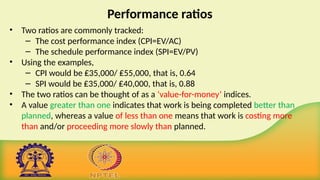
Performance ratios
• Tworatios are commonly tracked:
– The cost performance index (CPI=EV/AC)
– The schedule performance index (SPI=EV/PV)
• Using the examples,
– CPI would be ₤35,000/ ₤55,000, that is, 0.64
– SPI would be ₤35,000/ ₤40,000, that is, 0.88
• The two ratios can be thought of as a ‘value-for-money’ indices.
• A value greater than one indicates that work is being completed better than
planned, whereas a value of less than one means that work is costing more
than and/or proceeding more slowly than planned.
85.
Performance ratios cont...
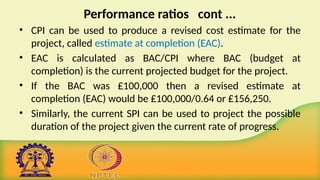
• CPI can be used to produce a revised cost estimate for the
project, called estimate at completion (EAC).
• EAC is calculated as BAC/CPI where BAC (budget at
completion) is the current projected budget for the project.
• If the BAC was ₤100,000 then a revised estimate at
completion (EAC) would be ₤100,000/0.64 or ₤156,250.
• Similarly, the current SPI can be used to project the possible
duration of the project given the current rate of progress.
86.
Performance ratios cont...
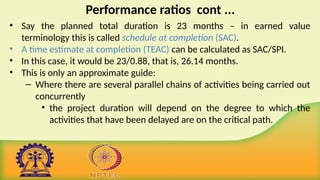
• Say the planned total duration is 23 months – in earned value
terminology this is called schedule at completion (SAC).
• A time estimate at completion (TEAC) can be calculated as SAC/SPI.
• In this case, it would be 23/0.88, that is, 26.14 months.
• This is only an approximate guide:
– Where there are several parallel chains of activities being carried out
concurrently
• the project duration will depend on the degree to which the
activities that have been delayed are on the critical path.
Performance ratios cont...
• Earned value analysis has not yet gained universal acceptance for use
with software development projects,
– perhaps largely because of the attitude that, whereas a half-built house
has value reflected by the labour and materials that have been used,
• a half-completed software project has virtually no value at all.
• This is to misunderstand the purpose of earned value analysis, which
is a method for tracking what has been achieved on a project
– Measured in terms of the budgeted costs of completed tasks or
products.
89.
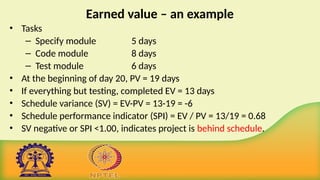
Earned value –an example
• Tasks
– Specify module 5 days
– Code module 8 days
– Test module 6 days
• At the beginning of day 20, PV = 19 days
• If everything but testing, completed EV = 13 days
• Schedule variance (SV) = EV-PV = 13-19 = -6
• Schedule performance indicator (SPI) = EV / PV = 13/19 = 0.68
• SV negative or SPI <1.00, indicates project is behind schedule.
90.
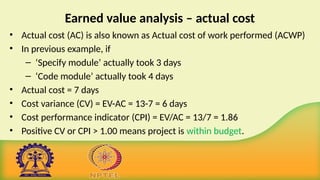
Earned value analysis– actual cost
• Actual cost (AC) is also known as Actual cost of work performed (ACWP)
• In previous example, if
– ‘Specify module’ actually took 3 days
– ‘Code module’ actually took 4 days
• Actual cost = 7 days
• Cost variance (CV) = EV-AC = 13-7 = 6 days
• Cost performance indicator (CPI) = EV/AC = 13/7 = 1.86
• Positive CV or CPI > 1.00 means project is within budget.
91.
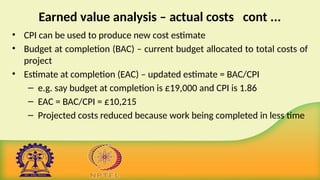
Earned value analysis– actual costs cont ...
• CPI can be used to produce new cost estimate
• Budget at completion (BAC) – current budget allocated to total costs of
project
• Estimate at completion (EAC) – updated estimate = BAC/CPI
– e.g. say budget at completion is £19,000 and CPI is 1.86
– EAC = BAC/CPI = £10,215
– Projected costs reduced because work being completed in less time
92.
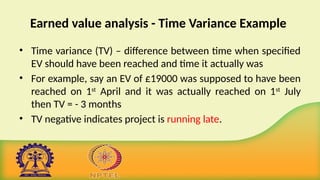
Earned value analysis- Time Variance Example
• Time variance (TV) – difference between time when specified
EV should have been reached and time it actually was
• For example, say an EV of £19000 was supposed to have been
reached on 1st
April and it was actually reached on 1st
July
then TV = - 3 months
• TV negative indicates project is running late.
93.
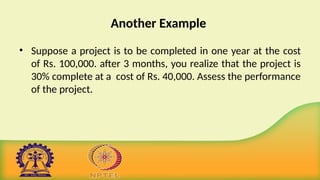
Another Example
• Supposea project is to be completed in one year at the cost
of Rs. 100,000. after 3 months, you realize that the project is
30% complete at a cost of Rs. 40,000. Assess the performance
of the project.
94.
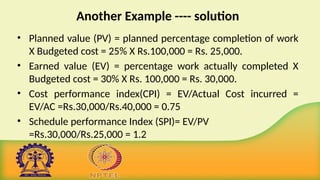
Another Example ----solution
• Planned value (PV) = planned percentage completion of work
X Budgeted cost = 25% X Rs.100,000 = Rs. 25,000.
• Earned value (EV) = percentage work actually completed X
Budgeted cost = 30% X Rs. 100,000 = Rs. 30,000.
• Cost performance index(CPI) = EV/Actual Cost incurred =
EV/AC =Rs.30,000/Rs.40,000 = 0.75
• Schedule performance Index (SPI)= EV/PV
=Rs.30,000/Rs.25,000 = 1.2
95.
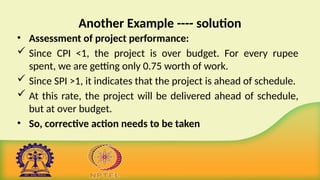
Another Example ----solution
• Assessment of project performance:
Since CPI <1, the project is over budget. For every rupee
spent, we are getting only 0.75 worth of work.
Since SPI >1, it indicates that the project is ahead of schedule.
At this rate, the project will be delivered ahead of schedule,
but at over budget.
• So, corrective action needs to be taken
96.
Summary
• Discussed monitoringof earned value through
– Schedule variance (SV)
– Time variance (TV)
– Cost variance (CV)
– Performance ratios
• Explained the above with suitable examples
97.
References :
1. B.Hughes, M. Cotterell, R. Mall, Software Project Management,
Sixth Edition, McGraw Hill Education (India) Pvt. Ltd., 2018.
99.
Course Name: SoftwareProject Management
Faculty Name: Dr. Durga Prasad Mohapatra
Department : Computer Sc. & Engg. NIT Rourkela
TOPIC: Project Monitoring and control
Prioritizing monitoring
So farwe have assumed that all aspects of a project will receive equal
treatment in terms of the degree of monitoring applied.
We might focus more on monitoring certain types of activity e.g.
• Critical path activities
• Activities with no free float – if delayed later dependent activities
are delayed
• Activities with less than a specified float
• High risk activities
• Activities using critical resources
102.
Critical path activities
•Any delay in an activity on the critical path will cause a delay
in the completion date for the project.
• Critical path activities are therefore likely to have a very high
priority for close monitoring.
103.
Activities with nofree float
• Free float – It is the amount of time that an activity may be
delayed without affecting any subsequent activity.
• A delay in any activity with no free float will delay at least some
subsequent activities even though, if the delay is less than the
total float, it might not delay the project completion date.
• These subsequent delays can have serious effects on the resource
schedule as a delay in a subsequent activity could mean that the
resources for that activity will become unavailable before that
activity is completed.
• So these activities should be given priority while monitoring.
104.
Activities with lessthan a specified float
• If any activity has very little float it might use up this float
before the regular activity monitoring brings the problem to
the project manager’s attention.
• It is a common practice to monitor closely those activities
with less than, say, one week free float.
105.
High risk activities
•A set of high-risk activities should have been identified as part
of the initial risk profiling exercise.
• If we are using the PERT, we should designate as high risk to
those activities that have a high estimated duration variance.
• These activities will be given close attention because they are
most likely to overrun or overspend.
106.
Activities using criticalresources
• Activities can be critical because they are very expensive (as in
the case of specialized contract programmers).
• Staff or other resources might be available only for a limited
period, especially if they are controlled outside the project
team.
• In any event, an activity that demands a critical resource
requires a high level of monitoring.
107.
Getting the projectback to target
• Almost any project will, at one time or another, be subject to delays and
unexpected events.
• One of the tasks of the project manager is to recognize when this is happening
(or, if possible, about to happen) and, with the minimum delay and disruption
to the project team, attempt to mitigate the effects of the problem.
• In most cases, the project manager, at least initially, tries to ensure that the
scheduled project end date remains unaffected.
• This can be done by shortening remaining activity durations or shortening the
overall duration of the remaining project.
108.
Getting the projectback to target cont ...
• This might not always be the most appropriate response to disruptions to a
plan.
• There is little point in spending considerable sums in overtime payments in
order to speed up a project if the customer is not overly concerned with the
delivery date and there is no other valuable work for the team members
once this project is completed.
• There are two main strategies to consider when drawing up plans to bring a
project back on target.
– Shortening the critical path
– Altering the activity precedence requirements
109.
Shorten the criticalpath
• The overall duration of a project is determined by the current
critical path, so speeding up non-critical path activities will not
bring forward a project completion date.
• There are several ways in which this might be done.
– Adding resources - especially staff
– Increase use of current resources
– Reallocate staff to critical activities
– Reduce scope
– Reduce quality
110.
Shorten the criticalpath
• By such means, we can attempt to shorten the timescale for
critical activities until such time as either we have brought the
project back to schedule or further efforts prove unproductive or
not cost-effective.
• Remember, however, that shortening a critical path often causes
some other path, or paths, to become critical.
111.
Adding resources- especiallystaff
• Exhorting staff to ‘work harder’ might have some effect, although
frequently a more positive form of action is required, such as increasing
the resources available for some critical activity.
• For example, fact-finding, might be speeded up by allocating an
additional analyst to interviewing users.
• It is unlikely, however, that the coding of a small module would be
shortened by allocating an additional programmer
– indeed, it might be counterproductive because of the additional time
needed for organizing and allocating tasks and communicating.
112.
Adding resources- especiallystaff
• While adding more staff may be able to speed up progress, this
would be at an additional cost.
• In EV terms, negative schedule variance (SV) may be reduced, but
at the price of increasing a negative cost variance (CV).
113.
Increase use ofcurrent resources
• Resource levels can be increased by making them available for
longer.
• Thus, staff might be asked to work overtime for the duration of
an activity and computing resources might be made available at
times (such as evenings and weekends) when they might
otherwise be inaccessible.
114.
Reallocate staff tocritical activities
• The project manager might consider allocating more efficient
staff to activities on the critical path or swapping resources
between critical and non-critical activities.
• When a project is actually executed, the critical path may change
as the actual durations of activities will vary from the original
estimates and staff allocations may be adjusted to reflect this.
115.
Reduce scope
• Theamount of work to be done could be reduced by reducing
the scope of the functionality to be delivered.
• The client may prefer to have a subset of the promised features
on time
– Especially if they are the most useful ones.
• Rather than have the delivery of the whole application delayed.
116.
Reduce quality
• Somequality-related activities such as system testing could be
curtailed.
• This would probably lead to more corrective work having to
be done to the ‘live’ system once it has been implemented.
117.
Reconsider the precedencerequirements
• If attempting to shorten critical activities proves insufficient, the
next step is to consider the constraints by which some activities
have to be deferred pending completion of others.
• The original project network would most probably have been
drawn up assuming ‘ideal’ conditions and ‘normal’ working
practices.
• It might be that, to avoid the project delivering late, it is now
worth questioning whether as yet unstarted activities really do
have to await the completion of others.
118.
Reconsider the precedencerequirements cont ...
• It might, in a particular organization, be ‘normal’ to complete
system testing before commencing user training.
• In order to avoid late completion of a project it might, however,
be considered acceptable to alter ‘normal’ practice and start
training earlier.
119.
Reconsider the precedencerequirements cont ...
• One way to overcome precedence constraints is to subdivide an
activity into a component that can start immediately and one that is
still constrained as before.
• For example, a user handbook can be drawn up in a draft form from
the system specification and then be revised later to take account of
subsequent changes.
• If we decide to alter the precedence requirements in such a way, it is
clearly important to be aware that quality might be compromised and
to make a considered decision to compromise quality where needed.
120.
Reconsider the precedencerequirements cont ...
• It is equally important to assess the degree to which changes in
work practices increase risk.
• It is possible, for example, to start coding a module before its design
has been completed.
• It would normally, however, be considered foolhardy to do so since,
as well as compromising quality, it would increase the risk of having
to redo some of the coding once the final design had been
completed and thus delay the project even further.
121.
Getting back ontrack: options in nut shell
• Renegotiate the deadline – if not possible then
• Try to shorten critical path e.g.
– Work overtime
– Re-allocate staff from less pressing work
– Buy in more staff
• Reduce scope of the work
• Reduce the quality
• Reconsider activity dependencies
– Over-lap the activities so that the start of one activity doesn’t have to wait
for completion of another
– Split activities
122.
Summary
• Discussed thepriorities that might be applied while
monitoring different activities.
• Also, discussed how to get the project back to target.
123.
References:
1. B. Hughes,M. Cotterell, R. Mall, Software Project Management,
Sixth Edition, McGraw Hill Education (India) Pvt. Ltd., 2018.
Editor's Notes
#36 Note that the Gantt chart is named after Henry Gantt (1861-1919) and so should not be written in capitals! You could ask students what they think GANTT stands for before you tell them this to impress this on them. I really find Gantt written as GANTT very, very annoying and threaten students with instant failure of the module if they do this!
The format of the Gantt chart here differs from the format used in Microsoft project as the activities for each team member are grouped together. You could input the details so that they came out in this format, but it would not occur automatically.
#39 A slip chart is a version of the Gantt chart where a line is drawn from top to bottom. To the left of the line are all the completed activities and to the right those activities ( or parts of activities) that have not been completed.
The more jagged the line, the more it means that that there are some activities that are lagging to various degrees and some that are ahead of themselves. A very jagged line means that there is scope for re-planning to move resources from those activities that are ahead to those that are behind.
#41 This records the way that targets have changed throughout the project.
Planned time is plotted on the horizontal axis, and actual time on the vertical axis. The bendy lines going from top to bottom represent the scheduled completion date for each activity e.g.
‘analyse existing system’ – at start this was due finish on the Monday of week 3 and it did finish then
‘obtain user requirements’ was originally planned to finish on the Thursday of week 5, but at the end of the first week it was rescheduled to finish on the Tuesday of week 6.
#69 Note that the Gantt chart is named after Henry Gantt (1861-1919) and so should not be written in capitals! You could ask students what they think GANTT stands for before you tell them this to impress this on them. I really find Gantt written as GANTT very, very annoying and threaten students with instant failure of the module if they do this!
The format of the Gantt chart here differs from the format used in Microsoft project as the activities for each team member are grouped together. You could input the details so that they came out in this format, but it would not occur automatically.
#89 A negative schedule variance (SV) means that the project is behind schedule as does a SPI that is less than 1.0.
#101 Critical path activities – by definition if these are late then the project as a whole will be delayed
Activities with no free float – free float was defined in Lecture/Chapter 6. A project with no free float will delay following dependent activities, although the project end date may not be directly threatened.
Activities with less than a specified float – projects when being executed can be very dynamic: some activities will take longer than estimated others less; this could lead to the critical shifting. Activities with small floats are the most likely to find themselves turned into activities on the critical path if their floats get eroded.
High risk activities – recall the calculation of activity standard deviations in Chapter 7. If the standard deviation for an activity is large, this indicates that there is a lot of uncertainty about how long it will actually take.
Activities using critical resources – some resources may only be available for a limited period and if the activities that need the resource are delayed the resource could become unavailable.
#121 Renegotiating the deadline – one way of doing this is to divide the deliverables into ‘tranches’ (see Lecture/Chapter 3), delivering the ones most valuable to the client on or before the deadline, but delaying less valuable ones.
Shortening the critical path – the idea is to try to get things done more quickly by adding more staff. Some activities lend themselves to this more readily than others – it is often quite difficult to do this with software development. It also increases costs
Reconsidering activity dependencies – allowing activities to overlap often increases the risk of quality shortfalls