Download as PDF, PPTX


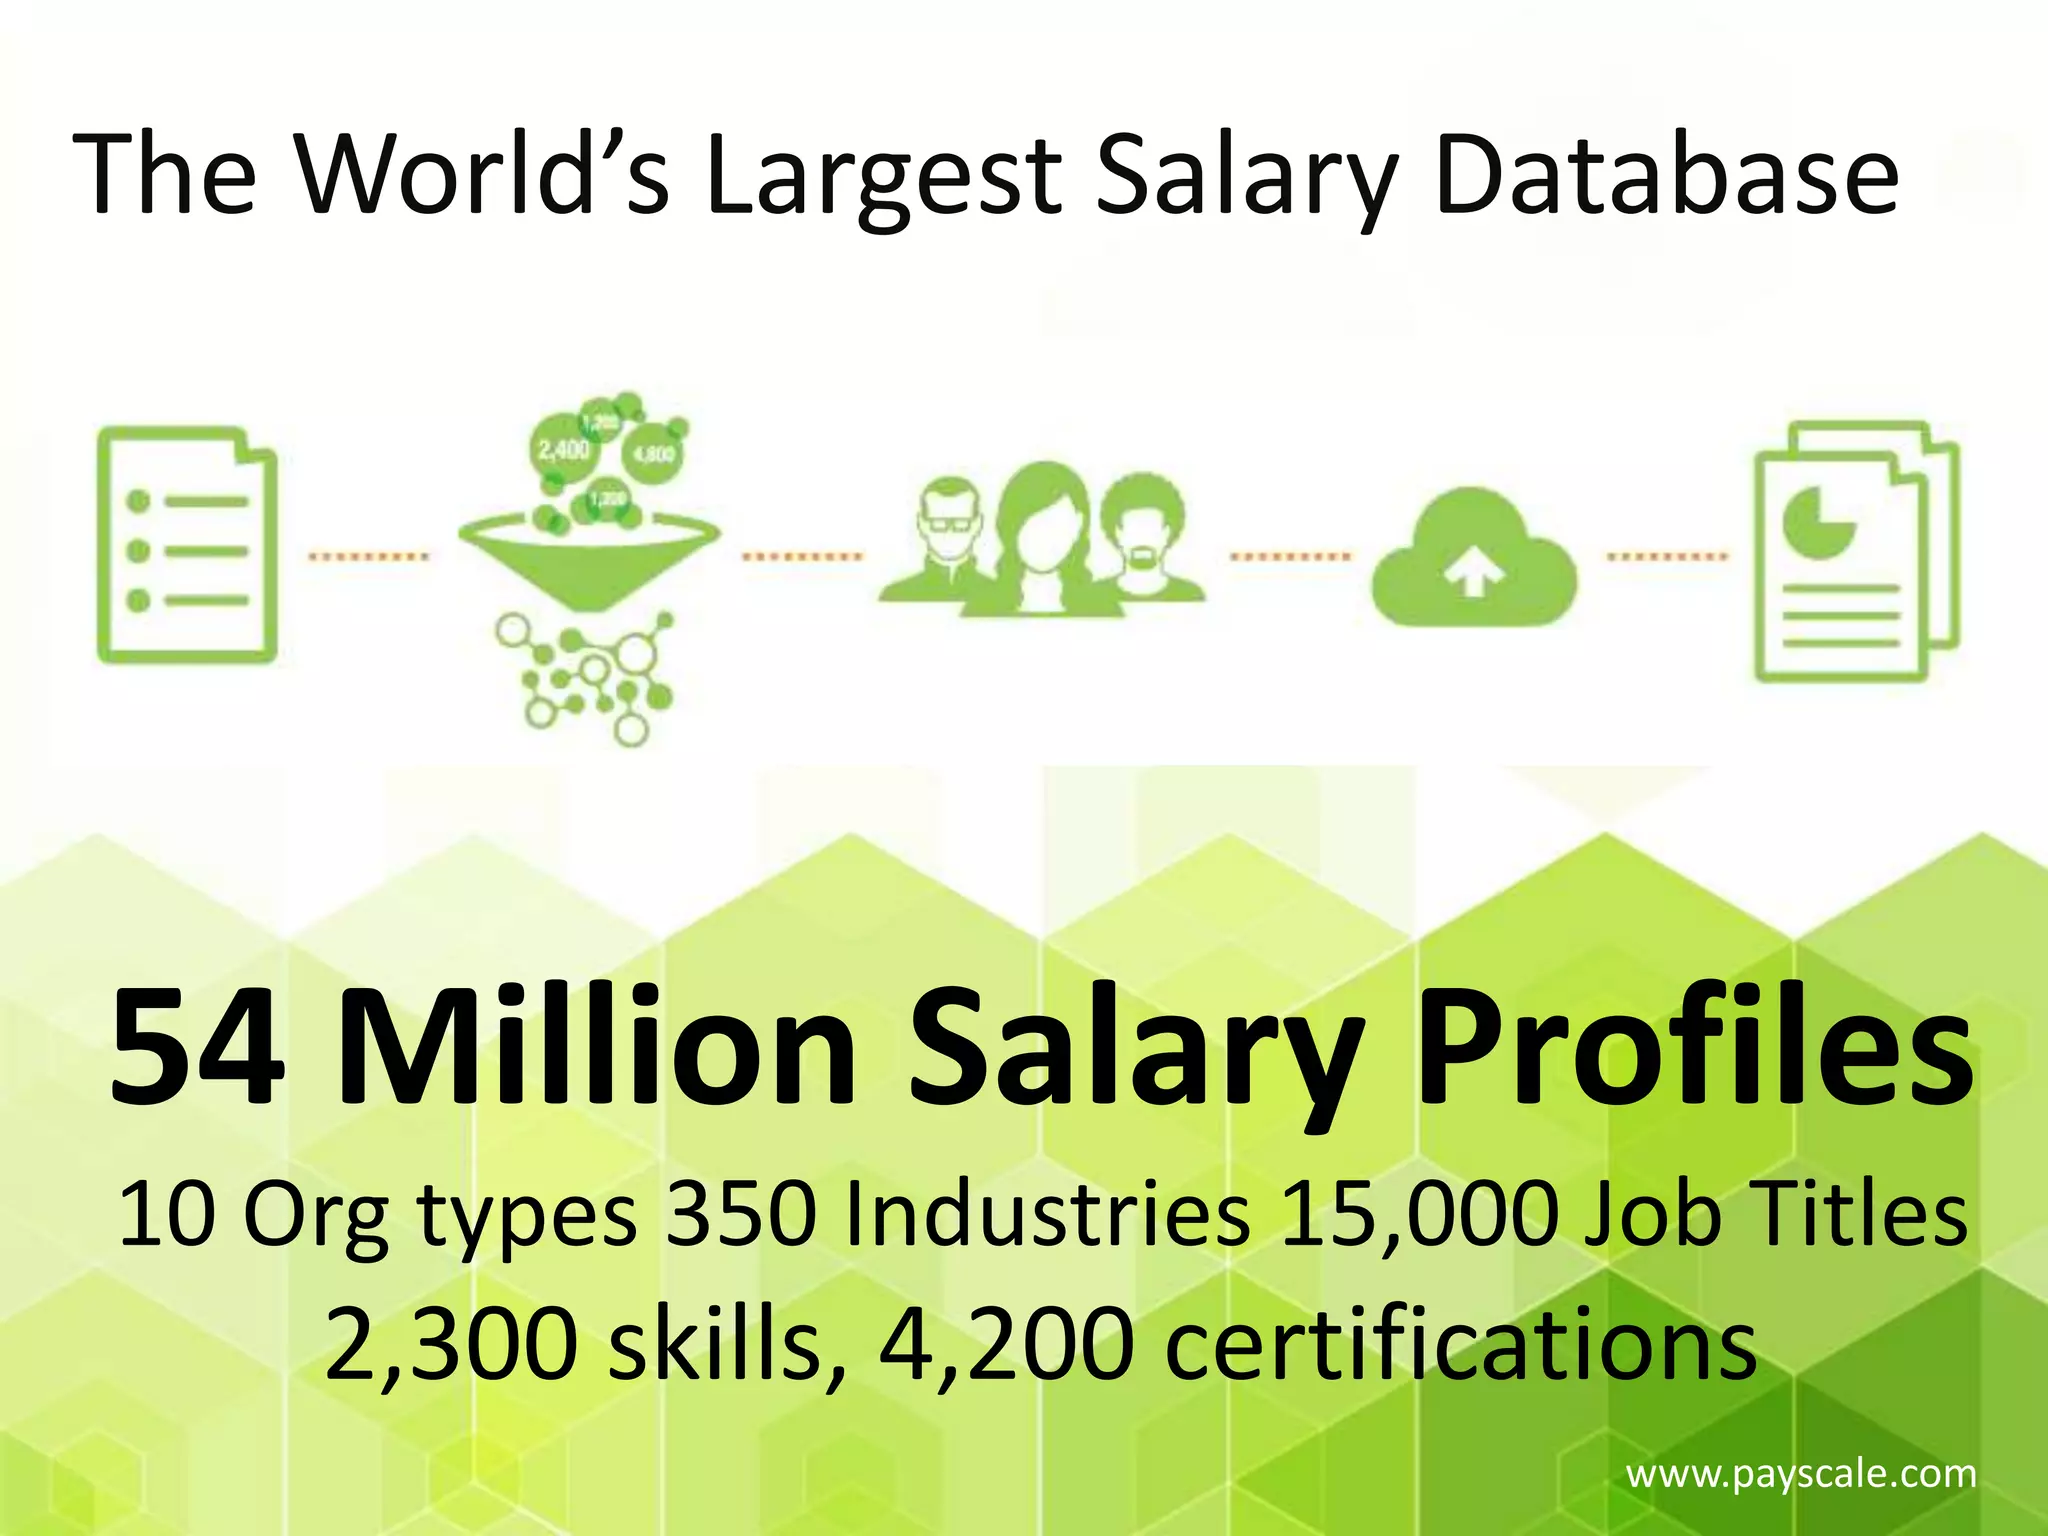
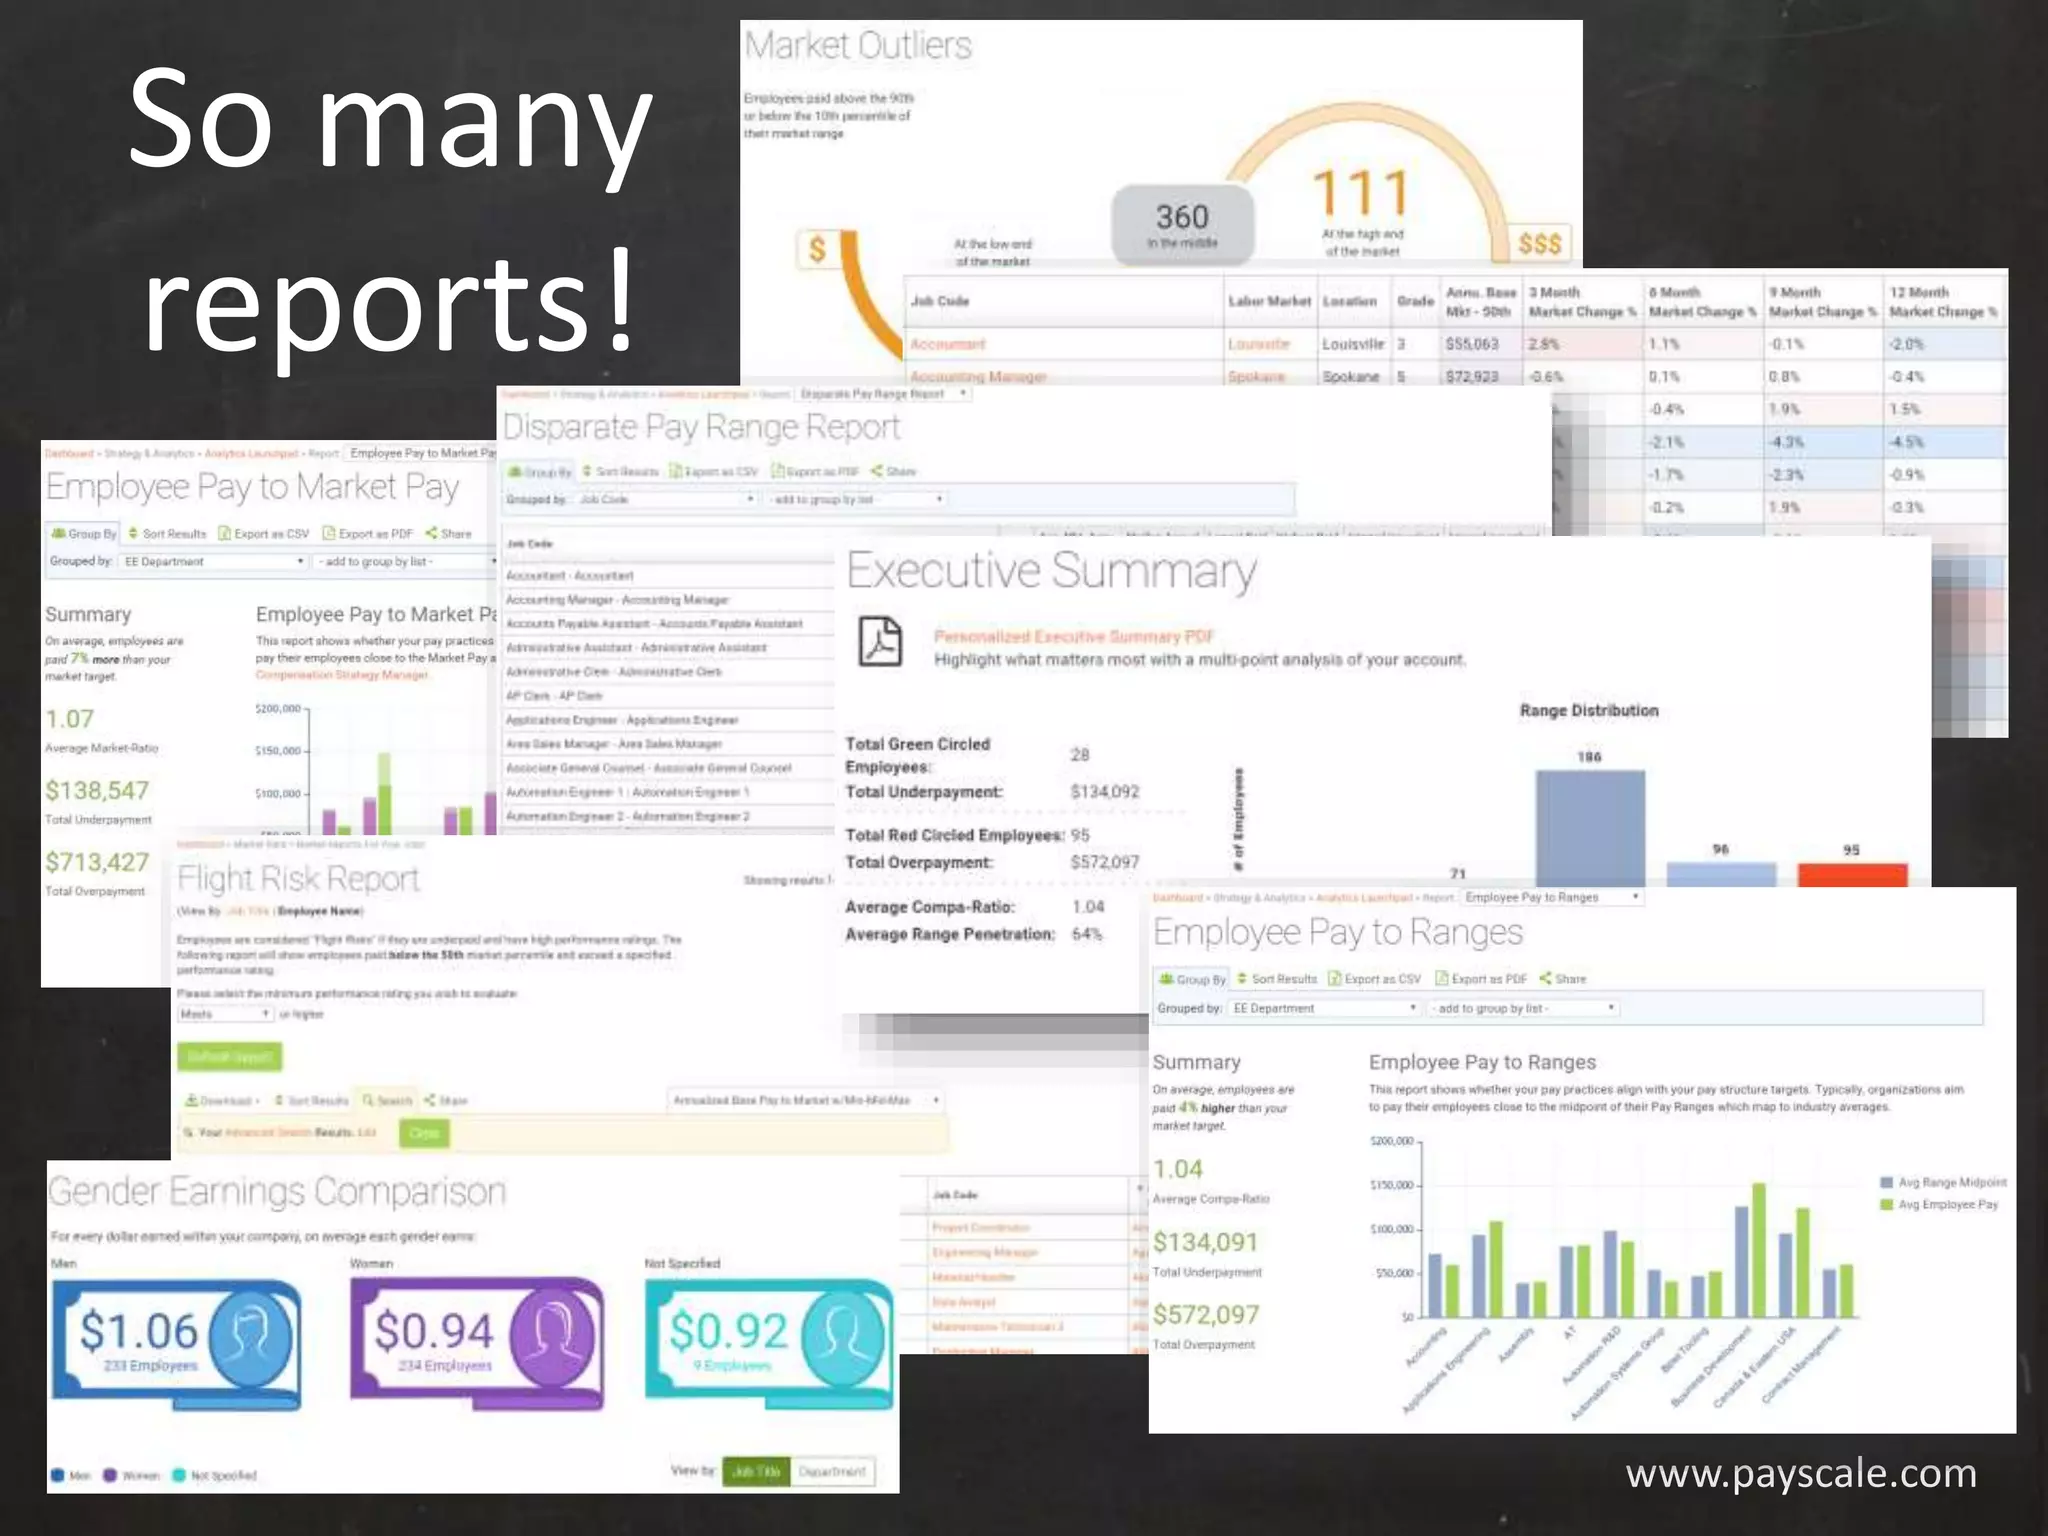


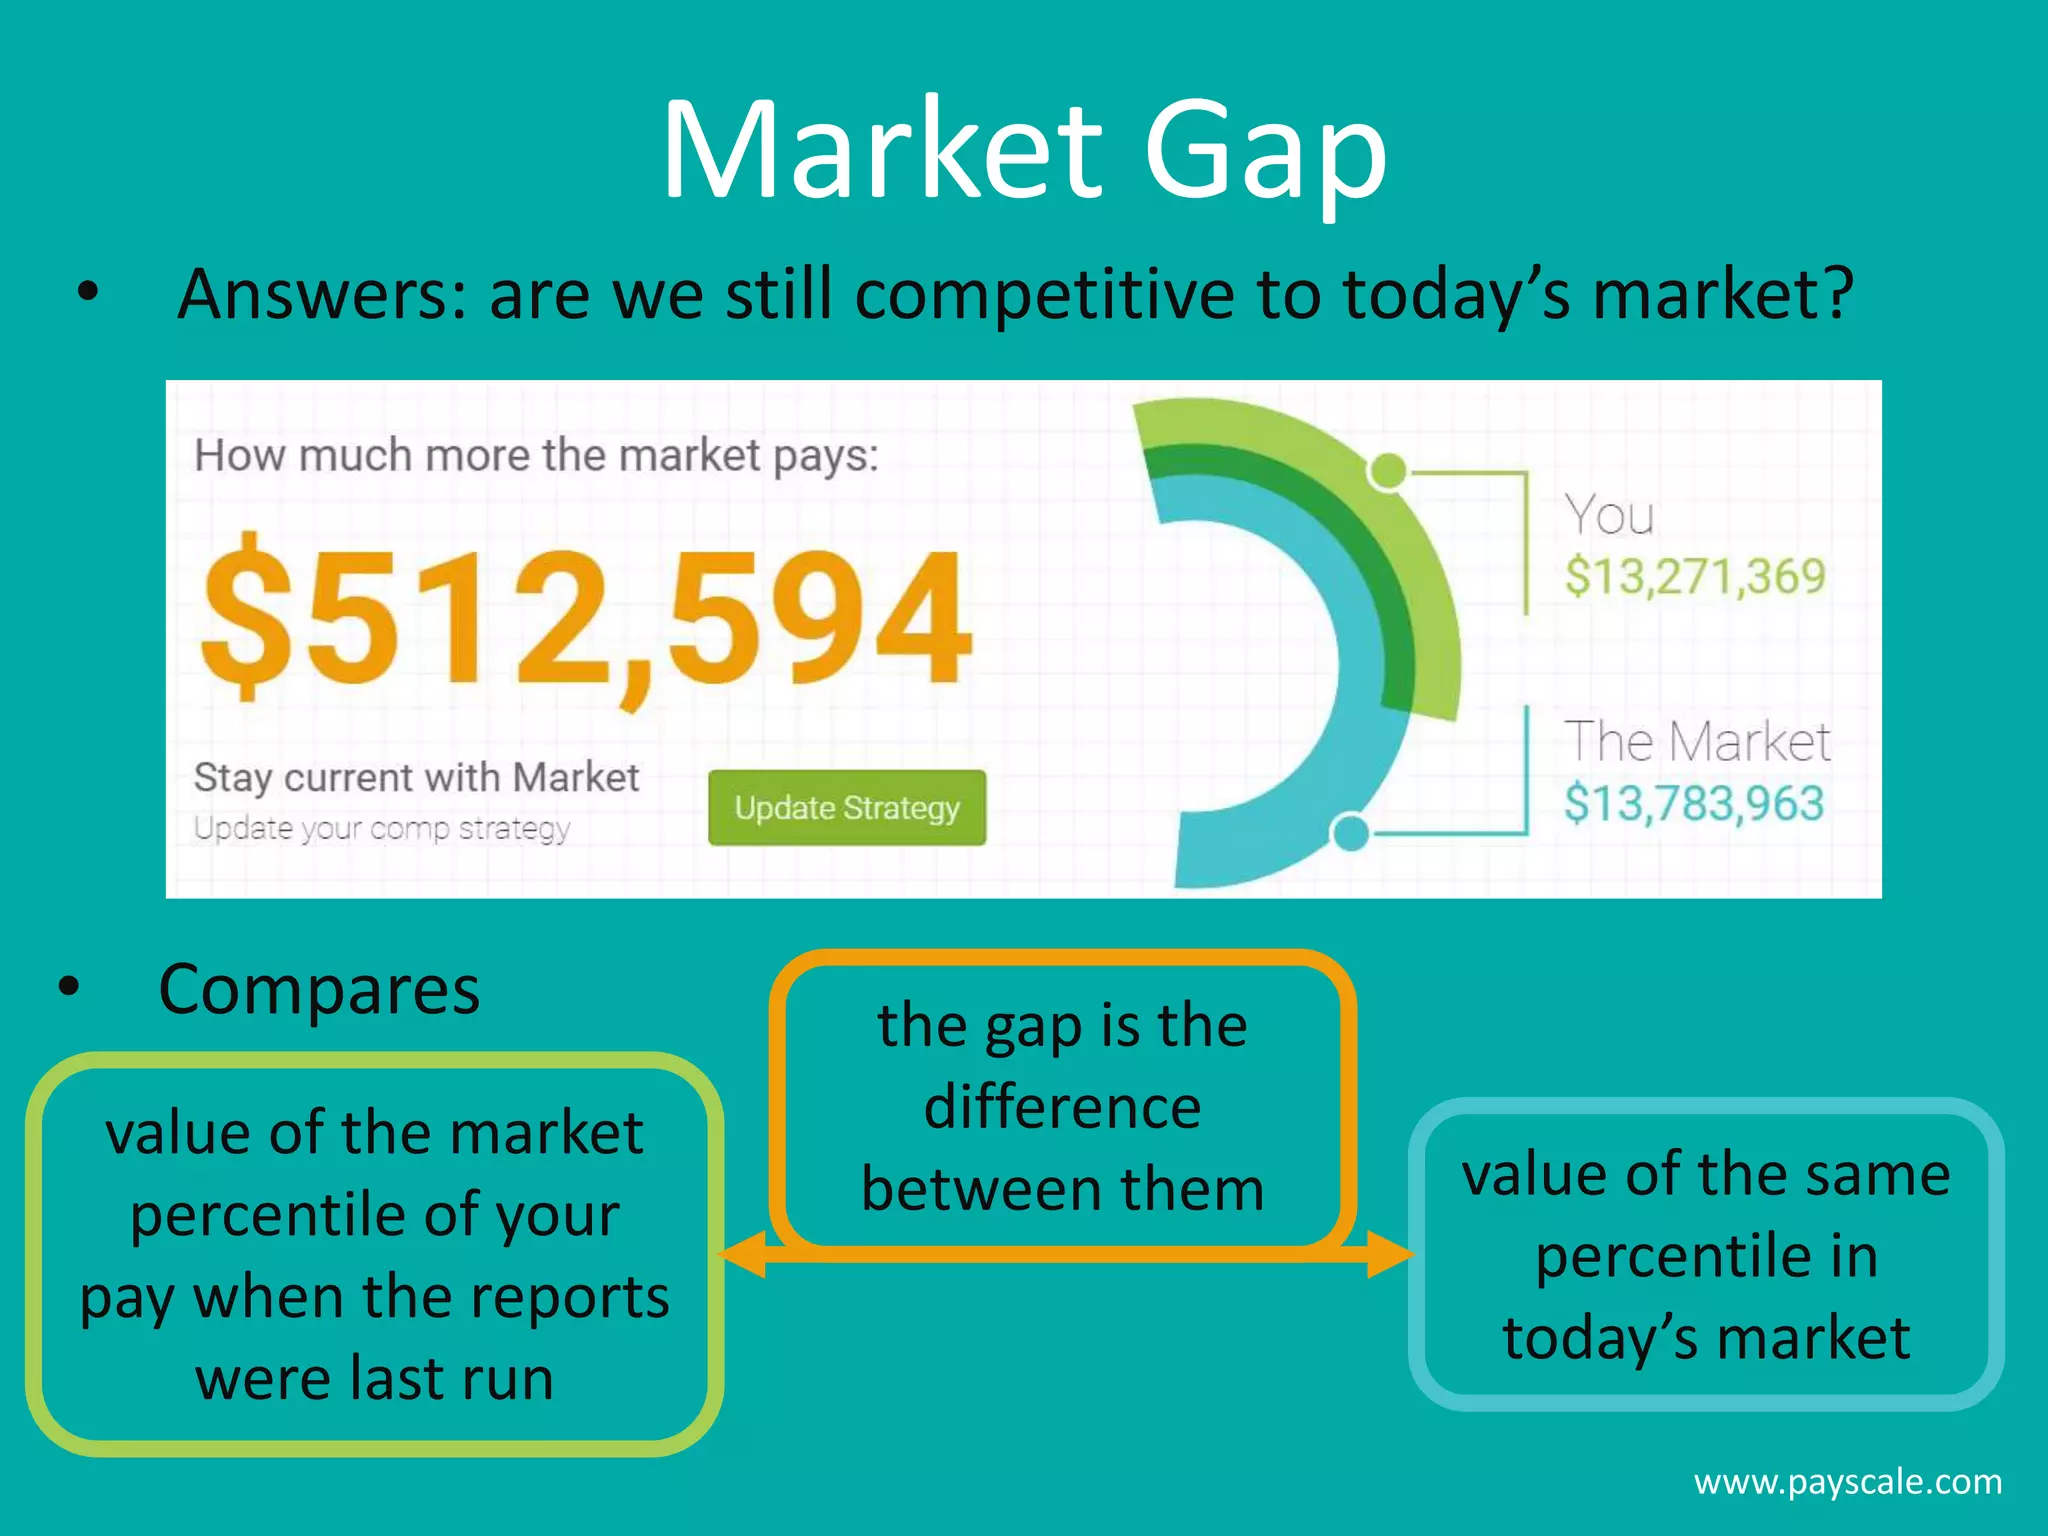
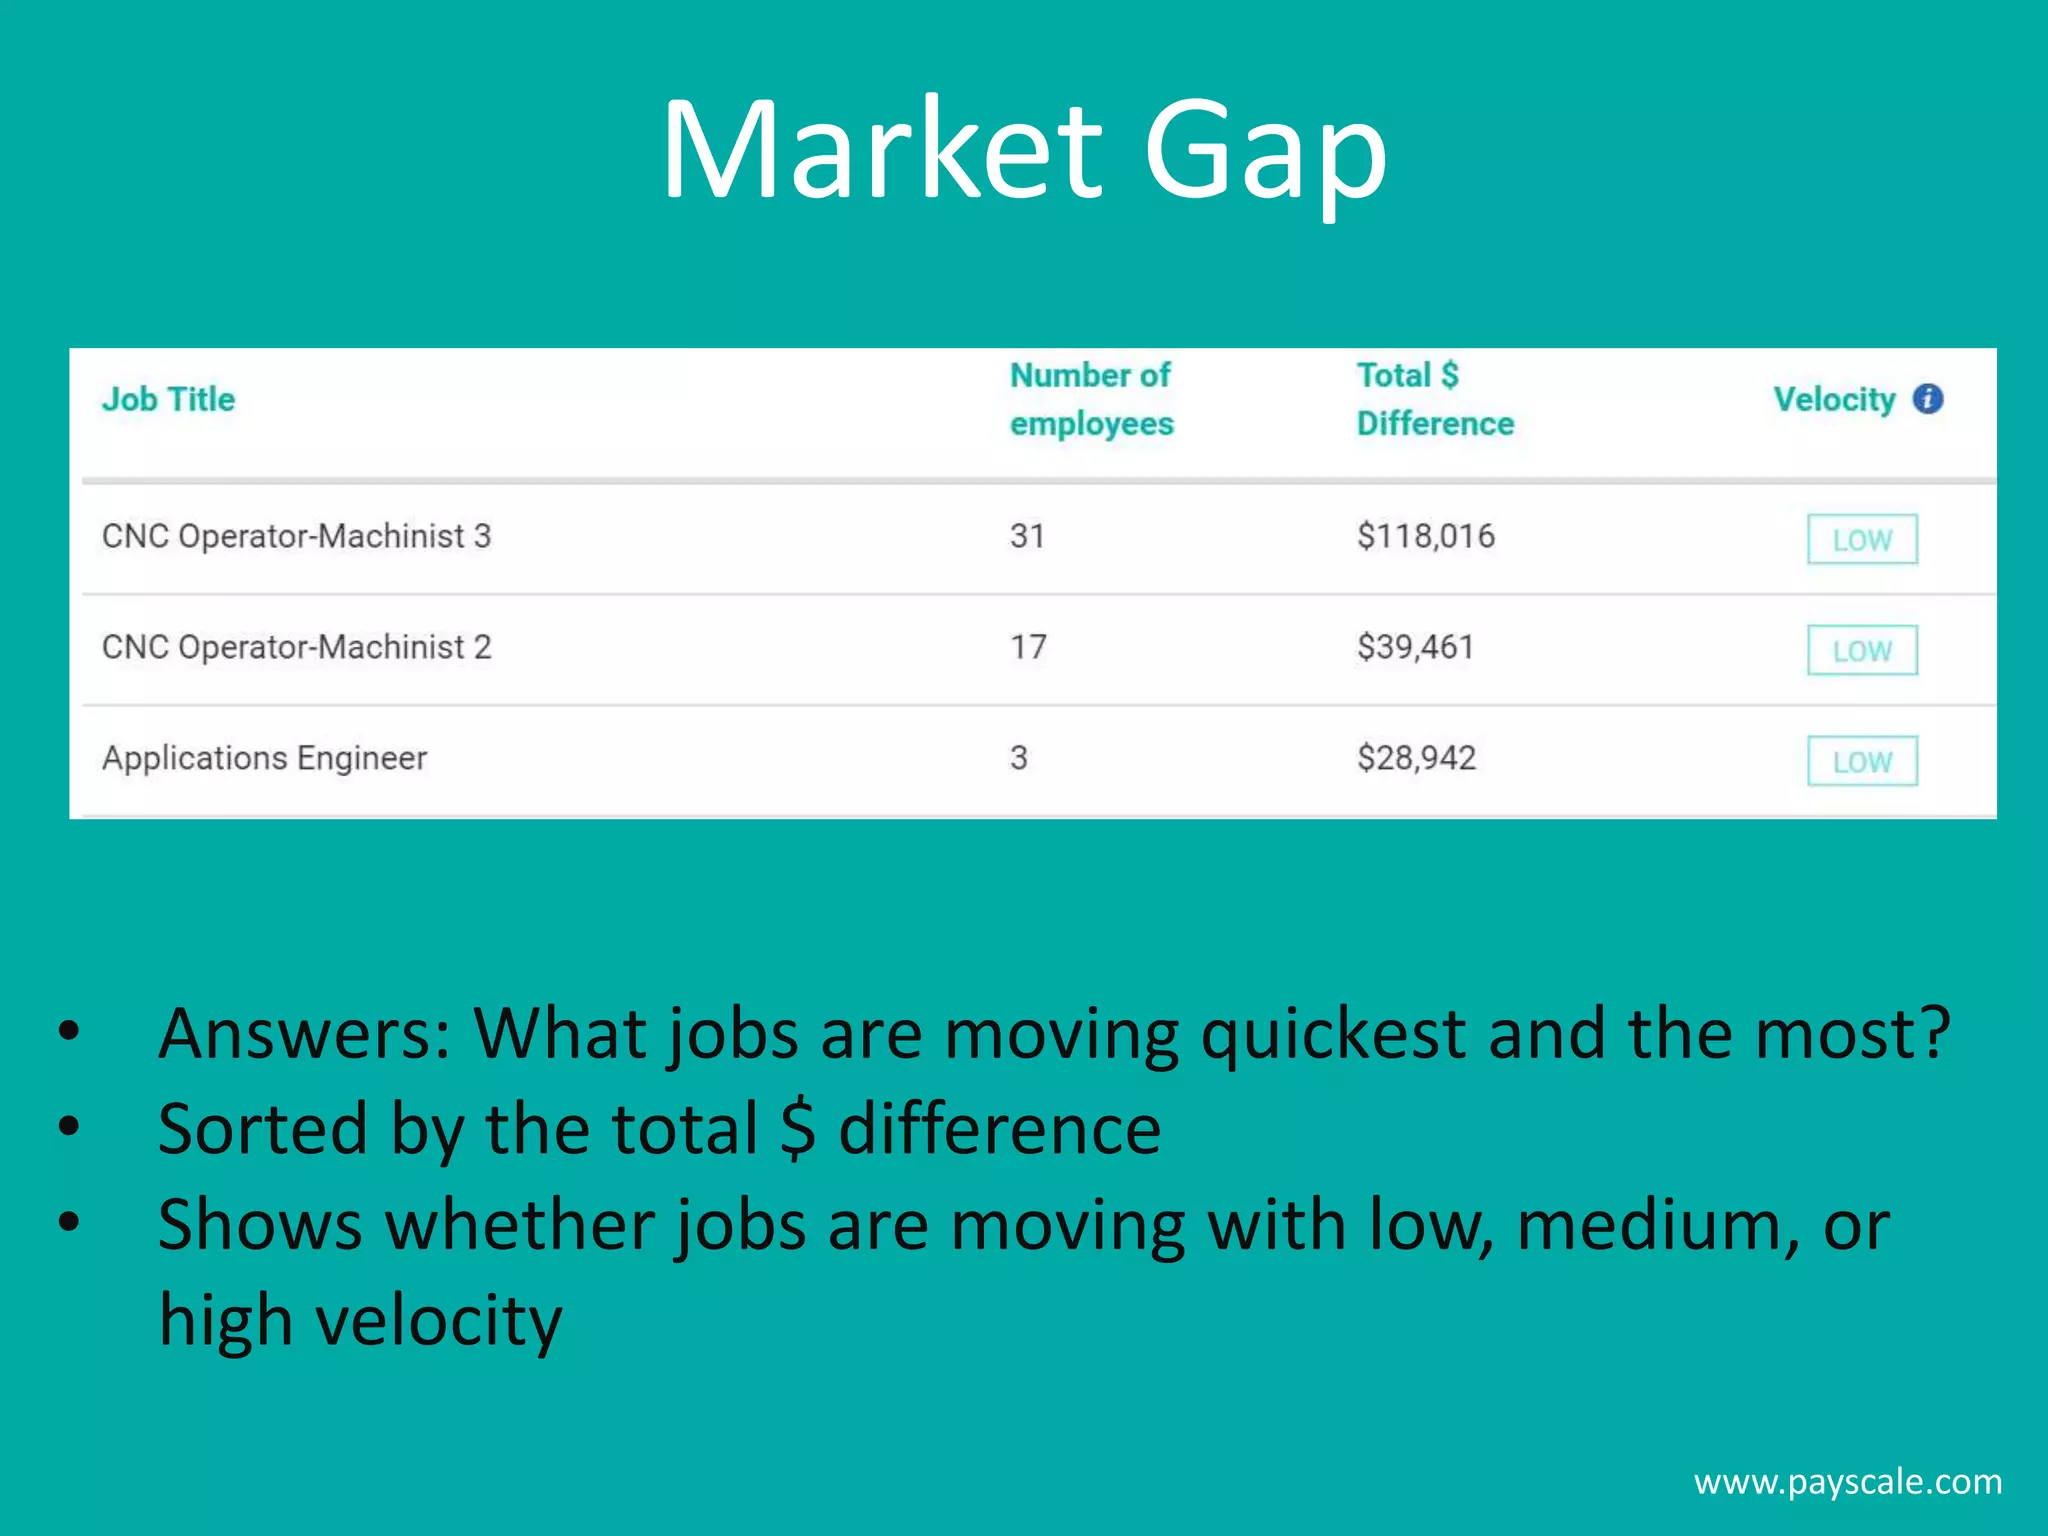
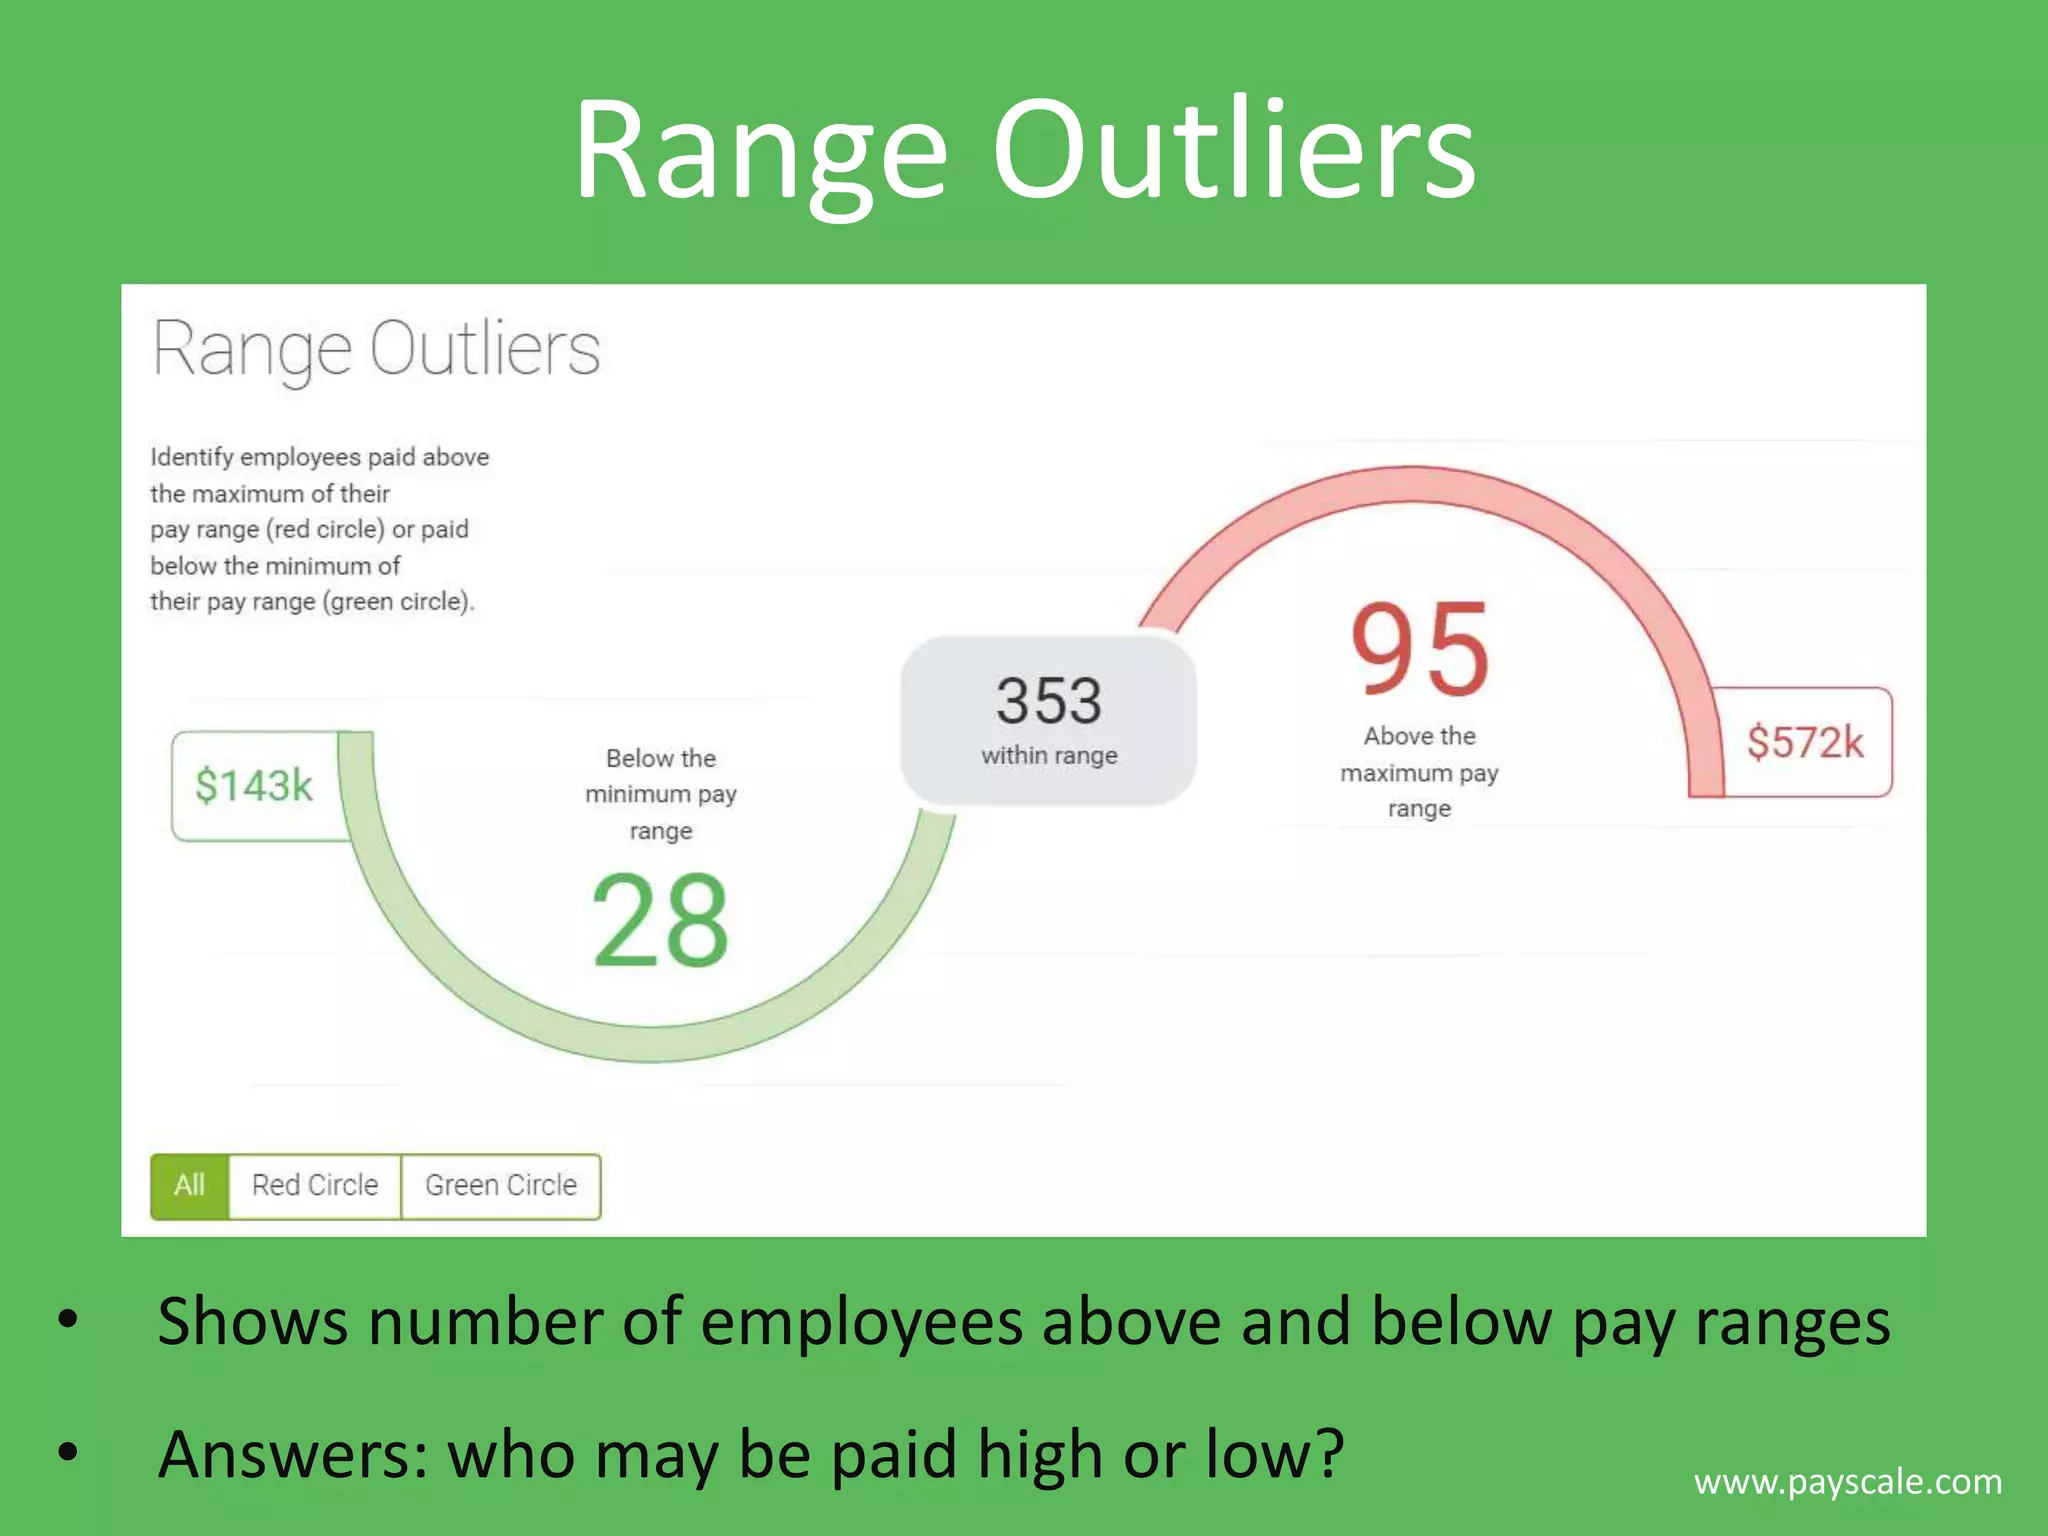
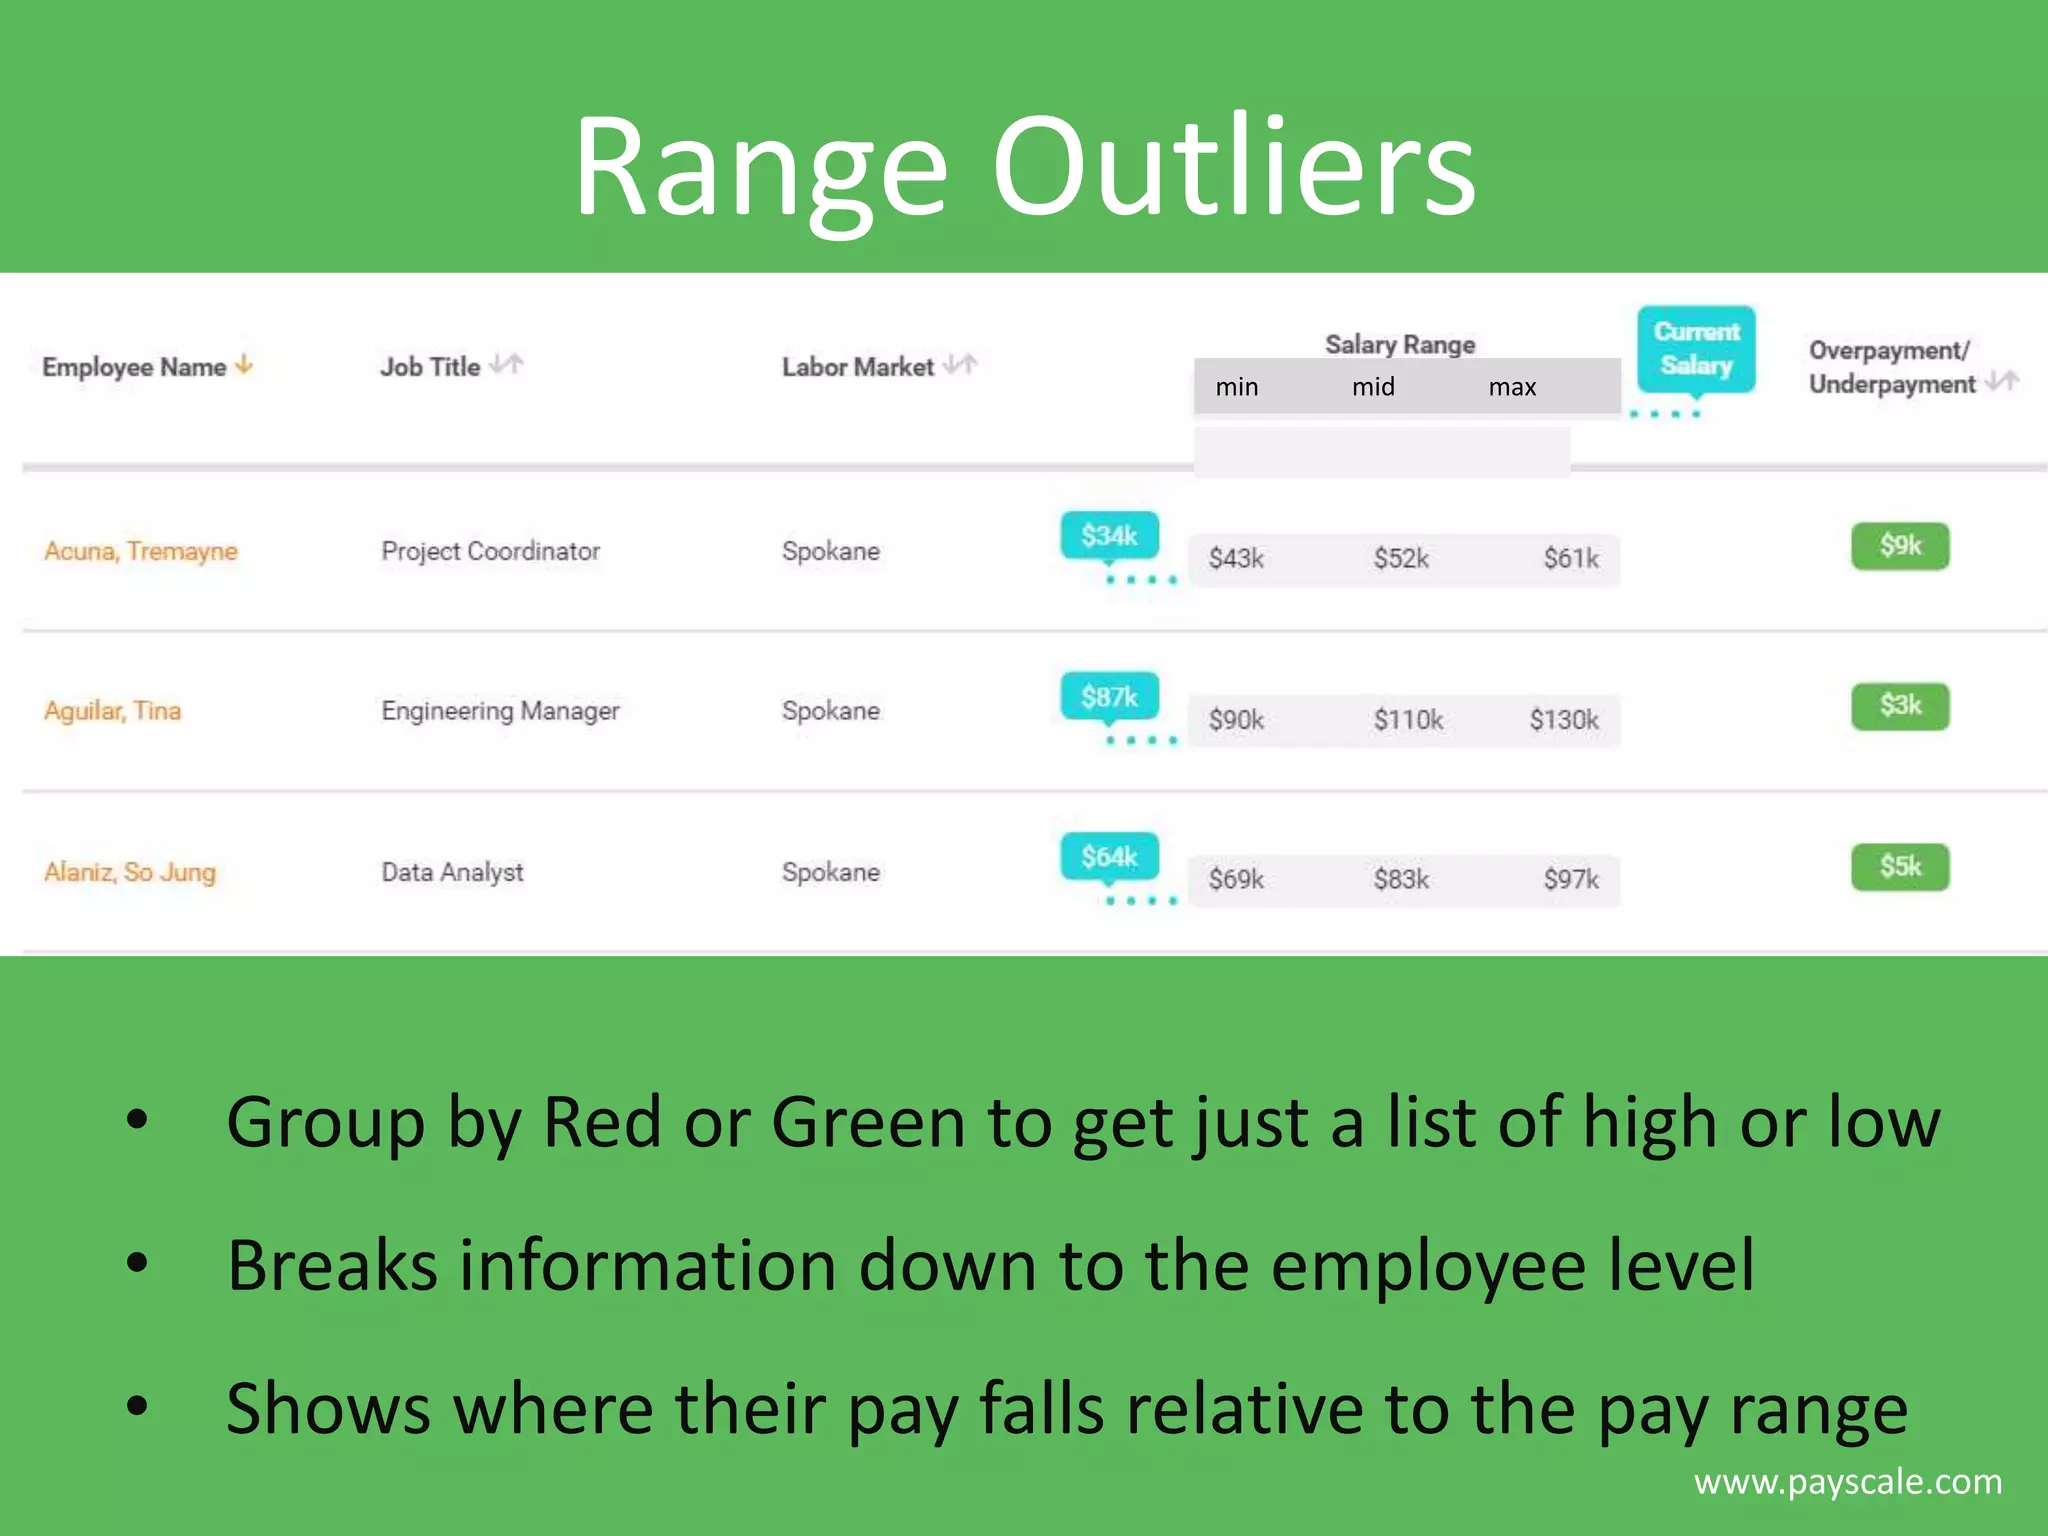
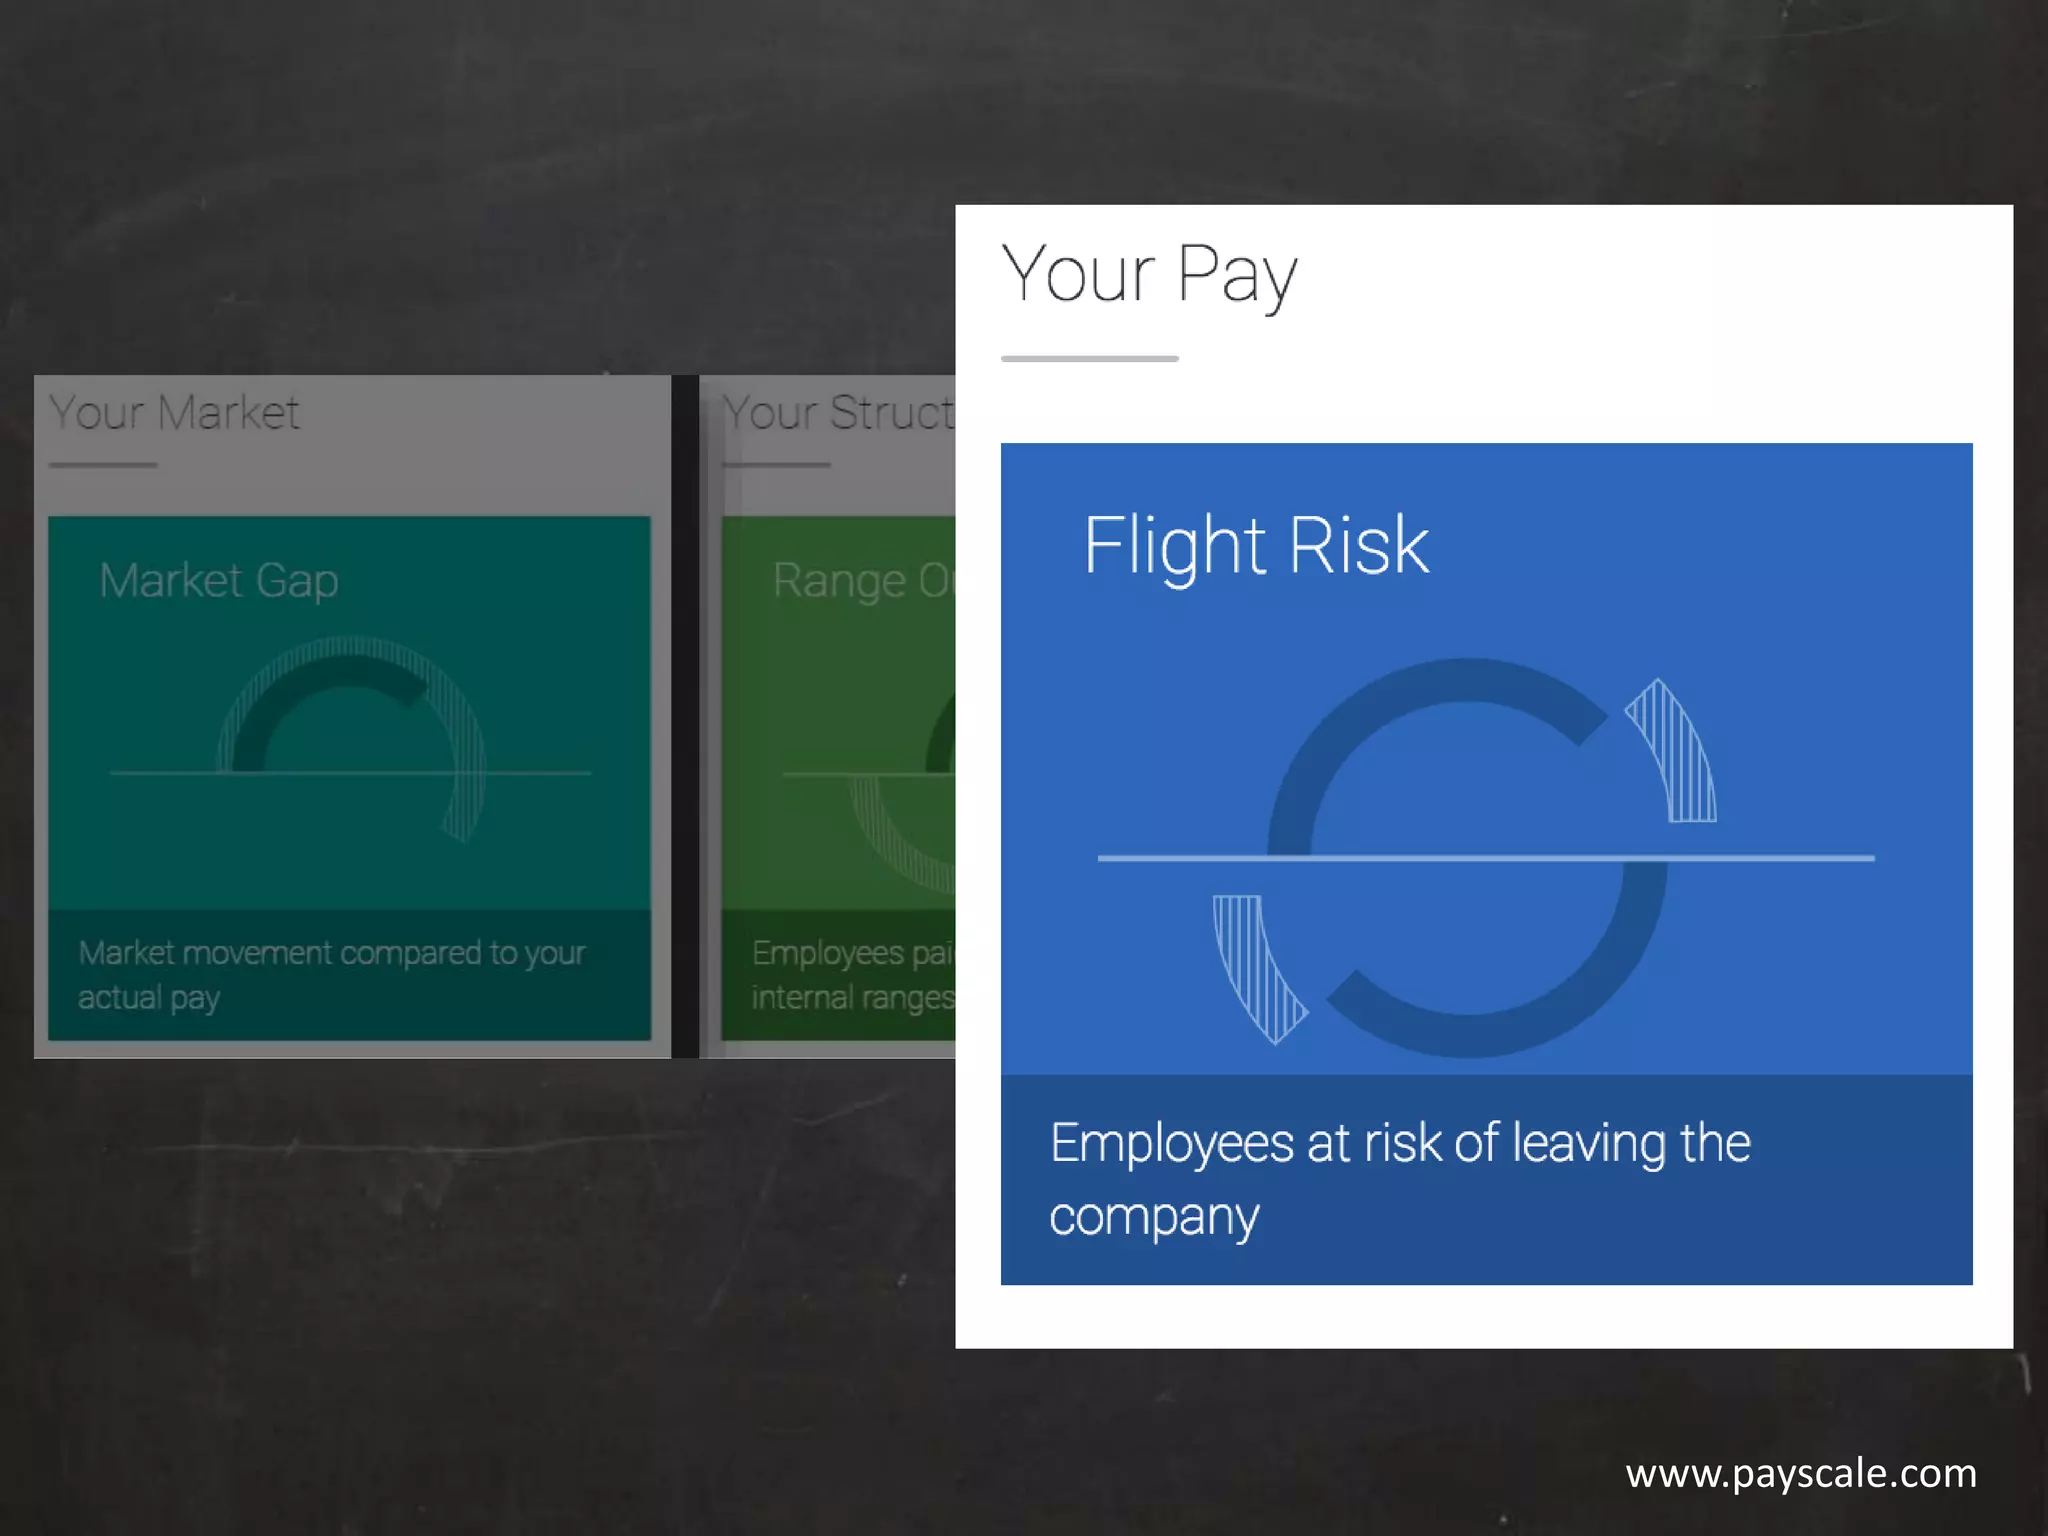
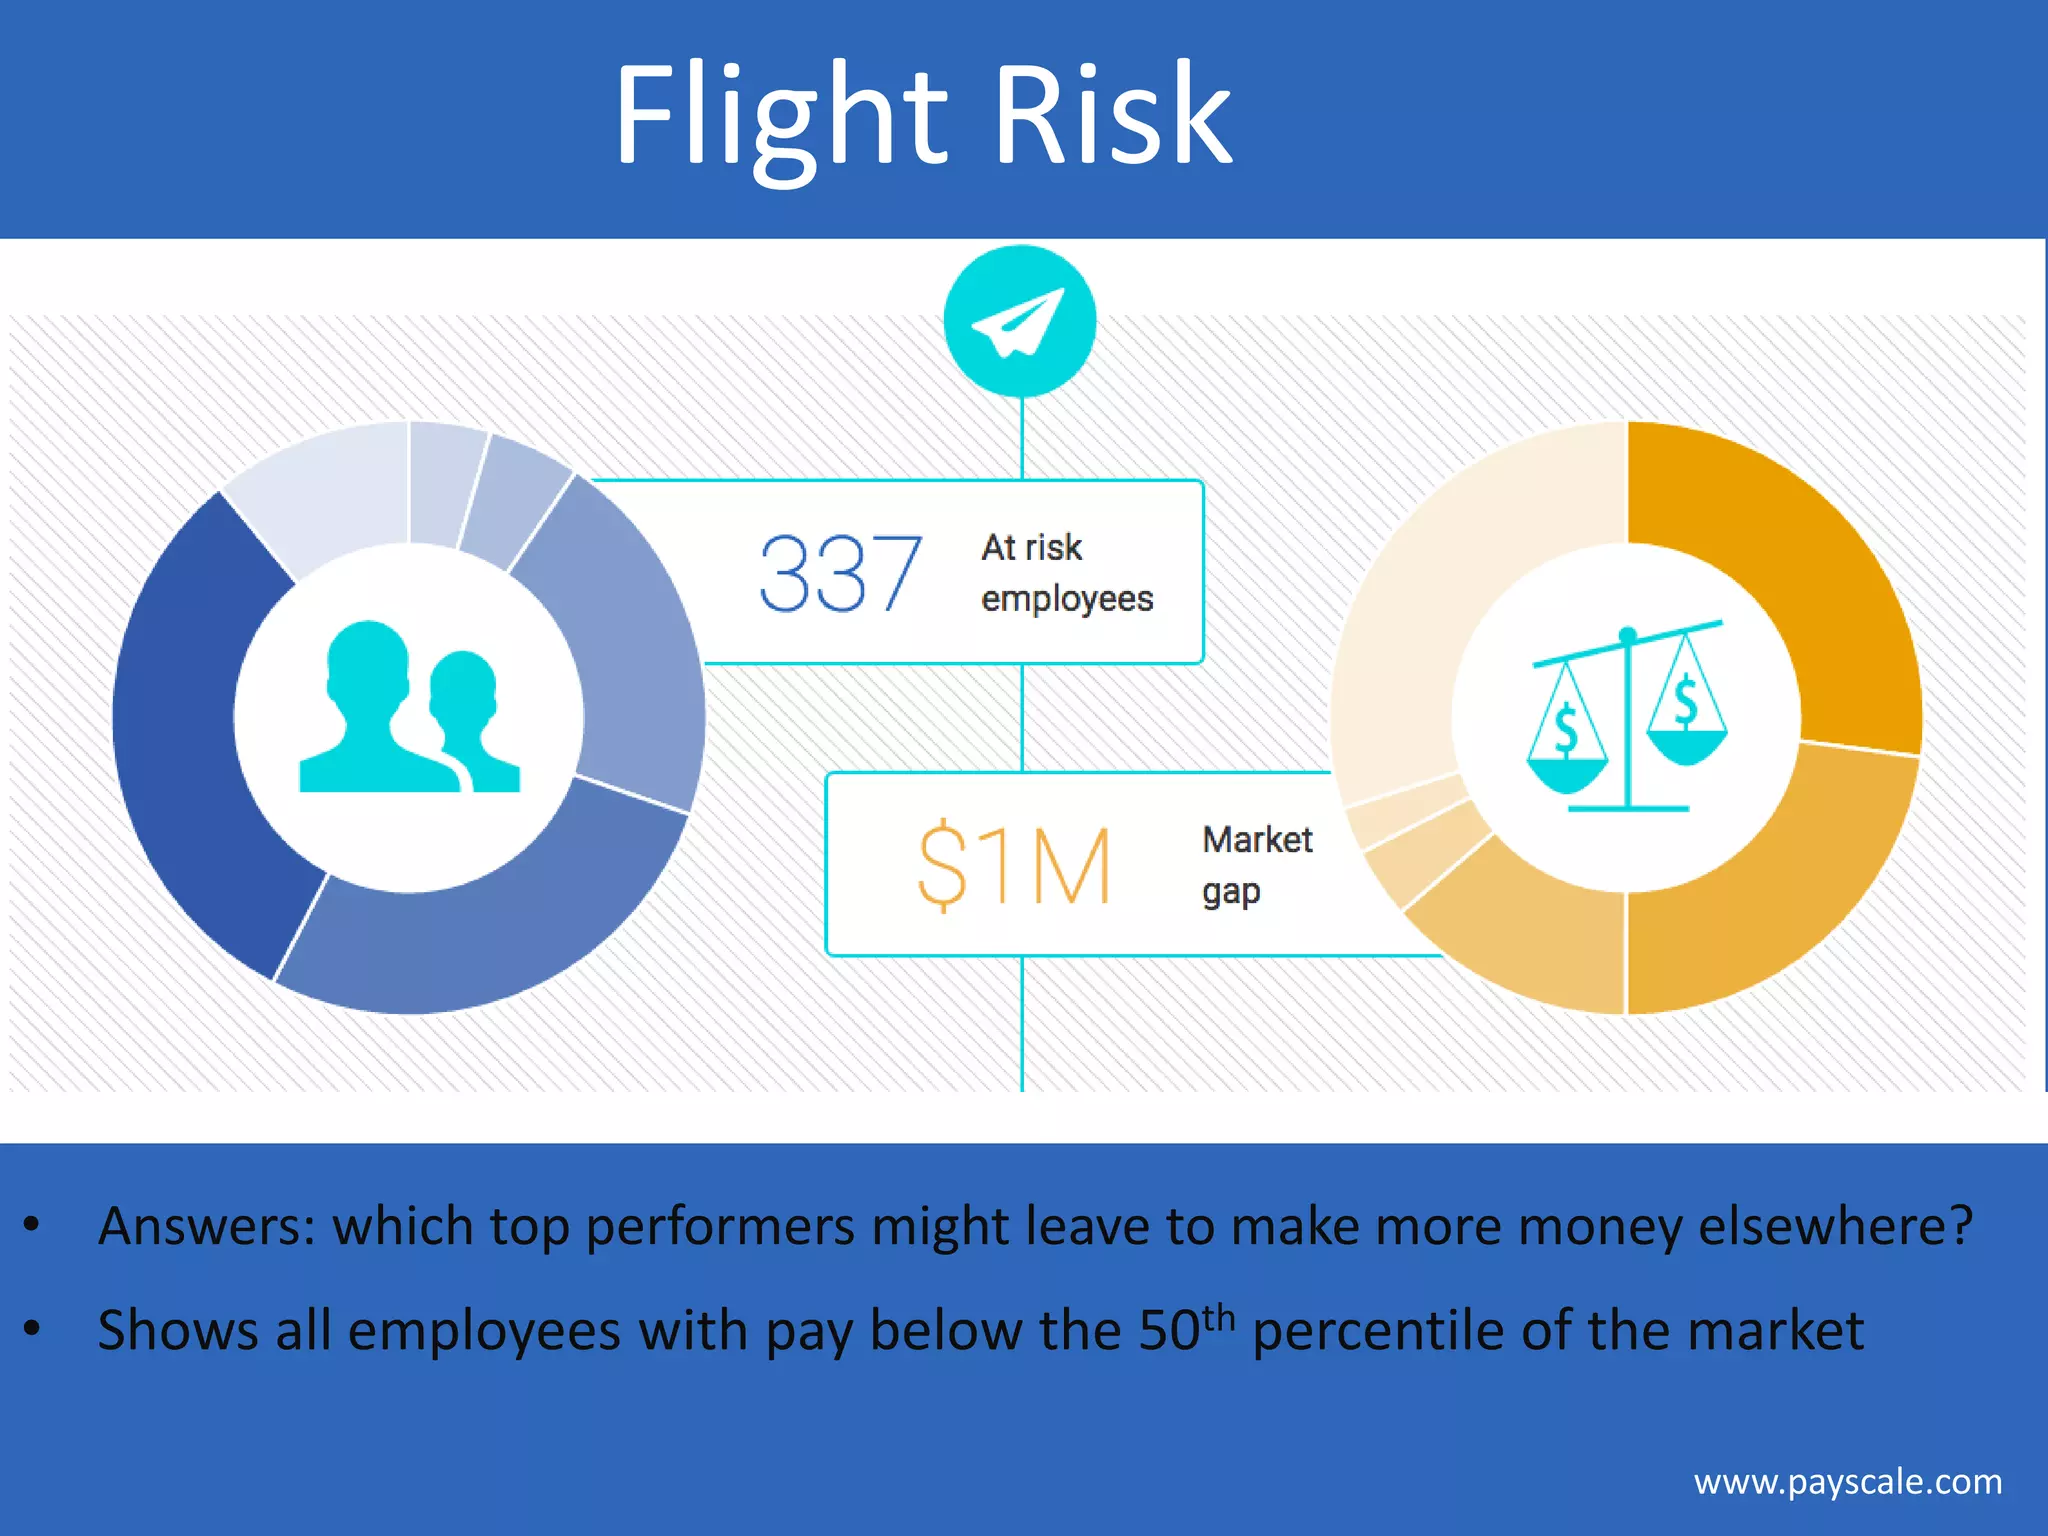
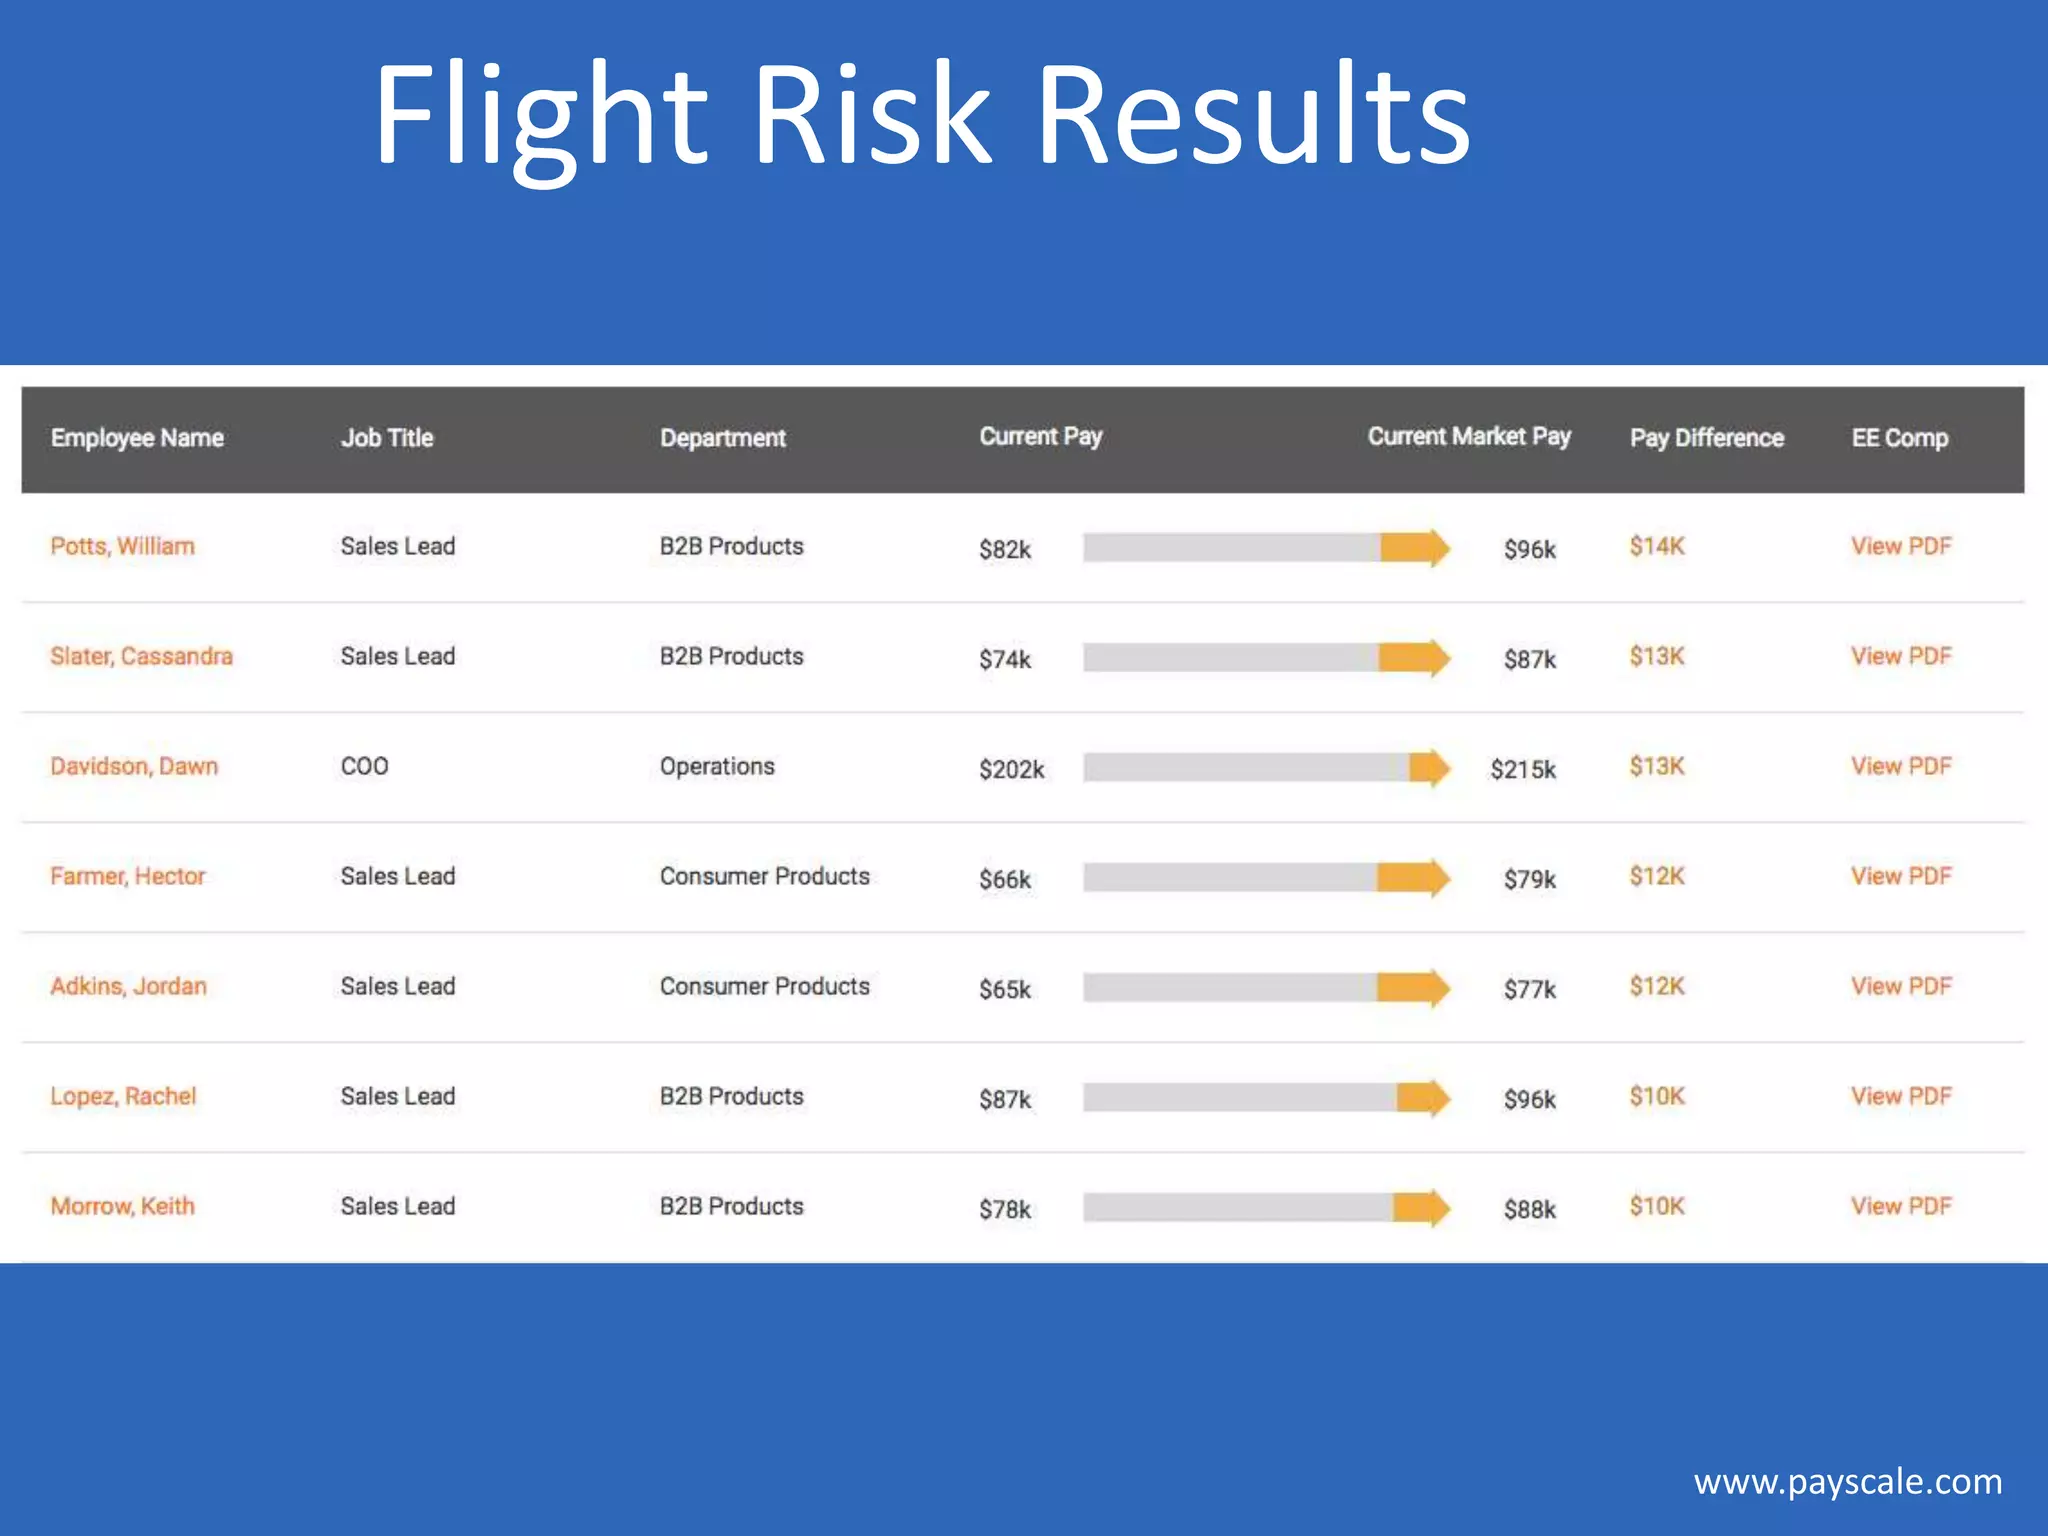
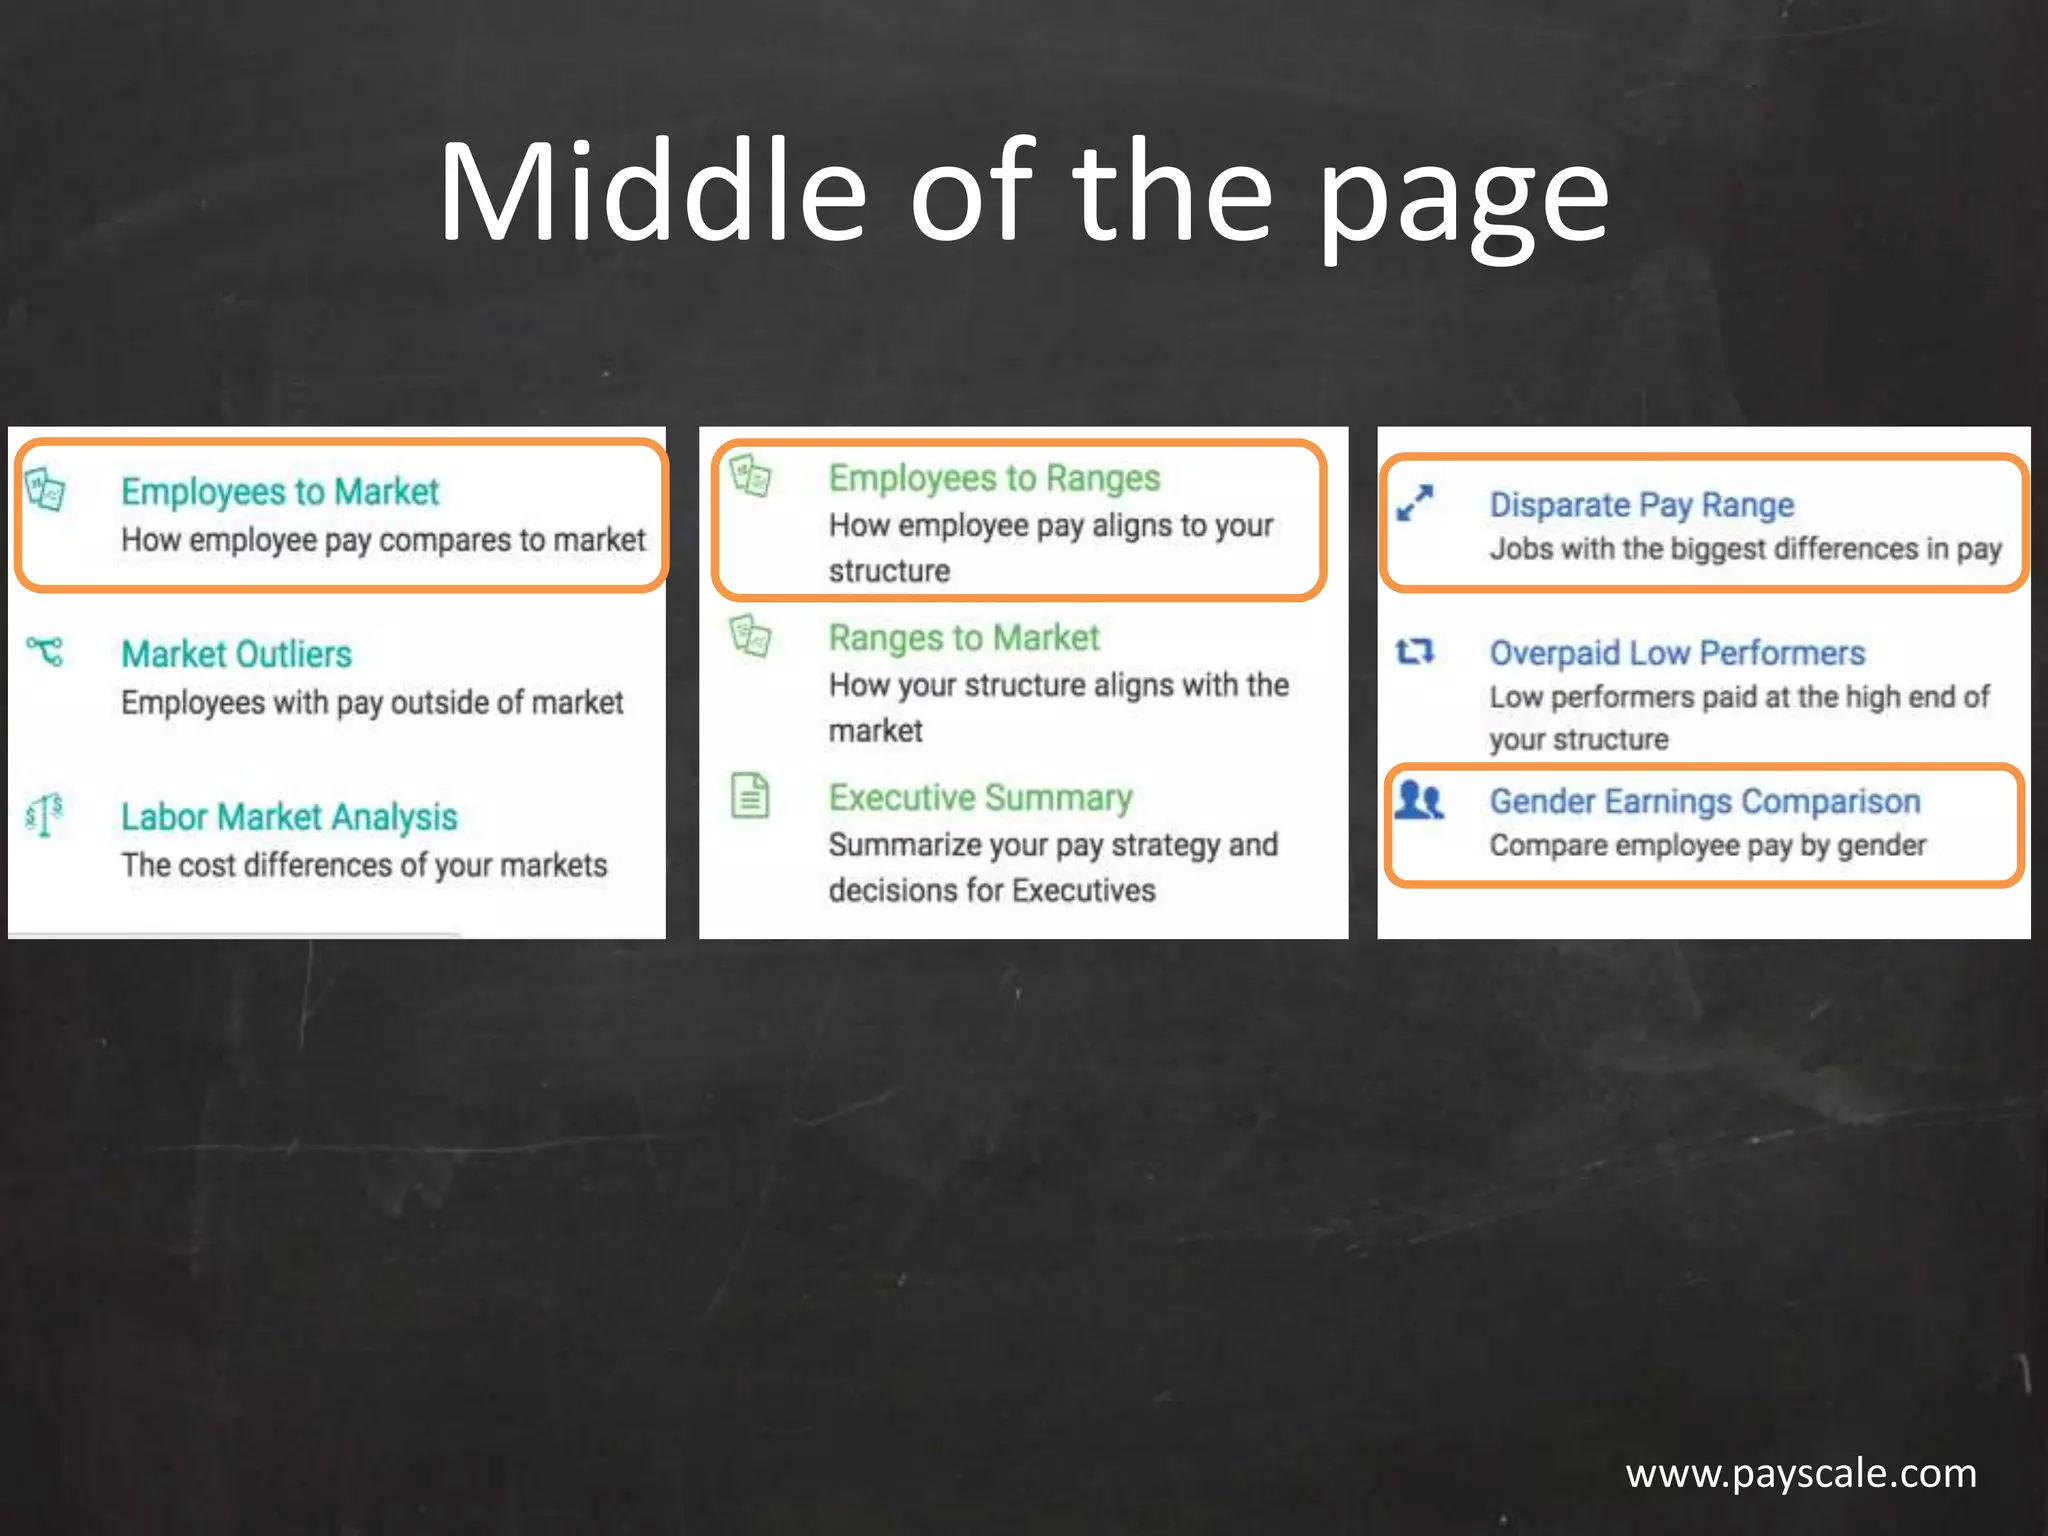
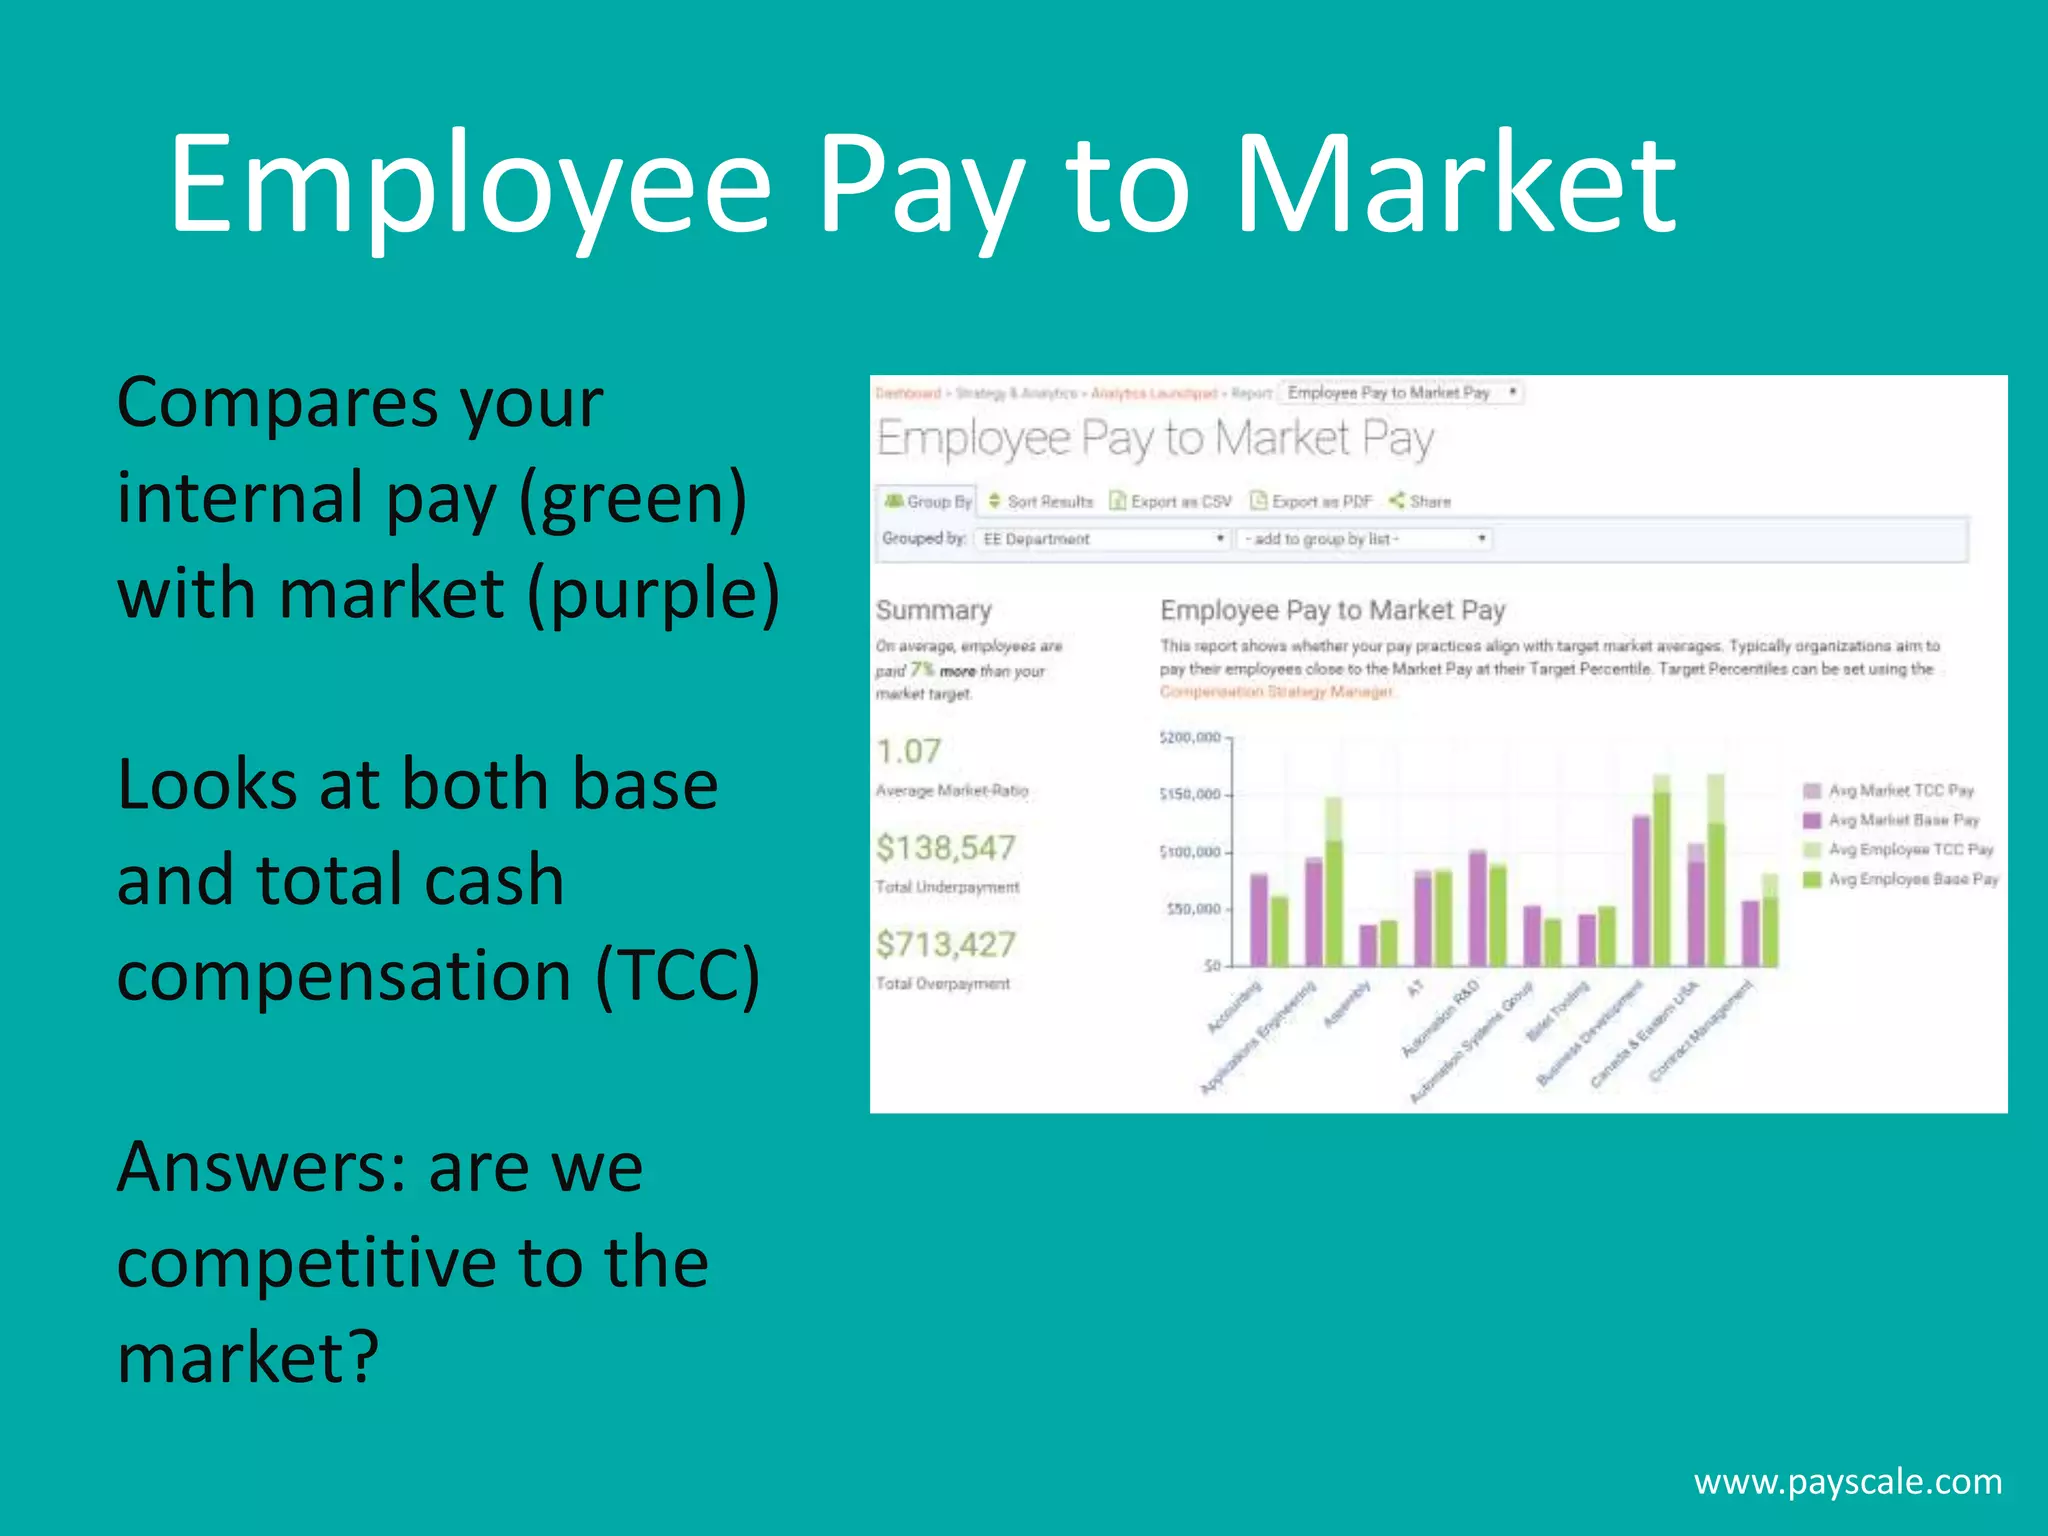
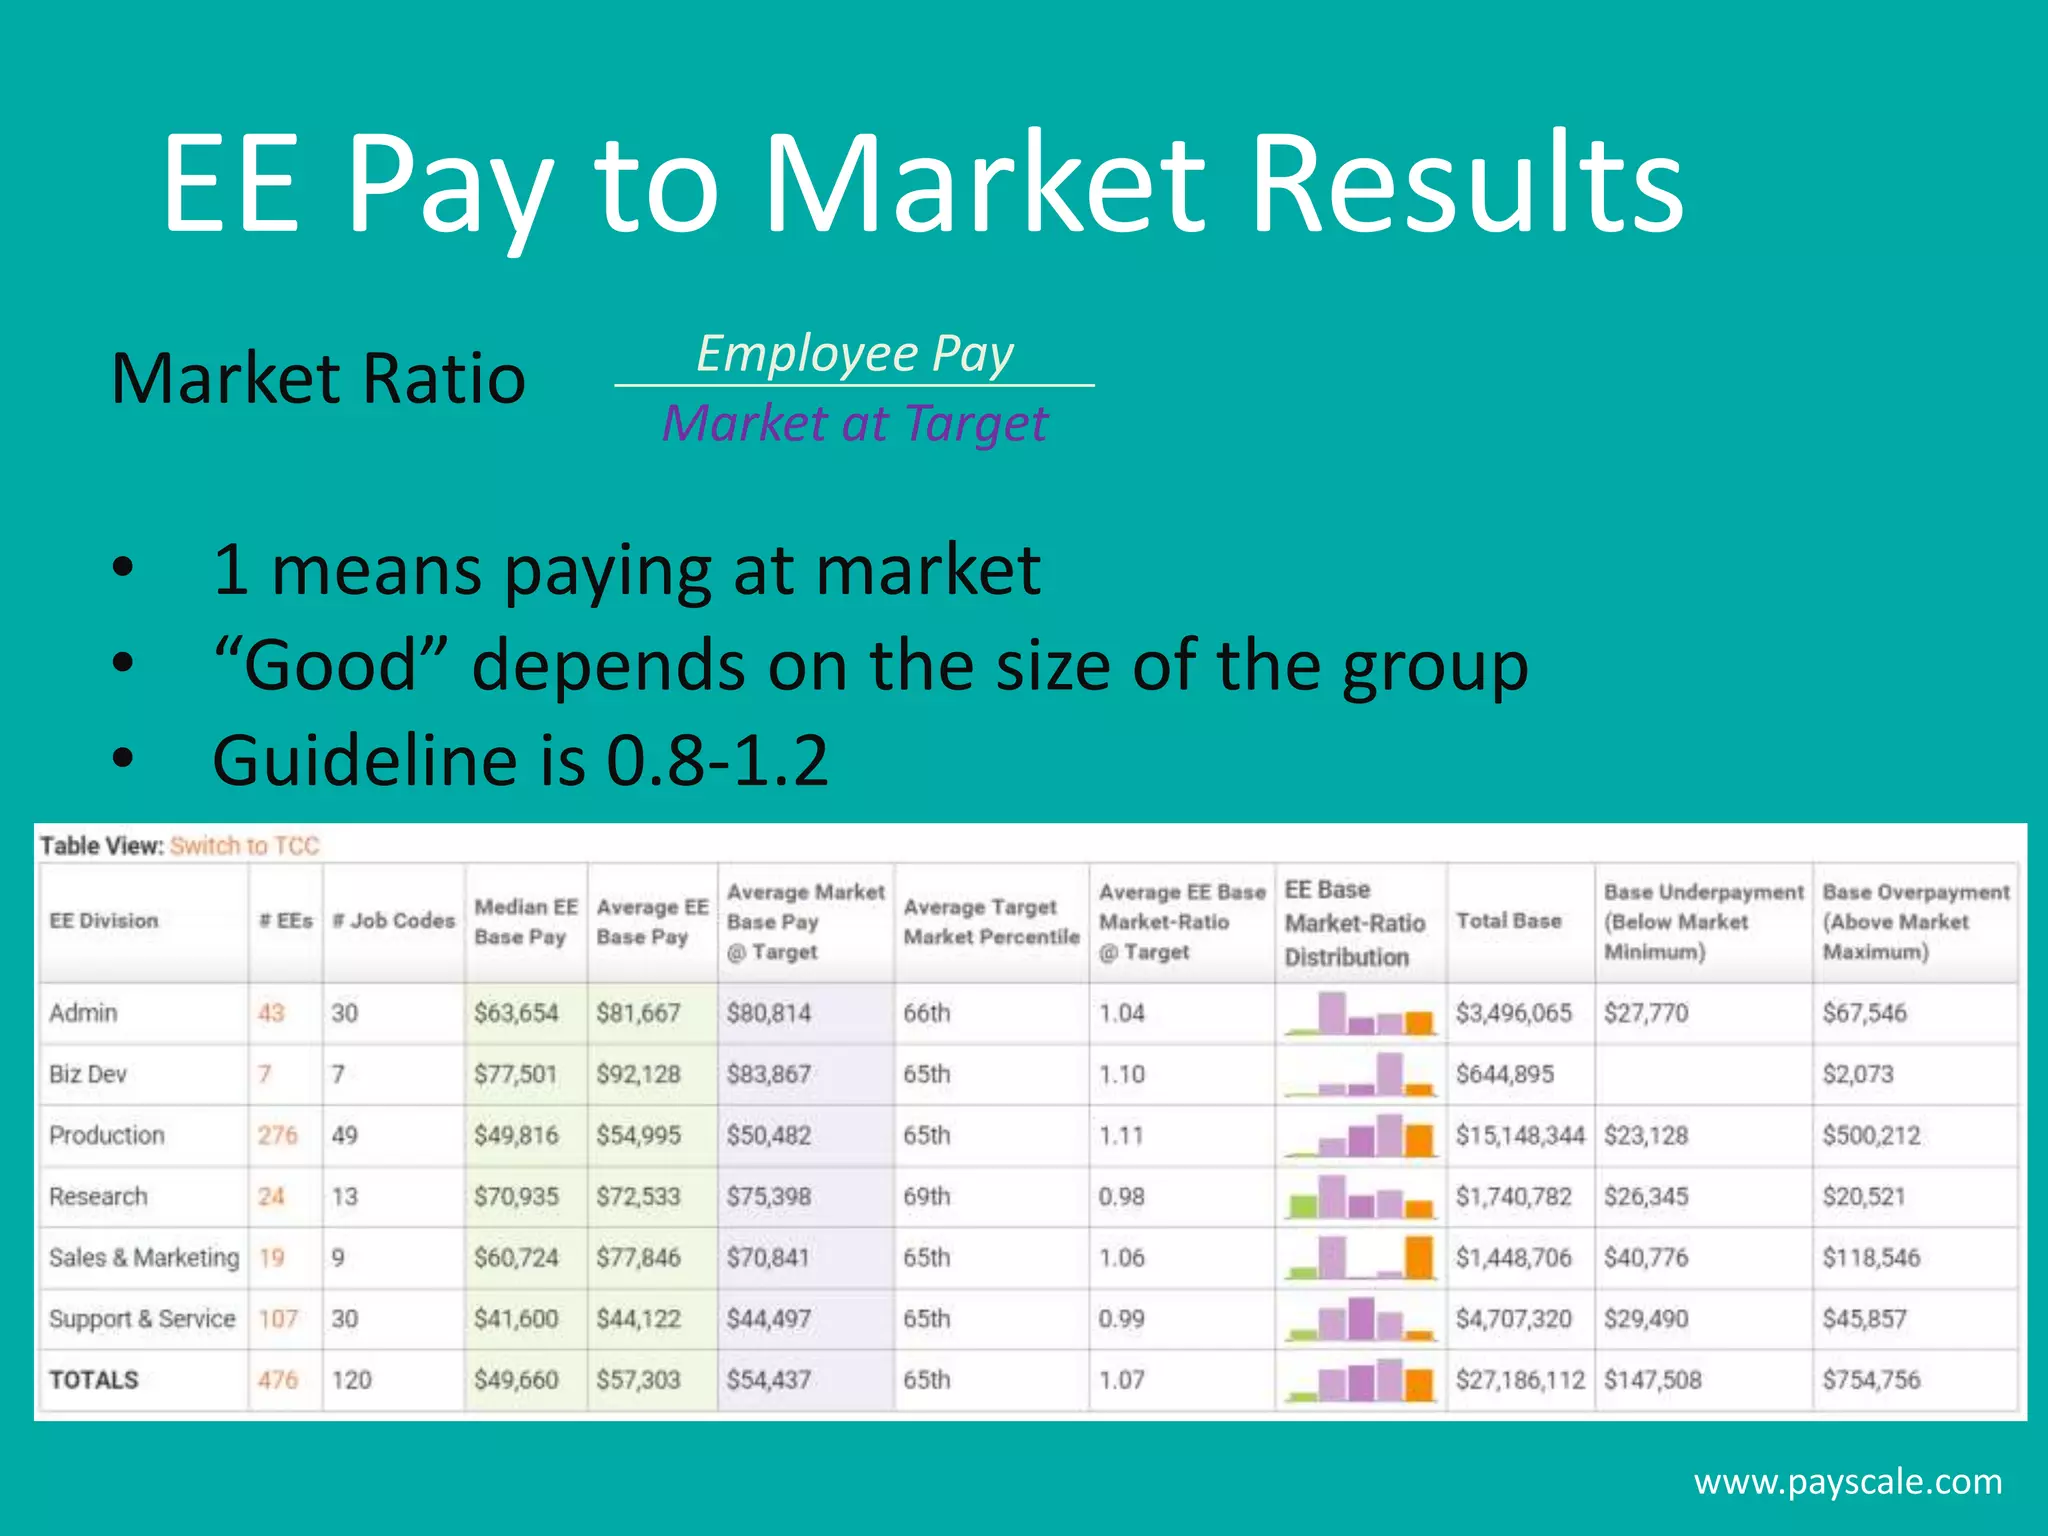
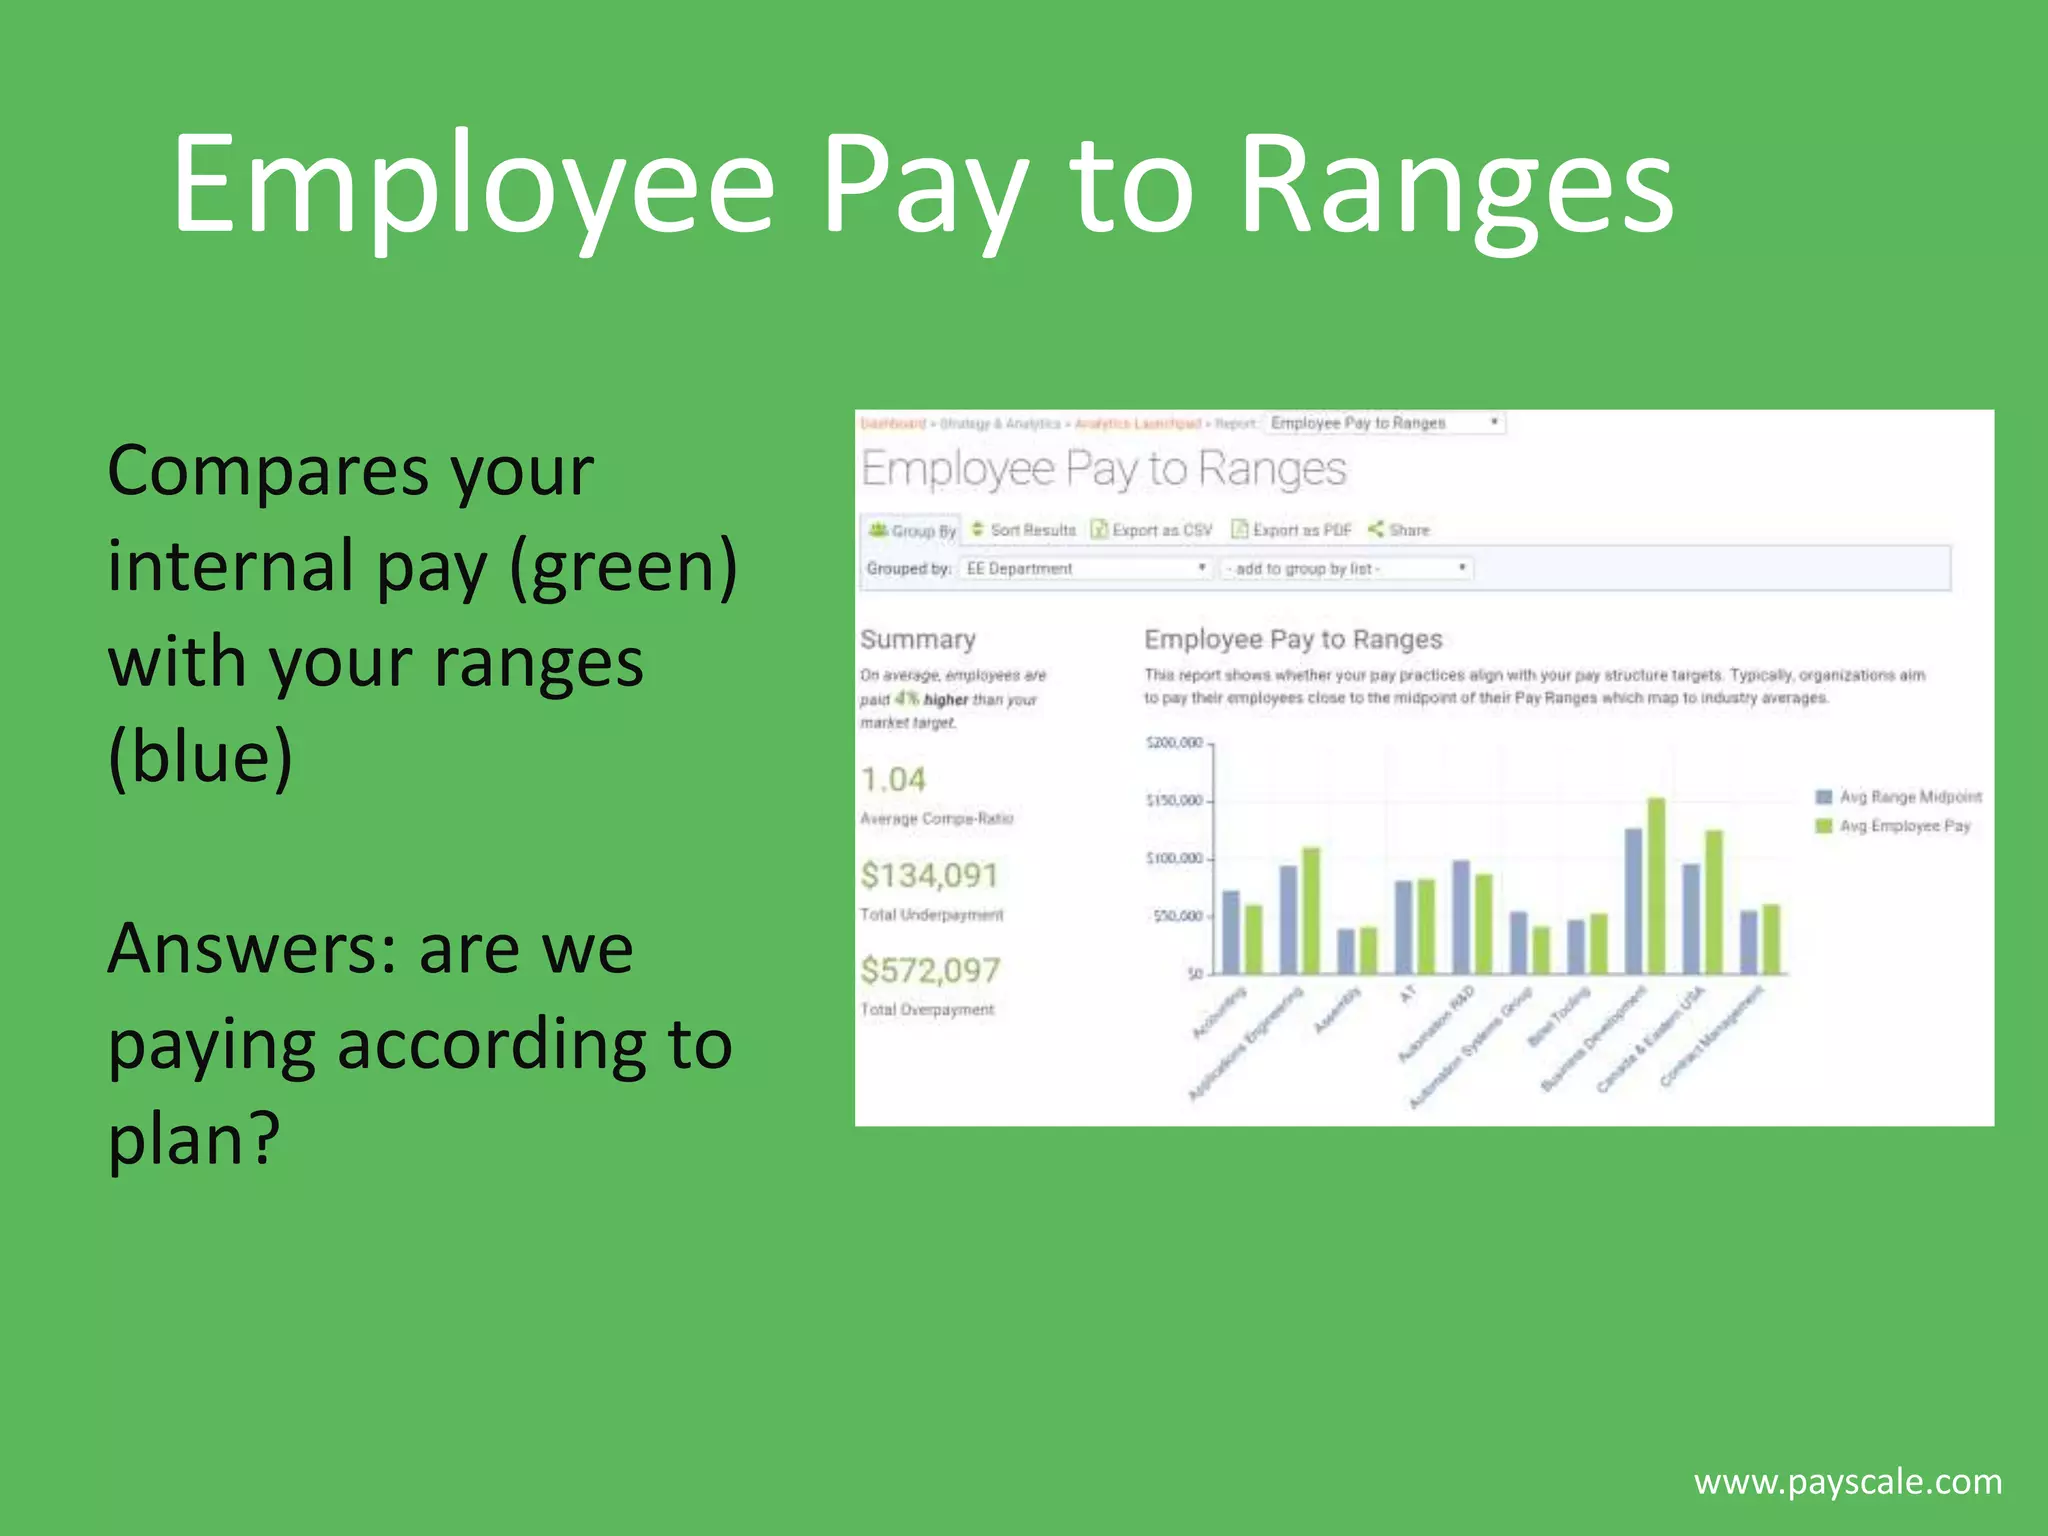
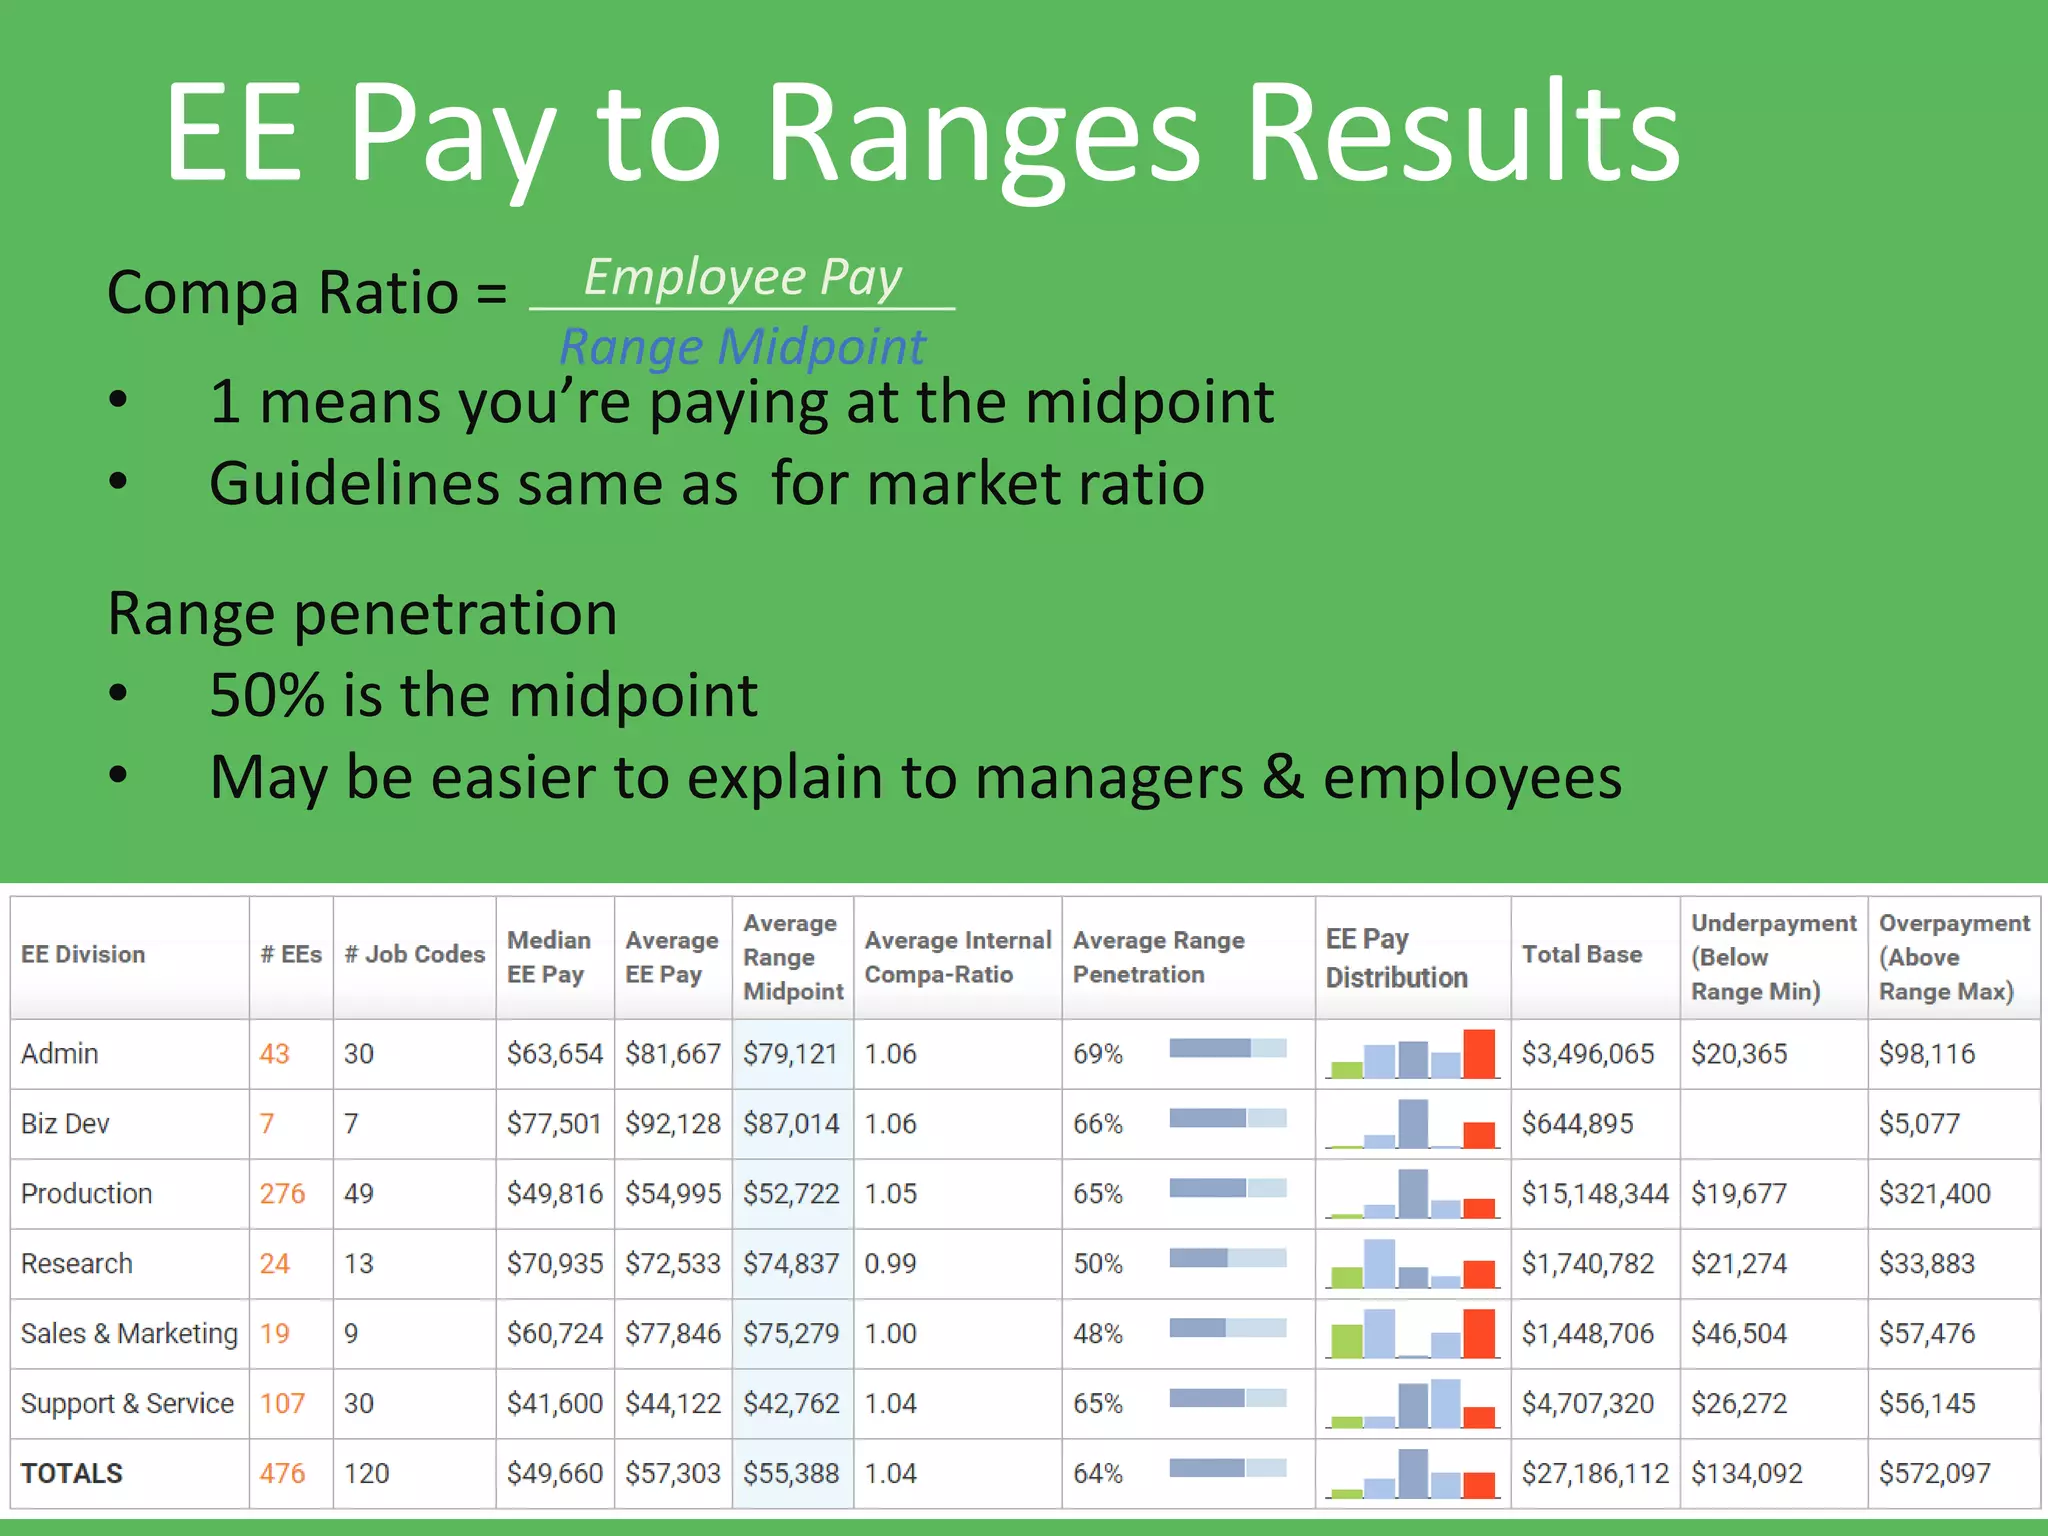
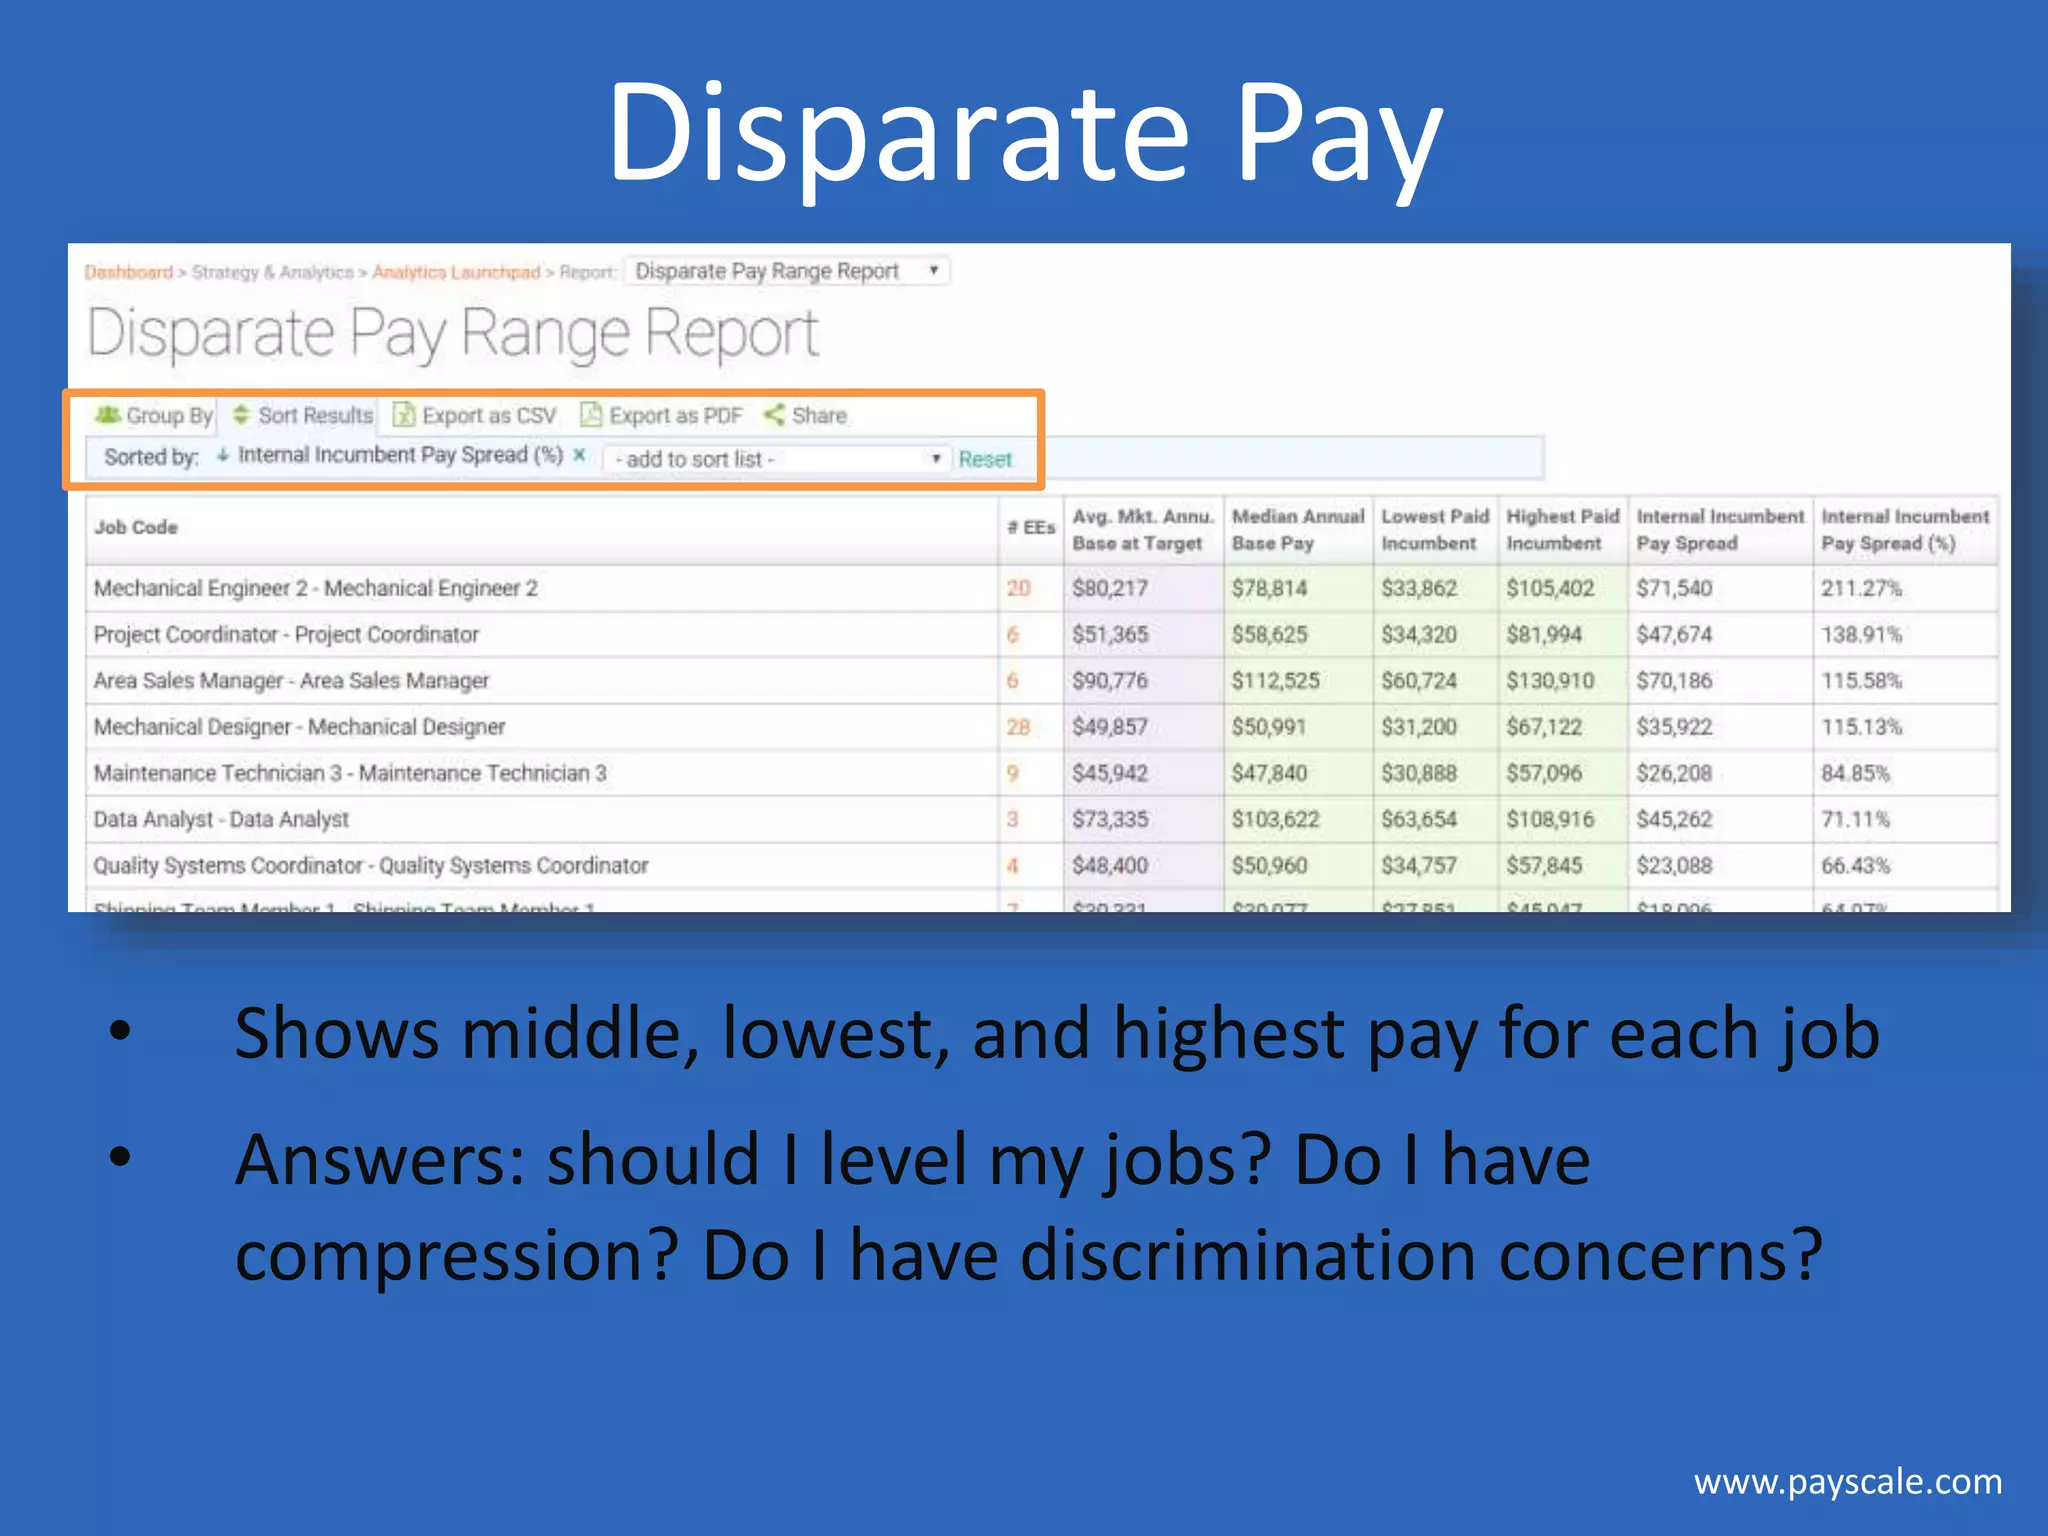
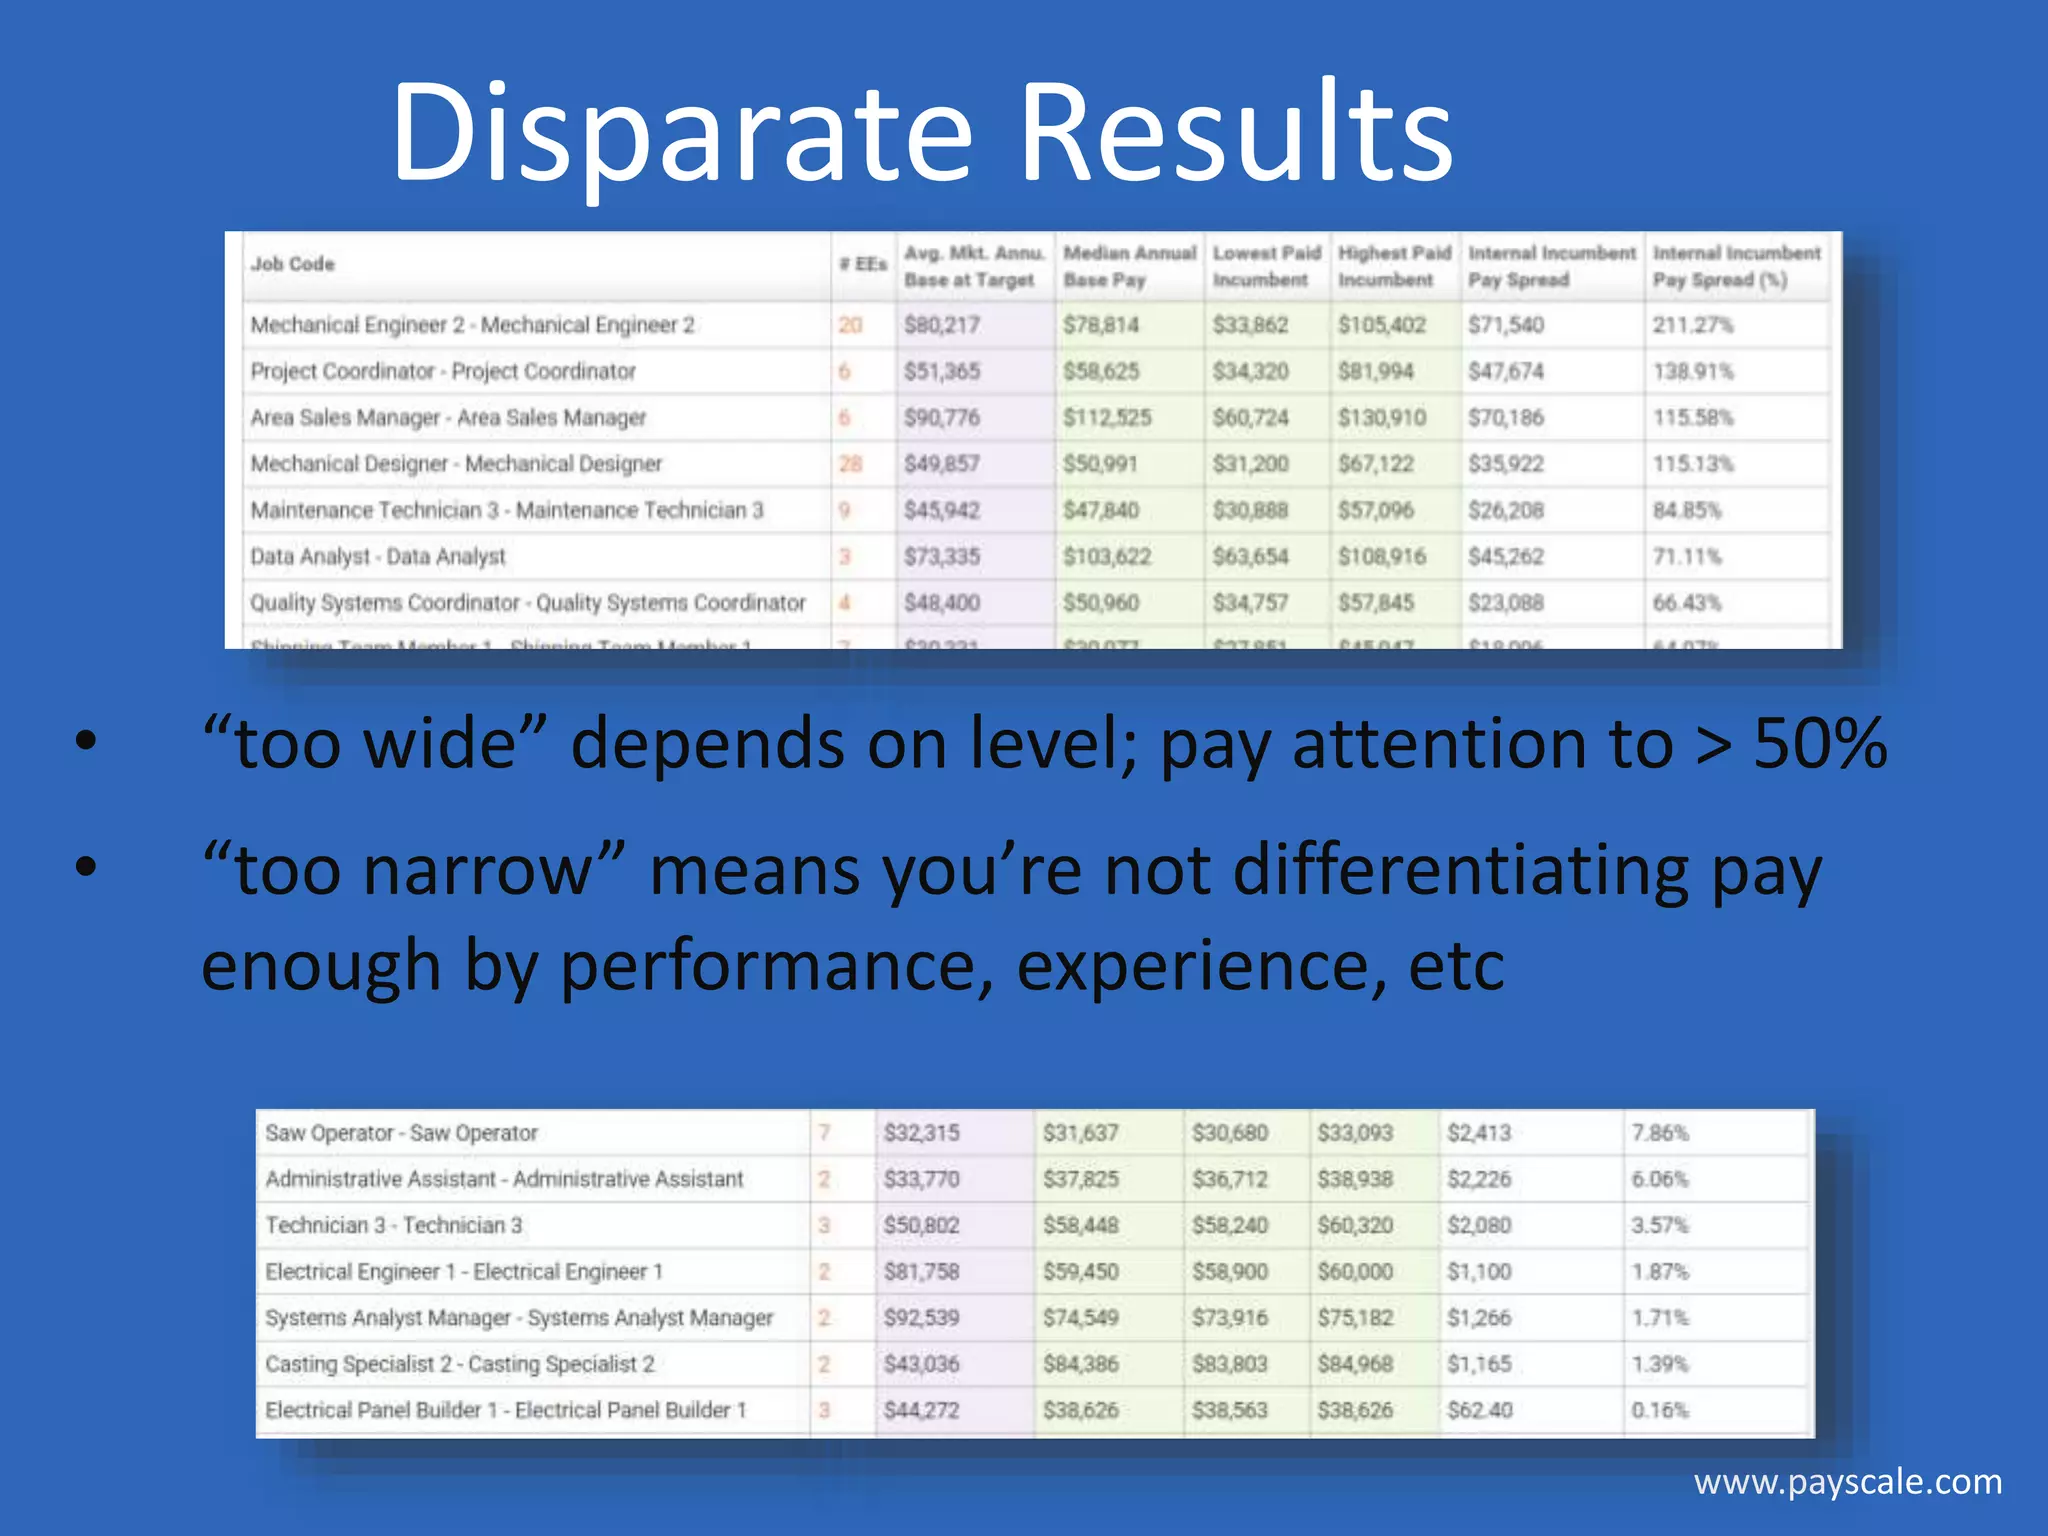
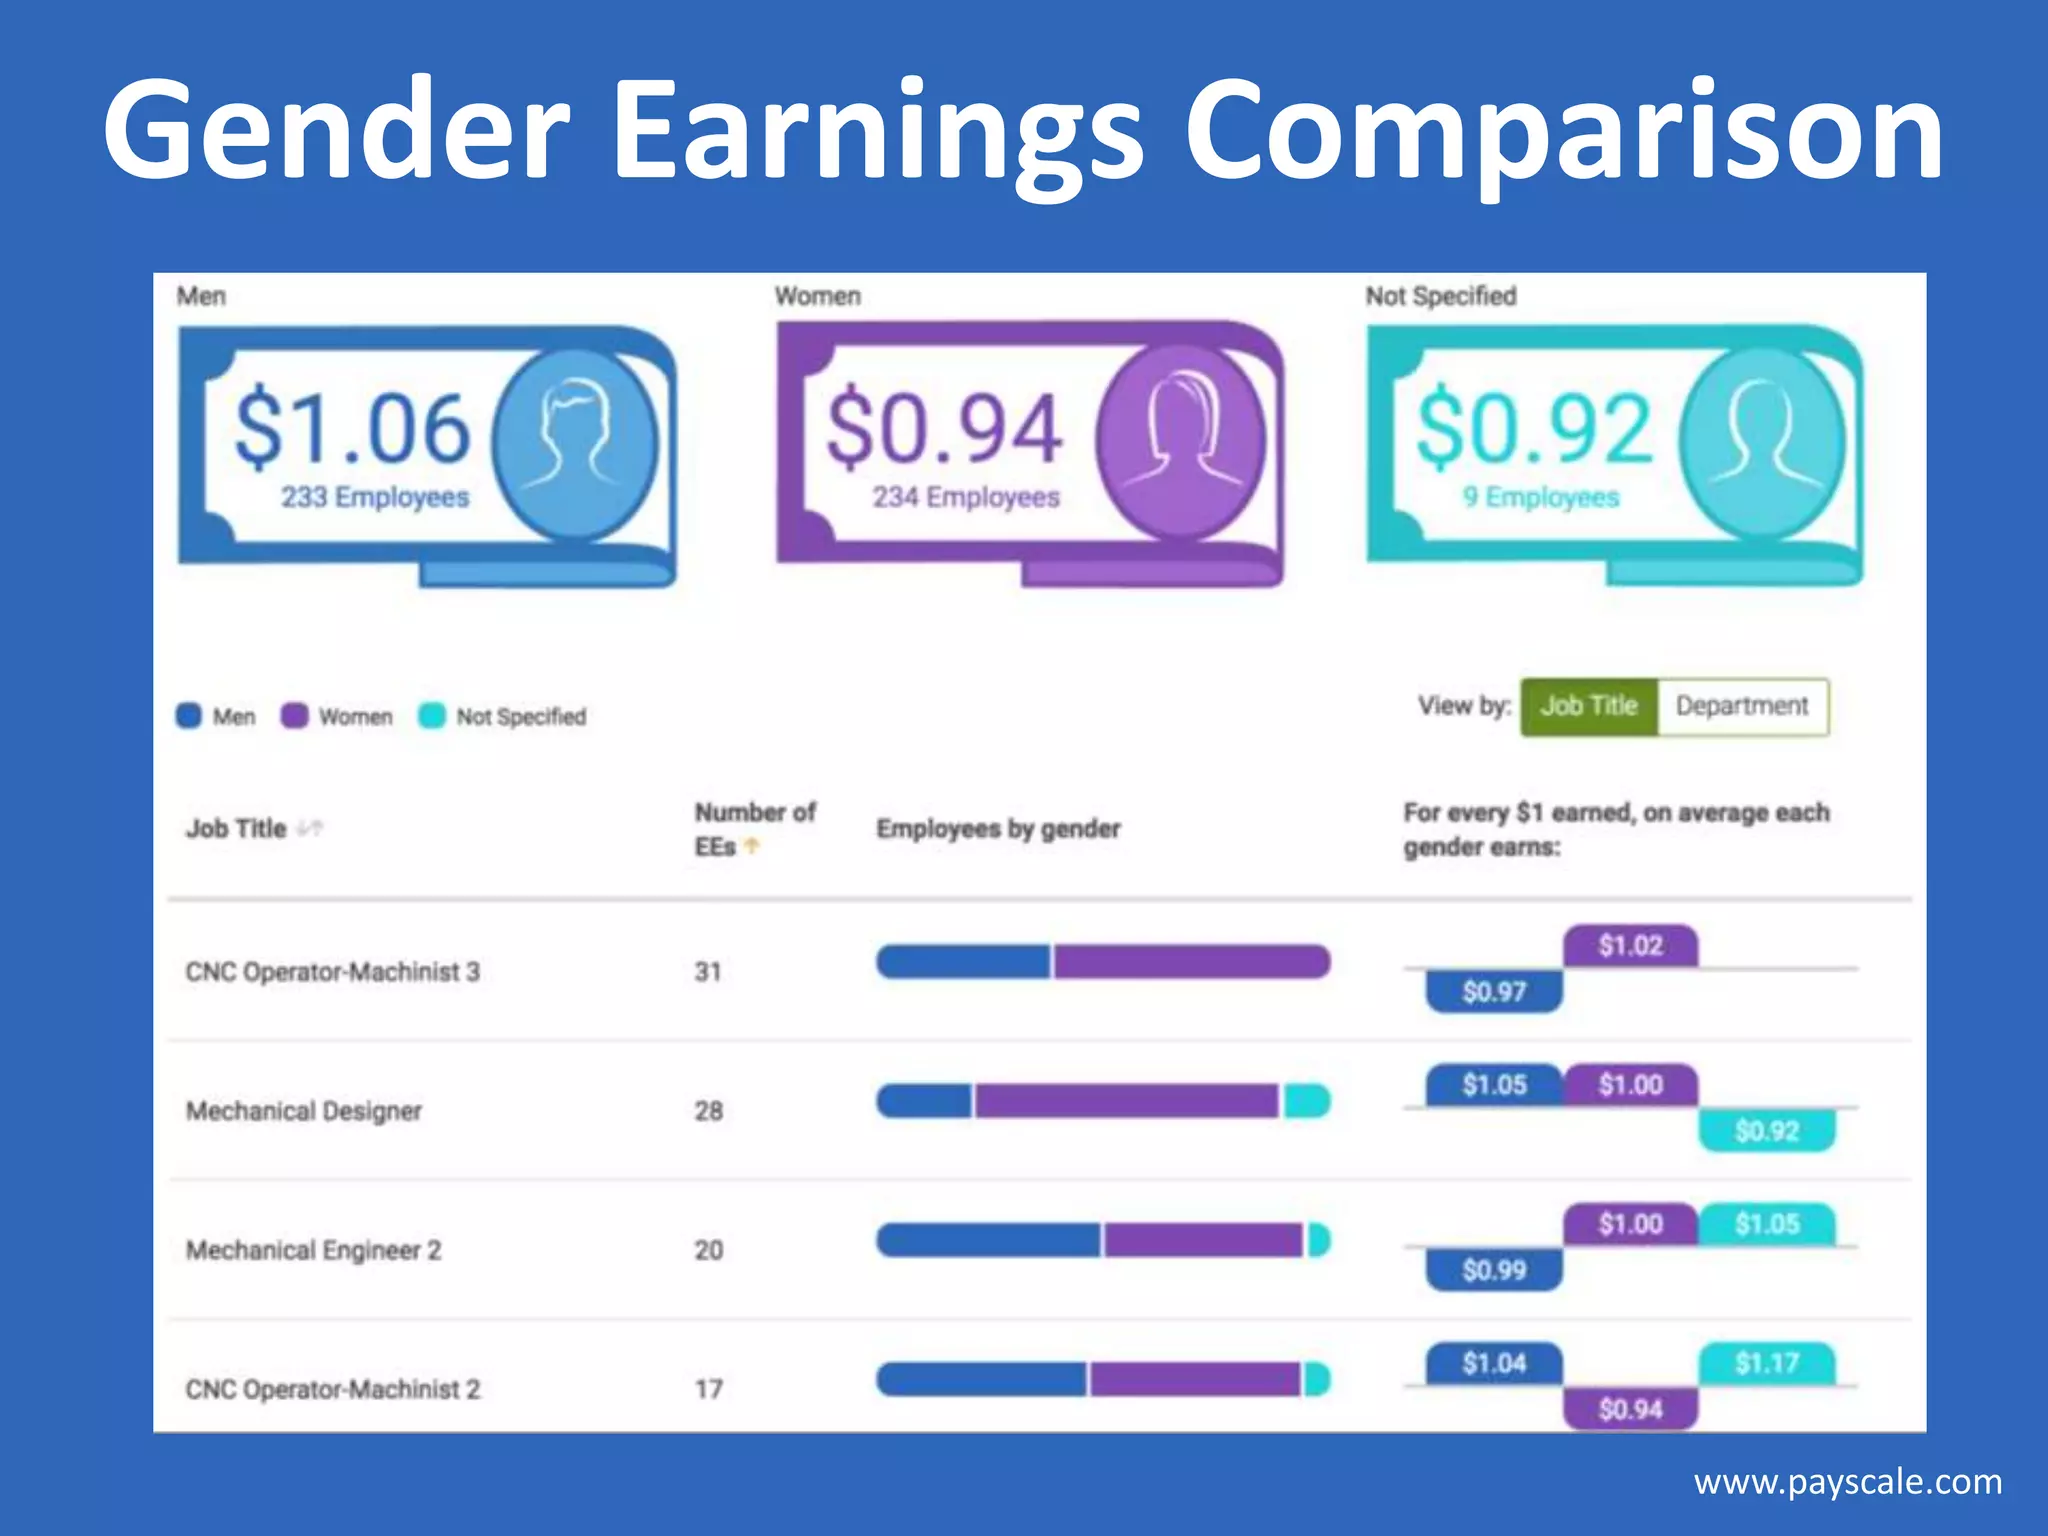
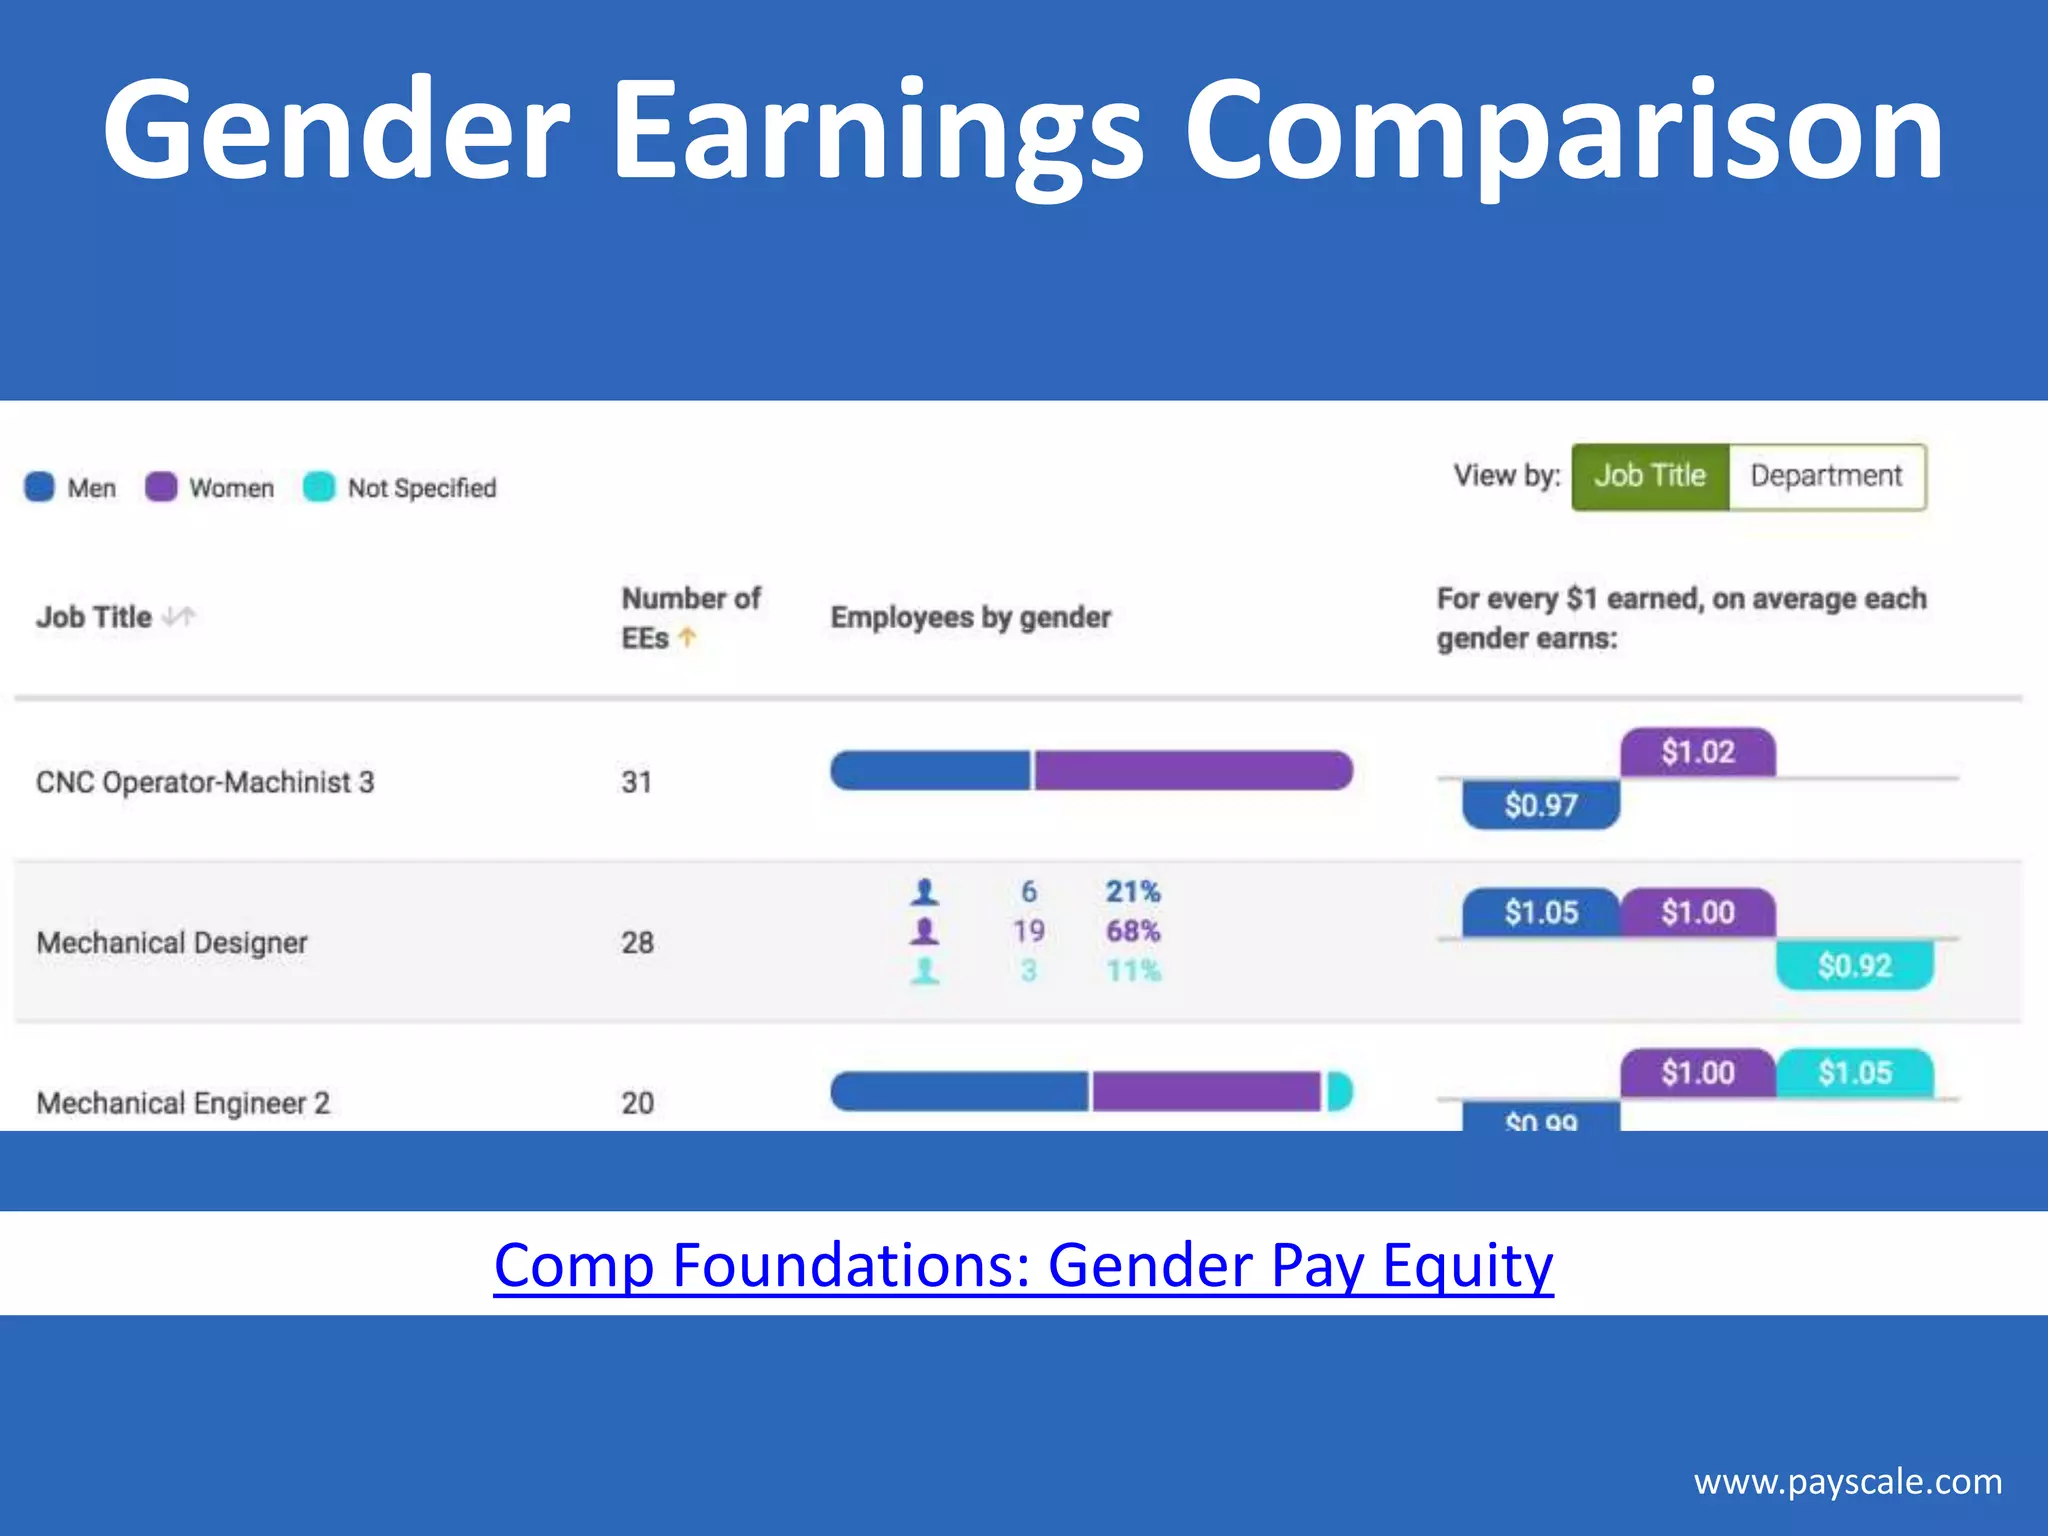


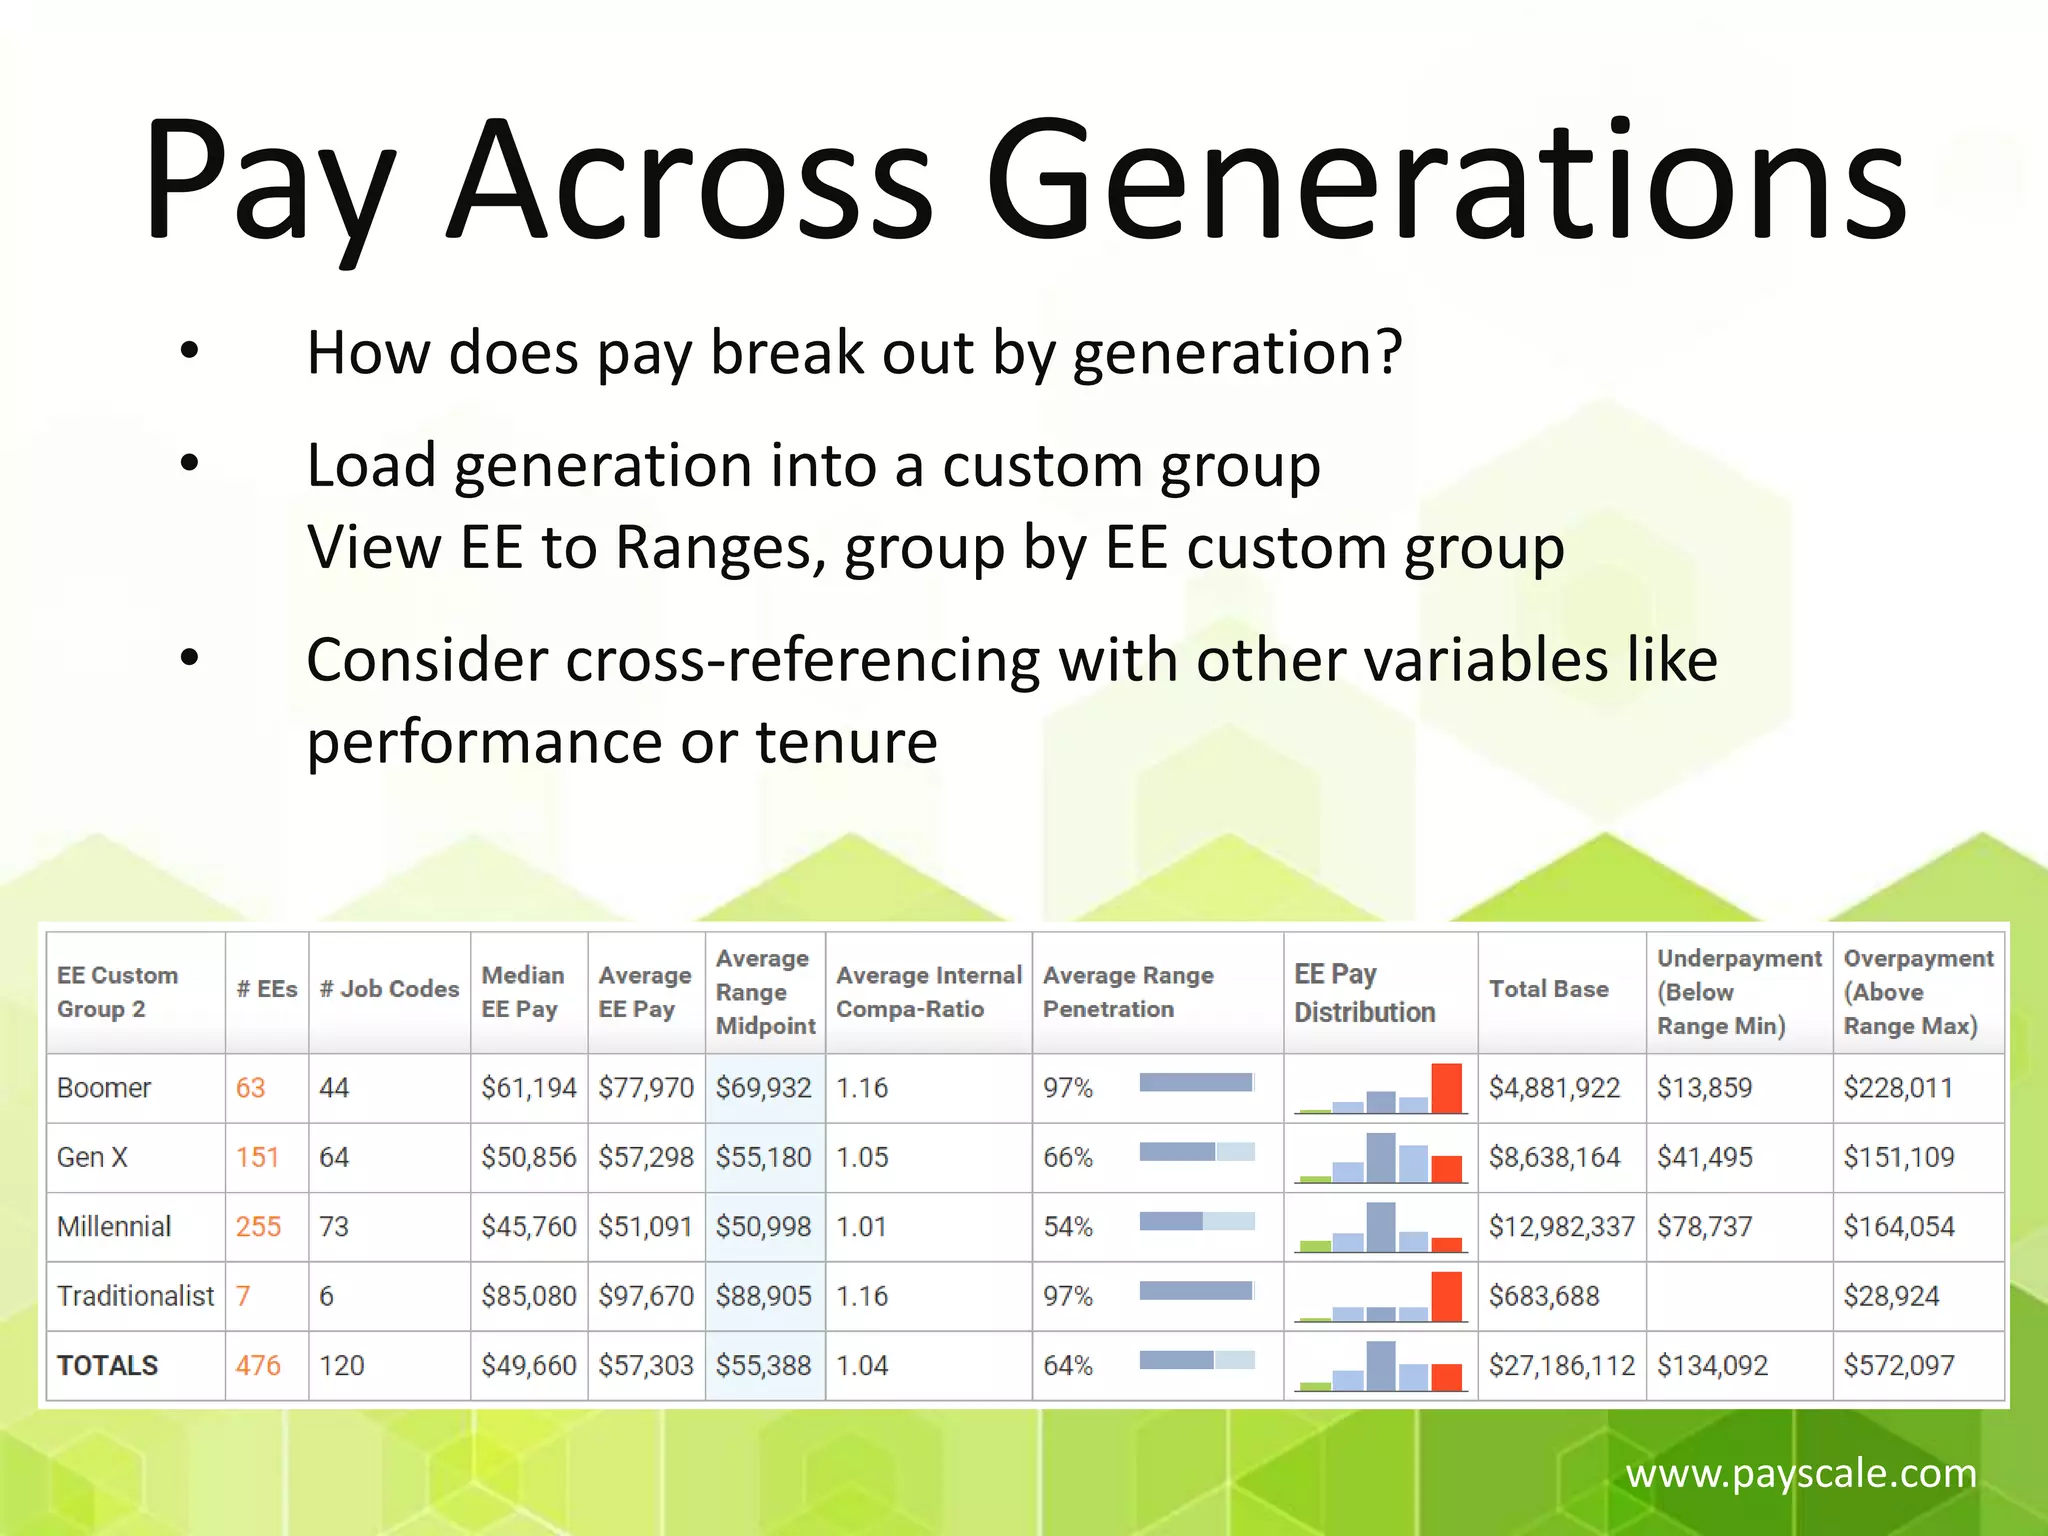

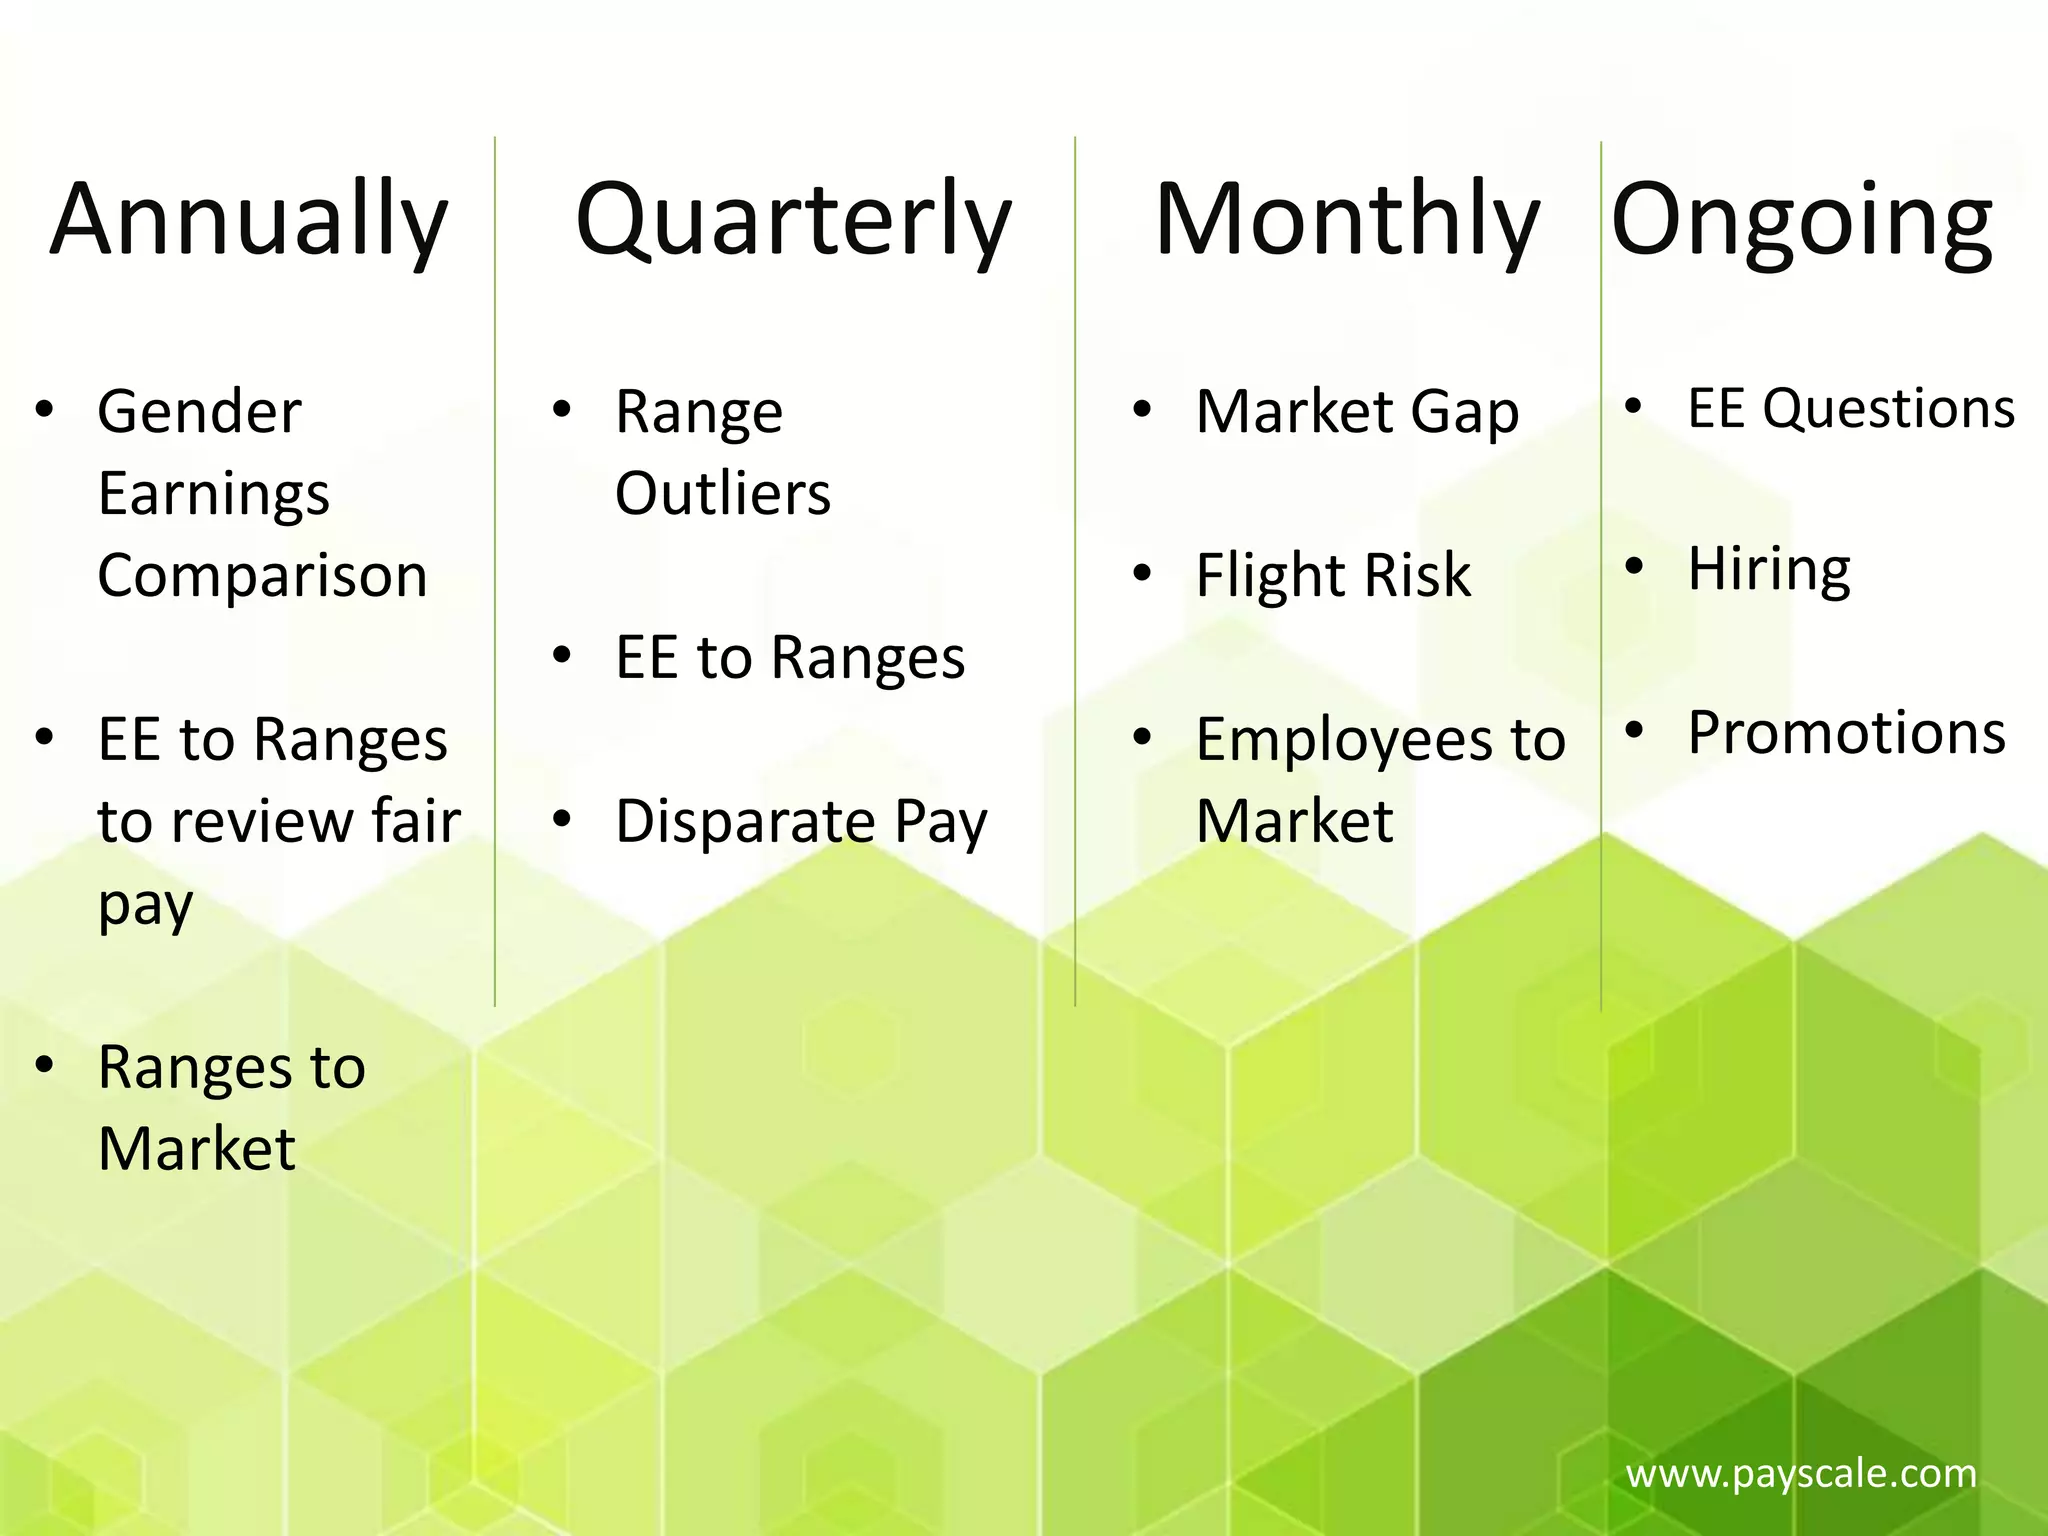

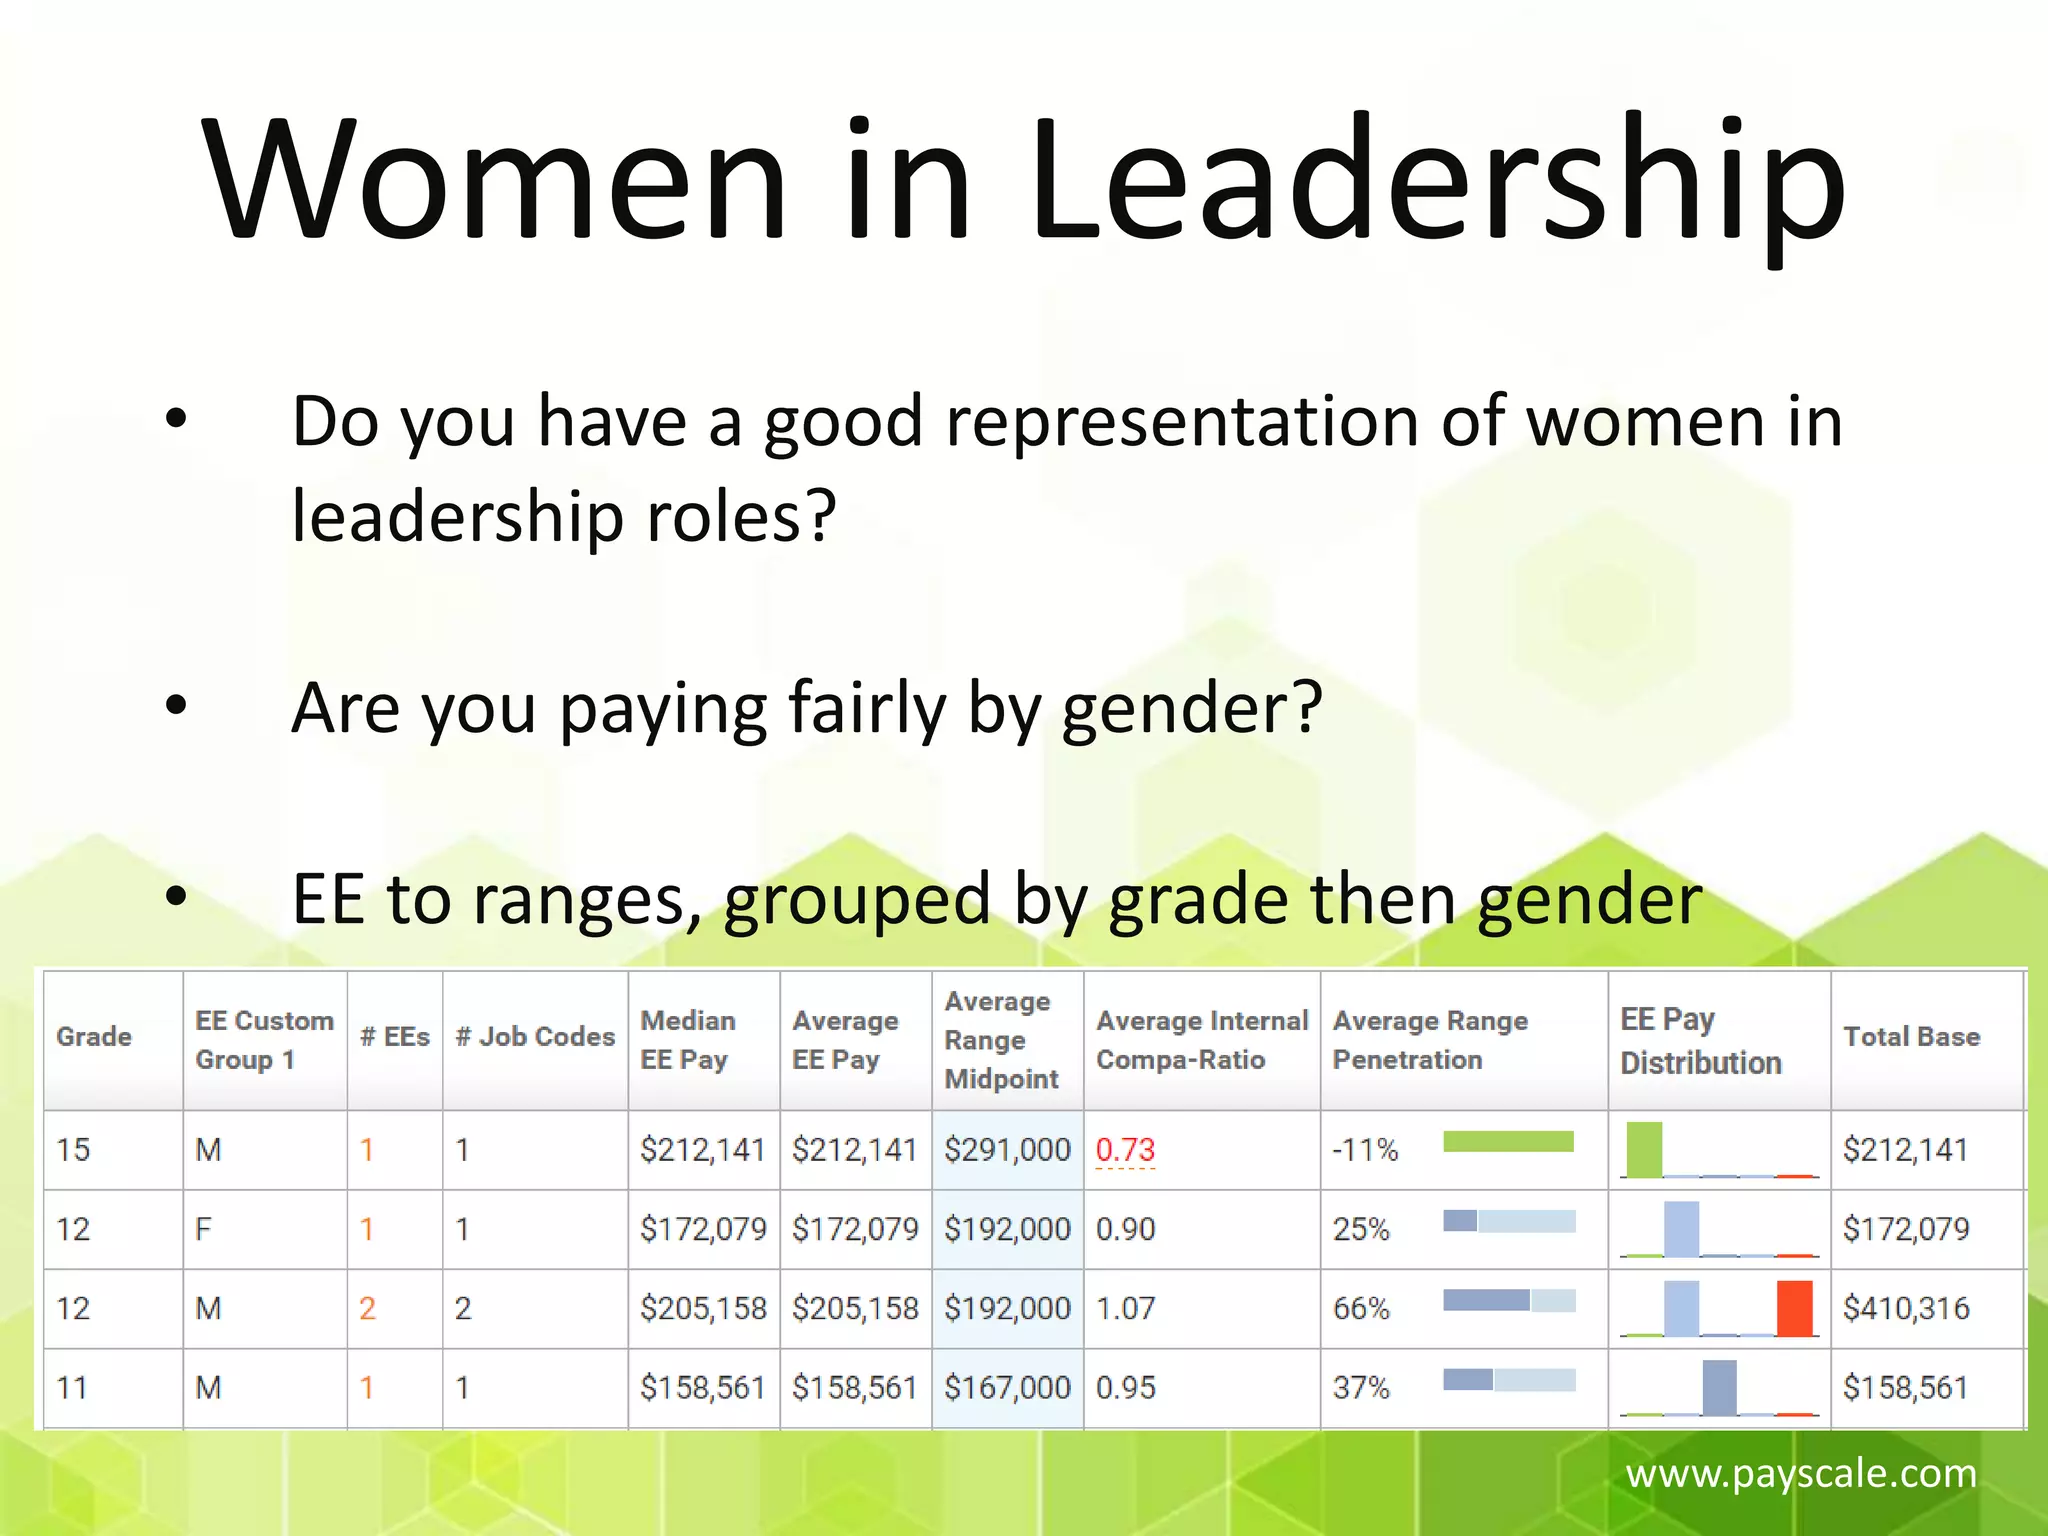
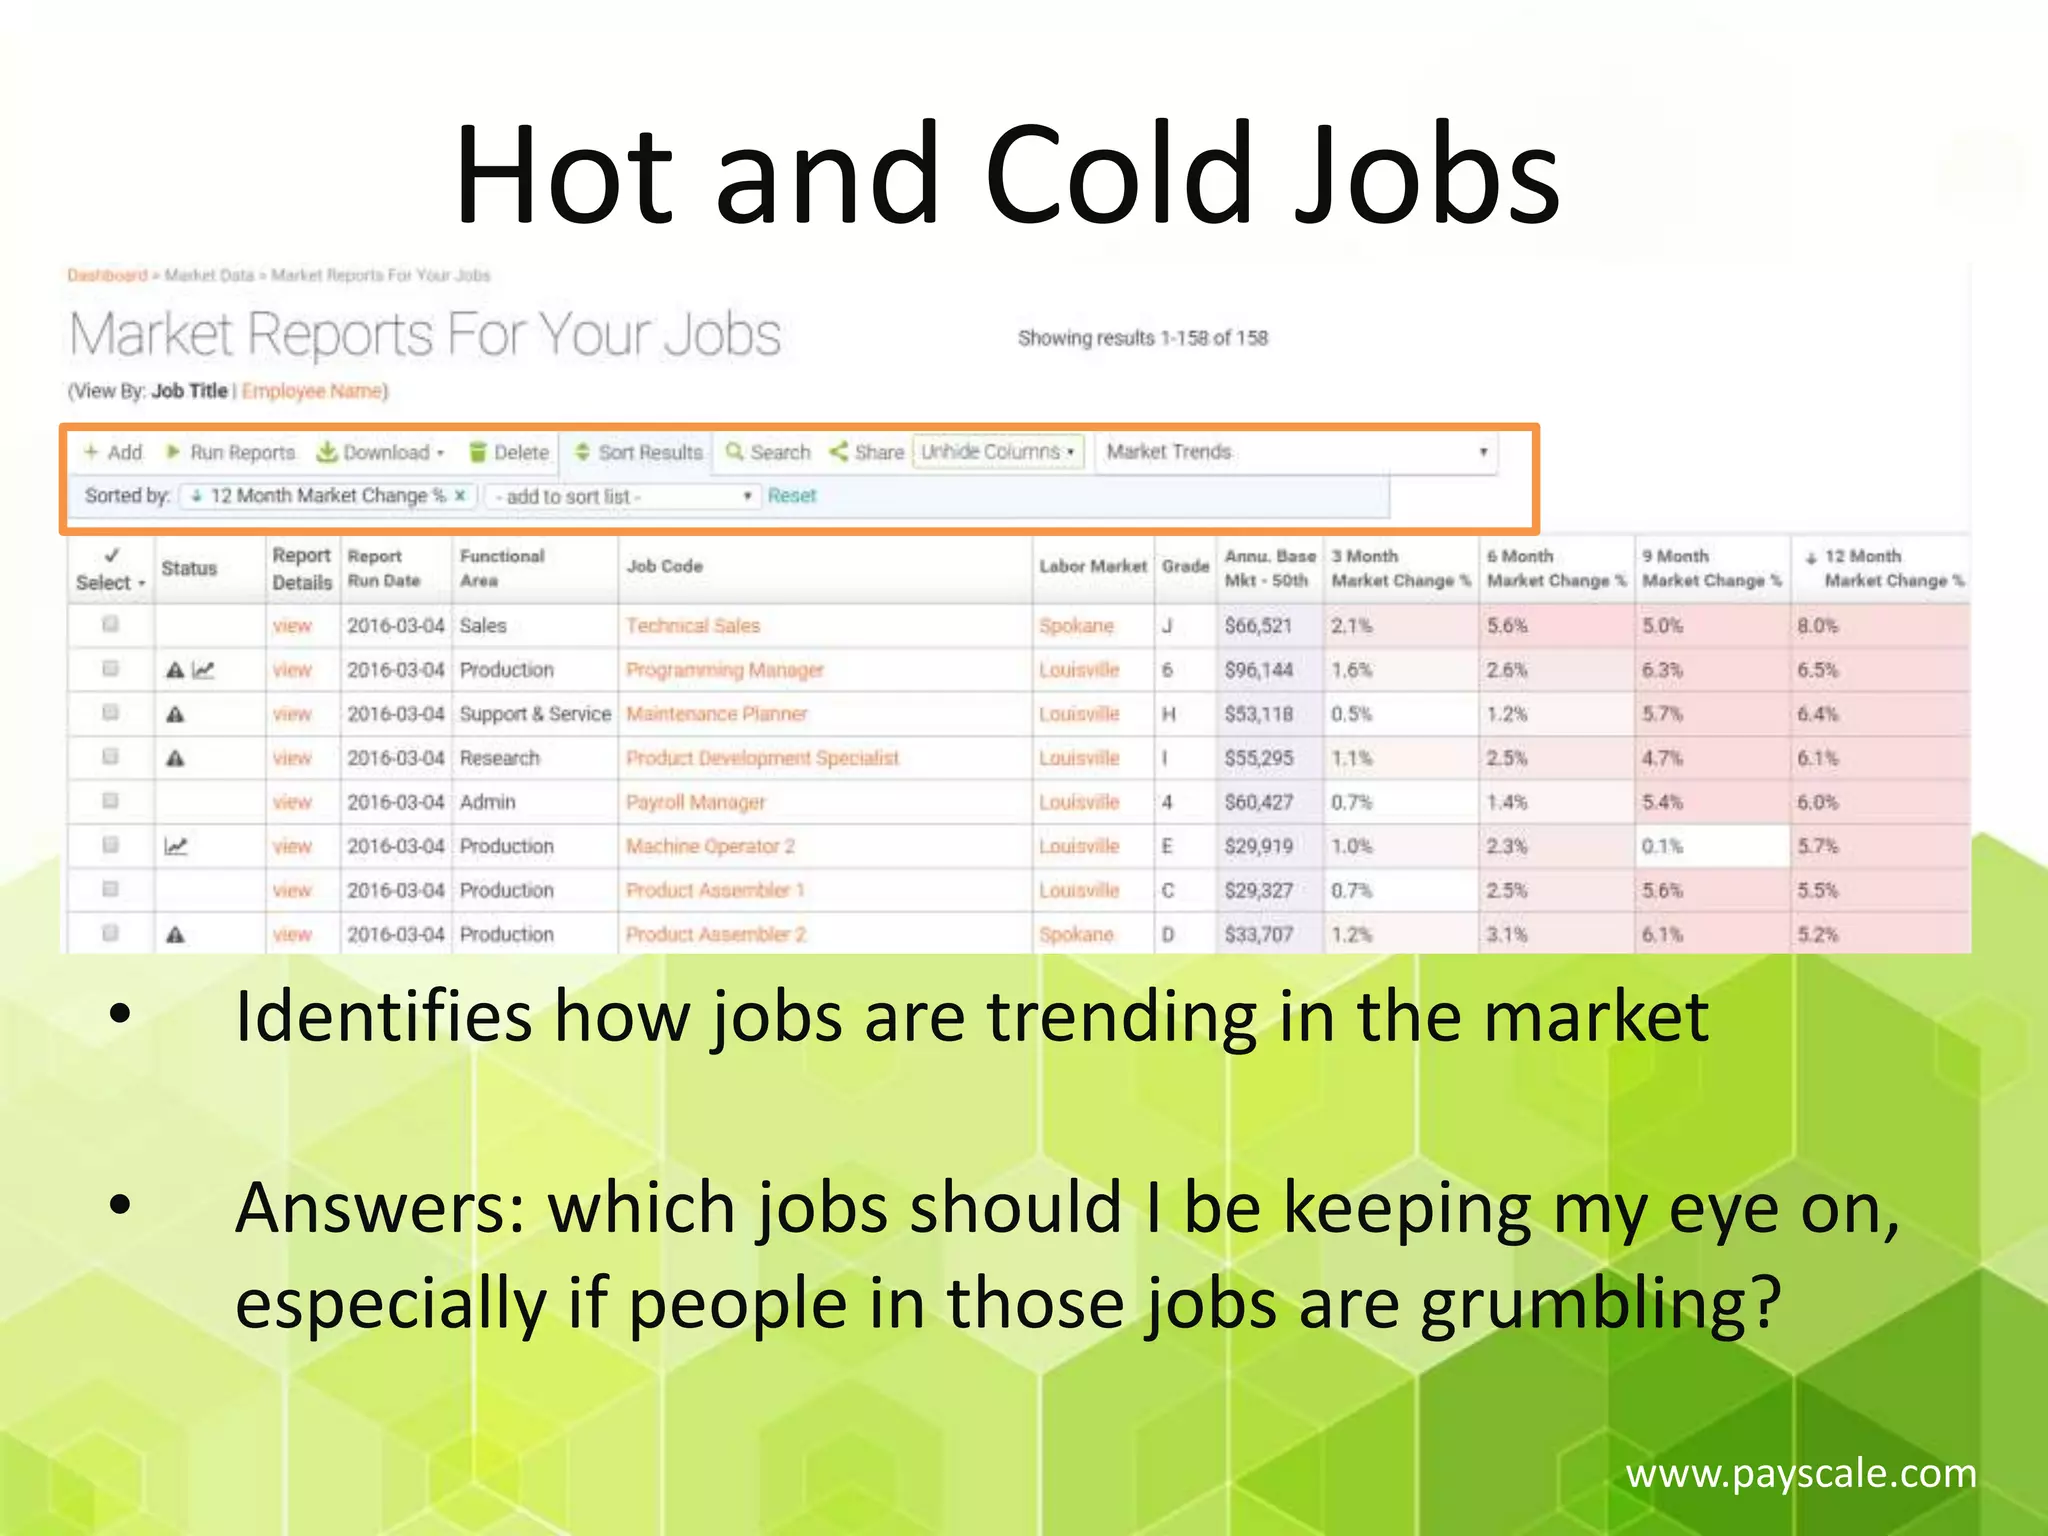

The document outlines the foundational aspects of analytics in compensation, emphasizing the importance of comparing internal pay to market rates and pay ranges. It discusses metrics like market gap, flight risk, disparate pay, and gender earnings comparisons to assist organizations in making data-driven compensation decisions. Tools for monitoring trends and employee performance are highlighted to ensure fair and competitive pay practices.