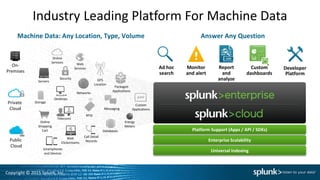
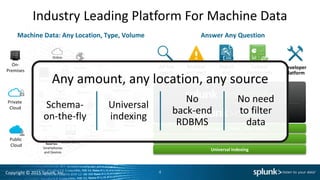
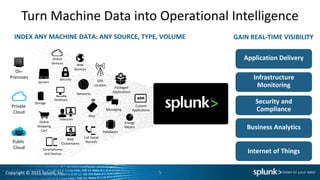
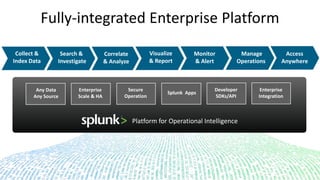
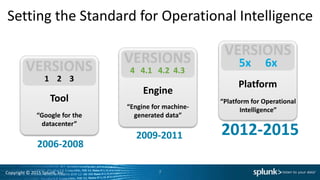
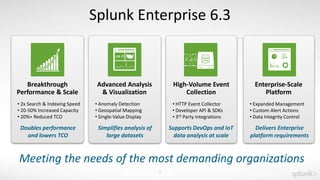
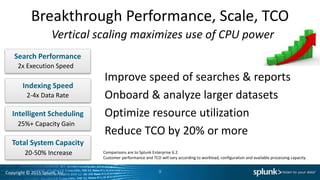
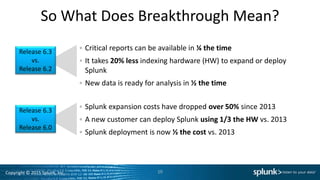
This document discusses a presentation about the new features of Splunk Enterprise 6.3. It highlights breakthrough performance and scale improvements including doubling search and indexing speed, increasing capacity by 20-50%, and reducing total cost of ownership by over 20%. It also mentions new capabilities for advanced analysis, visualization, high-volume event collection, and supporting enterprise-scale requirements. The presentation aims to demonstrate how Splunk Enterprise 6.3 provides significant performance gains and lower costs compared to previous versions.
Splunk Webinar – IT Operations auf den nächsten Level bringenSplunk
Verwertbare Einblicke in Ihre Daten gewinnen und IT Operations auf den nächsten Level bringen
In unserem Webinar zeigen wir Ihnen anhand einer Demo:
- wie Sie Service-Kontext gewinnen, in dem Sie Verhaltens- und Performance-Daten kombinieren.
- wie Sie ein genaues Bild Ihrer Umgebung erhalten, damit Sie Prozesse optimieren können
- wie Sie Kernursachen-Analysen beschleunigen und so Ausfälle auf Kundenseite entgegenwirken können
- wie Sie Incident Investigation priorisieren und die Time-to-Resolution durch Verhaltens- und Event-Analysen verkürzen
- wie Analytics und Machine Learning Service Intelliegence verbessern können
Exact is a Dutch software company that provides business management software. They implemented Splunk to gain operational visibility, business insights, proactive monitoring, and search/investigation capabilities across their infrastructure supporting 350,000 companies in 7 countries. Splunk helped Exact lower their resolution times by 75% and scale their infrastructure while keeping the same team size to support exponential growth of adding 250 new companies per day.
The document provides an overview of new features in Splunk Enterprise 6, including more powerful analytics capabilities for both technical and non-technical users. Key updates include an intuitive pivot interface that allows drag-and-drop report building without knowledge of the search language, defined data models to represent relationships in machine data, and an analytics store that can accelerate searches and reports up to 1000 times faster than previous versions. The release also includes simplified cluster management for large enterprise deployments and enhanced developer tools.
How to Design, Build and Map IT and Business Services in SplunkSplunk
Your IT department supports critical business functions, processes and products. You're most effective when your technology initiatives are closely aligned and measured with specific business objectives. This session covers best practices and techniques for designing and building an effective service model, using the domain knowledge of your experts and capturing and reporting on key metrics that everyone can understand.
Looking into 2020 and beyond, we are certainly going to continue this trend of strategic technology investment and architecture evolution. This session’s aim is to highlight Splunk platform evolutionary approach to address key technology trends. Additionally, many customers are adopting Serverless cloud services to deliver their cloud solutions. This session will include a live demo of a new library of functions which provides Google Cloud Platform (GCP) serverless “push” capability to send data into Splunk, via HTTP Event Collector (HEC).
This document discusses how KPN, the largest Dutch telecommunications provider, implemented Splunk Enterprise to gain operational intelligence across their infrastructure and improve service quality. They created a centralized data lake using Splunk to aggregate operational data from over 60 sources. This has provided insights to 250 active users through over 500 dashboards. Lessons learned include starting with a well-designed architecture and proof of concept. Future plans include expanding Splunk's scope across KPN and integrating with other tools. The top takeaway is to focus on quick wins to demonstrate Splunk's capabilities.
1) KPN is a major telecommunications company in the Netherlands that is undergoing an organizational change towards DevOps and SRE principles with the help of tools like Splunk.
2) Splunk helps reduce organizational silos by bringing together data from multiple teams to provide insights and dashboards. It also enables transparency and traceability.
3) Implementing changes gradually and getting engineers and business users on board with small, iterative steps is key to a successful adoption of Splunk and organizational change at KPN.
Splunk Enterprise 6.4 delivers a new library of interactive visualizations, faster analytics, and can reduce your historical data storage costs by up to 80%.
See how you can:
• Use new interactive visualizations to view results, and easily create and share your own
• Speed investigation and discovery of large-scale data with event sampling
• Reduce storage costs by up to 80% for aged data
• Get wider visibility into system performance and health with new management views
With the new features and lower storage costs offered by Splunk Enterprise 6.4, doing big data analysis is now easier than ever. See it in action by attending this webinar.
The Top 10 Glasstable Design Principles to Boost Your Career and Your BusinessSplunk
The document provides 10 principles for effective data visualization and dashboard design on glass tables. It discusses choosing the right visualization for different types of data, using colors and fonts effectively, following principles of visual hierarchy and proximity, leveraging diagrams and flows, and using alerts and a dramatic approach when needed. It also recommends starting with paper prototypes, using simple tools like PowerPoint, and following current design trends like flat and minimalist styles.
This document provides an agenda for a presentation on machine learning in action and how to derive meaningful business insights from data. The presentation will include an introduction to machine learning and anomaly detection theory. It will cover an anomaly detection use case from TalkTalk on detecting anomalies in broadband access. It will also cover a predictive analytics use case on predicting student outcomes. The presentation will conclude with a wrap up and Q&A section.
How to justify the economic value of your data investmentSplunk
This document discusses methods for calculating the return on investment (ROI) and other metrics to justify data investments. It provides an example of using an interactive value assessment to gather key metrics from a manufacturing customer, such as downtime hours and production units. The assessment then calculates the potential costs avoided and benefits realized, such as reduced downtime and faulty units, to determine the cost-benefit ratio and payback period of investing in data and Splunk technology. The document emphasizes that value assessments are one part of developing an overall data strategy and roadmap to optimize investments for the future.
Virtual SplunkLive! for Higher Education Overview/CustomersSplunk
The document outlines the agenda for a virtual SplunkLive! event for higher education on January 28, 2015. It includes an overview of Splunk, presentations from various universities on their Splunk implementations, and breakout sessions on getting started with Splunk, security, and IT operations. It also provides information on Splunk products and capabilities for IT operations, security, application delivery, business analytics, industrial data, and the Internet of Things.
Splunk: How to Design, Build and Map IT ServicesSplunk
This document discusses how to design, build, and map IT and business services in Splunk to gain "service intelligence." It describes a methodology for bringing subject matter experts together to design services top-down before configuration. Specifically, it discusses deconstructing a company's supply chain, online store, and ERP systems into a service map to gain insights on key performance indicators and improve issue resolution, efficiency, and customer satisfaction.
The document discusses Splunk Incident Response, orchestration and automation capabilities. It notes that incident response currently takes significant time, from months for detection to days for containment and remediation. Splunk aims to accelerate this process through automation, orchestration and its security operations platform to integrate tools, streamline workflows and automate repetitive tasks. The presentation demonstrates Splunk's Phantom security orchestration product and how it can automate security tasks like malware investigations to reduce response times.
SplunkLive! London 2019: Paddy Power Betfair Splunk
Splunk handles 13TB of daily data ingest for Paddy Power Betfair to power various use cases. It was chosen for its ability to scale easily with their growth. Some key uses include fraud detection, customer service issue monitoring, and capacity management of their private cloud. On their busiest days like Grand National, Splunk ensures zero latency which is critical for revenue and reputation.
Leveraging Splunk Enterprise Security with the MITRE’s ATT&CK FrameworkSplunk
Threat Models and Methodologies such as MITRE’s ATT&CK knowledge base are growing in popularity to help track adversaries and map Tactics, Techniques and Procedures (TTP’s) to build and measure security defence profiles. This session will provide an introduction to MITRE’s ATT&CK Methodology and show how Splunk Enterprise Security (ES) and Splunk content updates can help you leverage MITRE ATT&CK in your defensive strategies.
Worst Splunk practices...and how to fix them Splunk
This document provides a summary of best practices and common pitfalls when using Splunk for data collection, management, and resiliency. It discusses best practices for collecting syslog data over UDP, direct TCP/UDP collection, load balancing with forwarders, and data onboarding practices like specifying sourcetypes and timestamps. Common mistakes involve over-engineering syslog collection, sending TCP/UDP streams directly to indexers without load balancing, relying too heavily on intermediate forwarders, and not explicitly configuring sourcetype and timestamp settings. The presentation aims to help Splunk administrators and knowledge managers address common problems and apply optimization strategies.
The volume and complexities of today’s security incidents can tax even the largest security teams. This leaves big gaps in incident detection and response workflows that can put organisations at great risk. Your team can’t scale to manually catch and address every incident, so which ones should you focus on and which ones should you ignore? You shouldn’t be forced to make a choice. In this session, find out how Splunk’s SIEM and SOAR technologies deliver security analytics, machine learning, and automation capabilities to increase the efficiency of security teams and reduce the enterprise’s exposure to risk. Learn how to achieve big results from intelligently streamlined incident detection and response workflows—accelerating your actions, scaling your resources, and optimizing your security operations.
This document provides a summary of new features and enhancements in Splunk Enterprise & Cloud version 6.3. Key highlights include improved performance and scale through search and index parallelization, intelligent job scheduling, expanded support for DevOps and IoT through the new HTTP Event Collector, and enhanced analytics and visualization capabilities such as anomaly detection and geospatial mapping. The documentation was also redesigned to be more user-friendly.
Splunk Cloud and Splunk Enterprise 7.2 provide enhanced capabilities for data ingestion, visualization, and analytics powered by artificial intelligence and machine learning. New features include guided data onboarding, metrics search performance improvements, smart data tiering for cost optimization, and accessibility enhancements. These updates aim to empower more users and accelerate business value from machine learning.
The DevOps Promise: Helping Management Realise the Quality, Velocity & Effici...Splunk
This document discusses how Splunk can provide analytics across the DevOps lifecycle to help organizations realize quality, velocity, and efficiency gains from continuous integration and continuous delivery (CI/CD). It provides examples of metrics and events that can be collected at each phase of the lifecycle to help stakeholders like development, operations, security, and business teams. The document demonstrates Splunk's ability to integrate different machine data sources for comprehensive visibility. It also briefly outlines some Splunk apps that can support DevOps processes and tools.
This document provides an overview of how Garmin International uses Splunk to monitor and analyze machine data. It introduces Tyler Rutschman, a Linux systems administrator at Garmin, and describes how Garmin started using Splunk in 2009 to help with Sarbanes-Oxley compliance. Splunk has provided benefits like reduced mean time to resolution, better reporting capabilities, cost savings, and improved compliance. The implementation collects up to 150 GB of data per day from sources like servers, databases, and load balancers. Future plans include indexer upgrades and adding more Garmin application data to Splunk.
SplunkLive! Stockholm 2019 - Customer presentation: Norlys Splunk
This document summarizes a presentation about using Splunk Phantom for incident response. It discusses how the presenter's organization built log analytics and incident response capabilities from scratch using Splunk and Phantom. They automated repetitive tasks, integrated various tools, and created documentation and playbooks for investigation processes. Examples of use cases at the organization include server containment workflows, uploading files to malware sandboxes, and remotely capturing endpoint memory dumps. The presentation concludes with recommendations for getting started with Phantom and news from Splunk's recent .conf event.
Splunk Webinar Best Practices für Incident InvestigationGeorg Knon
The document discusses best practices for incident investigation using Splunk, including collecting data from various sources like network traffic, endpoints, user activity, and threat intelligence. Effective investigation requires visibility into who and what communicated on the network, running processes, file system changes, and privileged access on endpoints. The goal is to quickly scope infections and disrupt breaches by understanding attack intent, lateral movement, and exfiltration through correlation of different data sources.
The document discusses observability in microservices and provides an overview of key concepts. It introduces One Concern, which monitors buildings and natural disasters, and describes the differences between monoliths and microservices. It then covers the three pillars of observability - monitoring, logging, and tracing - and provides examples of tools for each. The rest of the document focuses on Jaeger, describing its architecture, benefits, features, terminology, and includes a demo. It concludes by mentioning One Concern is hiring.
Accelerate incident Response Using Orchestration and Automation Splunk
This document discusses how orchestration and automation can accelerate incident response. It notes that incident response currently takes a significant amount of time, with the majority of time spent on containment and remediation. It also states that most organizations use too many security tools that are not integrated. The document promotes the use of security orchestration and automation response (SOAR) to help coordinate security actions across tools. It describes Splunk's security portfolio including the Splunk Phantom product, which allows users to automate repetitive tasks, execute automated actions quickly, and coordinate complex workflows to strengthen defenses and accelerate incident response.
SplunkLive! Stockholm 2015 breakout - Splunk IT Service IntelligenceSplunk
Splunk's new Premium App offering, Splunk IT Service Intelligence, is full of exciting new features and functionality to enable the data-driven enterprise to monitor, alert on, and visualize these services in several new ways, including flexible free-form dashboards called "Glass Tables." Join us in this session to explore the versatility of the Glass Tables feature, discuss best practices around creating valuable and compelling Glass Tables for IT operations and business users, and inspect several examples of purpose-built Glass Tables.
SplunkLive! Splunk Enterprise 6.3 - Data On-boardingSplunk
This document discusses Splunk Enterprise 6.3, a platform for machine data that provides breakthrough performance, scale, and total cost of ownership reductions. Key features highlighted include doubling search and indexing speed, increasing capacity by 20-50%, and reducing TCO by over 20%. Advanced analysis and visualization capabilities are improved, along with support for high-volume event collection, enterprise-scale requirements, and development tools. Demo apps showcase custom visualizations and machine learning functionality.
An overview of Splunk Enterprise 6.3. Presented by Splunk's Jim Viegas at GTRI's Splunk Tech Day, December 8, 2015.
Visit http://www.gtri.com/ for more information.
Here’s your chance to get hands-on with Splunk for the first time! Bring your modern Mac, Windows, or Linux laptop and we’ll go through a simple install of Splunk. Then, we’ll load some sample data, and see Splunk in action – we’ll cover searching, pivot, reporting, alerting, and dashboard creation. At the end of this session you’ll have a hands-on understanding of the pieces that make up the Splunk Platform, how it works, and how it fits in the landscape of Big Data. You’ll experience practical examples that differentiate Splunk while demonstrating how to gain quick time to value.
This document discusses how Splunk provides new visibility and analytics for IT operations. It notes that IT environments are becoming increasingly complex with more servers, applications, virtualization, and cloud services. Splunk offers a platform for operational intelligence that can consolidate machine data from various sources and provide search, monitoring, and analytics capabilities. It also discusses how Splunk apps can provide deep insights into specific technology areas.
Splunk for Industrial Data and the Internet of Thingsaliciasyc
The IoT is a natural evolution of the world’s networks. Just as people became more connected by devices and applications during the explosion of the social media revolution, devices, sensors and industrial equipment are also becoming more connected—and are consuming and generating data at an unprecedented pace. Disparate and deployed connected devices can provide a unique touchpoint to real-world operations and conditions. Only few architectures and applications are designed to handle the constant streams of real-time events, sensor readings, user interactions and application data produced by massive numbers of connected devices. Use Splunk to collect, index and harness the power of the machine data generated by connected devices and machines deployed on your local network or around the world.
Getting Started with Splunk Enterprise Hands-OnSplunk
Here’s your chance to get hands-on with Splunk for the first time! Bring your modern Mac, Windows, or Linux laptop and we’ll go through a simple install of Splunk. Then, we’ll load some sample data, and see Splunk in action – we’ll cover searching, pivot, reporting, alerting, and dashboard creation. At the end of this session, you’ll have a hands-on understanding of the pieces that make up the Splunk Platform, how it works, and how it fits in the landscape of Big Data. You’ll experience practical examples that differentiate Splunk while demonstrating how to gain quick time to value.
Splunk Internet of Things Roundtable 2015Georg Knon
This document contains an agenda and presentation materials for an Internet of Things Day event by Splunk. The presentation provides an overview of Splunk as a company, its machine data platform for collecting and analyzing data from IoT devices, and use cases from customers across various industries utilizing Splunk for IoT applications. Examples include using machine data from manufacturing equipment to optimize energy usage and enable predictive maintenance, and aggregating data from vending machines for diagnostics and insights into customer behavior.
The document provides an overview of Splunk IT Service Intelligence (ITSI). Some key points:
- ITSI makes Splunk "service-aware" and provides insights into IT services to help accelerate customers' path to operational intelligence.
- ITSI provides search-based KPIs, full-fidelity service health monitoring, and leverages Splunk's universal data platform to provide a data-driven approach.
- Core concepts in ITSI include services, KPIs, health scores, service analyzers for monitoring services, glass tables dashboards, and deep dives for investigation.
- Notable events are also generated by correlation searches to indicate service degradation.
What is Splunk? At the end of this session you’ll have a high-level understanding of the pieces that make up the Splunk Platform, how it works, and how it fits in the landscape of Big Data. You’ll see practical examples that differentiate Splunk while demonstrating how to gain quick time to value.
This summary provides an overview of a presentation about Splunk:
1. The presentation introduces Splunk, an enterprise software platform that allows users to search, monitor, and analyze machine-generated big data for security, IT and business operations.
2. Key components of Splunk include universal forwarders for data collection, indexers for data storage and search heads for data visualization. Splunk supports data ingestion from various sources like servers, databases, applications and sensors.
3. A demo section shows how to install Splunk, ingest sample data, perform searches, set up alerts and reports. It also covers dynamic field extraction, the search command language and Splunk applications.
SplunkLive! Amsterdam 2015 Breakout - Getting Started with SplunkSplunk
Filip Wijnholds is a senior sales engineer at Splunk who joined the company in June 2015 after working at Intel Security for 4 years. He began his career in the networking industry working with packet capture software. The document provides an overview of Splunk's machine data platform and how it can ingest and analyze data from various sources. It also outlines the company's legal notices regarding forward-looking statements and product roadmaps.
Getting Started with Splunk Enterprise Hands-OnSplunk
Here’s your chance to get hands-on with Splunk for the first time! Bring your laptop, and we’ll go through a simple install of Splunk. Then we’ll load some sample data, and see Splunk in action. At the end of this session you’ll have a hands-on understanding of the pieces that make up the Splunk Platform, how it works, and how it fits in the landscape of Big Data. We’ll share practical examples that differentiate Splunk while demonstrating how to gain quick time to value.
Splunk Webinar: IT Operations Demo für Troubleshooting & DashboardingGeorg Knon
This document provides an overview of Splunk's IT operations software. It discusses the challenges facing IT operations, including siloed tools and reactive problem solving. It presents Splunk as a solution, with its ability to index and analyze machine data from any source in real-time. Key benefits highlighted include faster troubleshooting to reduce downtime, proactive monitoring to address issues before they become problems, and increased operational visibility across the IT environment. The document concludes with a demonstration of Splunk's IT service intelligence capabilities.
Splunk is a software company that provides a platform for operational intelligence and real-time business insights from machine-generated data. The document discusses Splunk's products and services, customers in various industries, and use cases. It promotes Splunk's ability to make machine data accessible, usable and valuable for both IT and business users.
SplunkLive! München 2016 - Splunk Enterprise 6.3 - Data OnboardingSplunk
This document discusses new features in Splunk Enterprise 6.3, including breakthrough performance and scale improvements that double search and indexing speed and increase capacity by 20-50%, lowering total cost of ownership by 20%+. It also describes new capabilities for advanced analysis and visualization, high-volume event collection, and an enterprise-scale platform with improved support for DevOps, IoT data analysis, and third-party integrations. A new HTTP Event Collector provides a token-based JSON API for ingesting events from various sources.
Here’s your chance to get hands-on with Splunk for the first time! Bring your modern Mac, Windows, or Linux laptop and we’ll go through a simple install of Splunk. Then, we’ll load some sample data, and see Splunk in action – we’ll cover searching, pivot, reporting, alerting, and dashboard creation. At the end of this session you’ll have a hands-on understanding of the pieces that make up the Splunk Platform, how it works, and how it fits in the landscape of Big Data. You’ll experience practical examples that differentiate Splunk while demonstrating how to gain quick time to value.
What is Splunk? At the end of this session you’ll have a high-level understanding of the pieces that make up the Splunk Platform, how it works, and how it fits in the landscape of Big Data. You’ll see practical examples that differentiate Splunk while demonstrating how to gain quick time to value.
Bengaluru Splunk User Group kick off.
Introduction to User Group Leaders,
Session 1 on Splunk Remote Work Insights
Session 2 on Splunk Dashboard Journey
How to Move from Monitoring to Observability, On-Premises and in a Multi-Clou...Splunk
With the acceleration of customer and business demands, site reliability engineers and IT Ops analysts now require operational visibility into their entire architecture, something that traditional APM tools, dev logging tools, and SRE tools aren’t equipped to provide. Observability enables you to inspect and understand your IT stack on premises and in the cloud(s); It’s no longer about whether your system works (monitoring), but being able to task why it is not working? (Observability). This presentation will outline key steps to take to move from monitoring to observability.
Similar to Webinar: Neuigkeiten zu Splunk Enterprise 6.3 (20)
.conf Go 2023 - Raiffeisen Bank InternationalSplunk
This document discusses standardizing security operations procedures (SOPs) to increase efficiency and automation. It recommends storing SOPs in a code repository for versioning and referencing them in workbooks which are lists of standard tasks to follow for investigations. The goal is to have investigation playbooks in the security orchestration, automation and response (SOAR) tool perform the predefined investigation steps from the workbooks to automate incident response. This helps analysts automate faster without wasting time by having standard, vendor-agnostic procedures.
.conf Go 2023 - Das passende Rezept für die digitale (Security) Revolution zu...Splunk
.conf Go 2023 presentation:
"Das passende Rezept für die digitale (Security) Revolution zur Telematik Infrastruktur 2.0 im Gesundheitswesen?"
Speaker: Stefan Stein -
Teamleiter CERT | gematik GmbH M.Eng. IT-Sicherheit & Forensik,
doctorate student at TH Brandenburg & Universität Dresden
El documento describe la transición de Cellnex de un Centro de Operaciones de Seguridad (SOC) a un Equipo de Respuesta a Incidentes de Seguridad (CSIRT). La transición se debió al crecimiento de Cellnex y la necesidad de automatizar procesos y tareas para mejorar la eficiencia. Cellnex implementó Splunk SIEM y SOAR para automatizar la creación, remediación y cierre de incidentes. Esto permitió al personal concentrarse en tareas estratégicas y mejorar KPIs como tiempos de resolución y correos electrónicos anal
conf go 2023 - El camino hacia la ciberseguridad (ABANCA)Splunk
Este documento resume el recorrido de ABANCA en su camino hacia la ciberseguridad con Splunk, desde la incorporación de perfiles dedicados en 2016 hasta convertirse en un centro de monitorización y respuesta con más de 1TB de ingesta diaria y 350 casos de uso alineados con MITRE ATT&CK. También describe errores cometidos y soluciones implementadas, como la normalización de fuentes y formación de operadores, y los pilares actuales como la automatización, visibilidad y alineación con MITRE ATT&CK. Por último, señala retos
Splunk - BMW connects business and IT with data driven operations SRE and O11ySplunk
BMW is defining the next level of mobility - digital interactions and technology are the backbone to continued success with its customers. Discover how an IT team is tackling the journey of business transformation at scale whilst maintaining (and showing the importance of) business and IT service availability. Learn how BMW introduced frameworks to connect business and IT, using real-time data to mitigate customer impact, as Michael and Mark share their experience in building operations for a resilient future.
The document is a presentation on cyber security trends and Splunk security products from Matthias Maier, Product Marketing Director for Security at Splunk. The presentation covers trends in security operations like the evolution of SOCs, new security roles, and data-centric security approaches. It also provides updates on Splunk's security portfolio including recognition as a leader in SIEM by Gartner and growth in the SIEM market. Maier highlights some breakout sessions from the conference on topics like asset defense, machine learning, and building detections.
Data foundations building success, at city scale – Imperial College LondonSplunk
Universities have more in common with modern cities than traditional places of learning. This mini city needs to empower its citizens to thrive and achieve their ambitions. Operationalising data is key to building critical services; from understanding complex IT estates for smarter decision-making to robust security and a more reliable, resilient student experience. Juan will share his experience in building data foundations for a resilient future whilst enabling digital transformation at Imperial College London.
Splunk: How Vodafone established Operational Analytics in a Hybrid Environmen...Splunk
Learn how Vodafone has provided end-to-end visibility across services by building an Operational Analytics Platform. In this session, you will hear how Stefan and his team manage legacy, on premise, hybrid and public cloud services, and how they are providing a platform for complex triage and debugging to tackle use cases across Vodafone’s extensive ecosystem.
.italo operates an Essential Service by connecting more than 100 million people annually across Italy with its super fast and secure railway. And CISO Enrico Maresca has been on a whirlwind journey of his own.
Formerly a Cyber Security Engineer, Enrico started at .italo as an IT Security Manager. One year later, he was promoted to CISO and tasked with building out – and significantly increasing the maturity level – of the SOC. The result was a huge step forward for .italo.
So how did he successfully achieve this ambitious ask? Join Enrico as he reveals the key insights and lessons learned in his SOC journey, including:
Top challenges faced in improving security posture
Key KPIs implemented in order to measure success
Strategies and approaches applied in the SOC
How MITRE ATT&CK and Splunk Enterprise Security were utilised
Next steps in their maturity journey ahead
This document summarizes a presentation about observability using Splunk. It includes an agenda introducing observability and why Splunk for observability. It discusses the need for modernization initiatives in companies and the thousands of changes required. It presents that Splunk provides end-to-end visibility across metrics, traces and logs to detect, troubleshoot and optimize systems. It shares a customer case study of Accenture using Splunk observability in their hybrid cloud environment. Finally, it concludes that observability with Splunk can drive results like reduced downtime and faster innovation.
This document contains slides from a Splunk presentation covering the following topics:
- Updated Splunk logo and information about meetings in Zurich and sales engineering leads
- Ideas for confused or concerned human figures in design concepts
- Three buckets of challenges around websites slowing, apps being down, and supply chain issues
- Accelerating mean time to detect, identify, respond and resolve through cyber resilience with Splunk
- Unifying security, IT and DevOps teams
- Splunk's technology vision focusing on customer experience, hybrid/edge, unleashing data lakes, and ubiquitous machine learning
- Gaining operational resilience through correlating infrastructure, security, application and user data with business outcomes
This document summarizes a presentation about Splunk's platform. It discusses Splunk's mission of helping customers create value faster with insights from their data. It provides statistics on Splunk's daily ingest and users. It highlights examples of how Splunk has helped customers in areas like internet messaging and convergent services. It also discusses upcoming challenges and new capabilities in Splunk like federated search, flexible indexing, ingest actions, improved data onboarding and management, and increased platform resilience and security.
The document appears to be a presentation from Splunk on security topics. It includes sections on cyber security resilience, the data-centric modern SOC, application monitoring at scale, threat modeling, security monitoring journeys, self-service Splunk infrastructure, the top 3 CISO priorities of risk based alerting, use case development, a security content repository, security PVP (posture, vision, and planning) and maturity assessment, and concludes with an overview of how Splunk can provide end-to-end visibility across an organization.
Driving Business Innovation: Latest Generative AI Advancements & Success StorySafe Software
Are you ready to revolutionize how you handle data? Join us for a webinar where we’ll bring you up to speed with the latest advancements in Generative AI technology and discover how leveraging FME with tools from giants like Google Gemini, Amazon, and Microsoft OpenAI can supercharge your workflow efficiency.
During the hour, we’ll take you through:
Guest Speaker Segment with Hannah Barrington: Dive into the world of dynamic real estate marketing with Hannah, the Marketing Manager at Workspace Group. Hear firsthand how their team generates engaging descriptions for thousands of office units by integrating diverse data sources—from PDF floorplans to web pages—using FME transformers, like OpenAIVisionConnector and AnthropicVisionConnector. This use case will show you how GenAI can streamline content creation for marketing across the board.
Ollama Use Case: Learn how Scenario Specialist Dmitri Bagh has utilized Ollama within FME to input data, create custom models, and enhance security protocols. This segment will include demos to illustrate the full capabilities of FME in AI-driven processes.
Custom AI Models: Discover how to leverage FME to build personalized AI models using your data. Whether it’s populating a model with local data for added security or integrating public AI tools, find out how FME facilitates a versatile and secure approach to AI.
We’ll wrap up with a live Q&A session where you can engage with our experts on your specific use cases, and learn more about optimizing your data workflows with AI.
This webinar is ideal for professionals seeking to harness the power of AI within their data management systems while ensuring high levels of customization and security. Whether you're a novice or an expert, gain actionable insights and strategies to elevate your data processes. Join us to see how FME and AI can revolutionize how you work with data!
Main news related to the CCS TSI 2023 (2023/1695)Jakub Marek
An English 🇬🇧 translation of a presentation to the speech I gave about the main changes brought by CCS TSI 2023 at the biggest Czech conference on Communications and signalling systems on Railways, which was held in Clarion Hotel Olomouc from 7th to 9th November 2023 (konferenceszt.cz). Attended by around 500 participants and 200 on-line followers.
The original Czech 🇨🇿 version of the presentation can be found here: https://www.slideshare.net/slideshow/hlavni-novinky-souvisejici-s-ccs-tsi-2023-2023-1695/269688092 .
The videorecording (in Czech) from the presentation is available here: https://youtu.be/WzjJWm4IyPk?si=SImb06tuXGb30BEH .
Your One-Stop Shop for Python Success: Top 10 US Python Development Providersakankshawande
Simplify your search for a reliable Python development partner! This list presents the top 10 trusted US providers offering comprehensive Python development services, ensuring your project's success from conception to completion.
Digital Banking in the Cloud: How Citizens Bank Unlocked Their MainframePrecisely
Inconsistent user experience and siloed data, high costs, and changing customer expectations – Citizens Bank was experiencing these challenges while it was attempting to deliver a superior digital banking experience for its clients. Its core banking applications run on the mainframe and Citizens was using legacy utilities to get the critical mainframe data to feed customer-facing channels, like call centers, web, and mobile. Ultimately, this led to higher operating costs (MIPS), delayed response times, and longer time to market.
Ever-changing customer expectations demand more modern digital experiences, and the bank needed to find a solution that could provide real-time data to its customer channels with low latency and operating costs. Join this session to learn how Citizens is leveraging Precisely to replicate mainframe data to its customer channels and deliver on their “modern digital bank” experiences.
For the full video of this presentation, please visit: https://www.edge-ai-vision.com/2024/06/temporal-event-neural-networks-a-more-efficient-alternative-to-the-transformer-a-presentation-from-brainchip/
Chris Jones, Director of Product Management at BrainChip , presents the “Temporal Event Neural Networks: A More Efficient Alternative to the Transformer” tutorial at the May 2024 Embedded Vision Summit.
The expansion of AI services necessitates enhanced computational capabilities on edge devices. Temporal Event Neural Networks (TENNs), developed by BrainChip, represent a novel and highly efficient state-space network. TENNs demonstrate exceptional proficiency in handling multi-dimensional streaming data, facilitating advancements in object detection, action recognition, speech enhancement and language model/sequence generation. Through the utilization of polynomial-based continuous convolutions, TENNs streamline models, expedite training processes and significantly diminish memory requirements, achieving notable reductions of up to 50x in parameters and 5,000x in energy consumption compared to prevailing methodologies like transformers.
Integration with BrainChip’s Akida neuromorphic hardware IP further enhances TENNs’ capabilities, enabling the realization of highly capable, portable and passively cooled edge devices. This presentation delves into the technical innovations underlying TENNs, presents real-world benchmarks, and elucidates how this cutting-edge approach is positioned to revolutionize edge AI across diverse applications.
HCL Notes and Domino License Cost Reduction in the World of DLAUpanagenda
Webinar Recording: https://www.panagenda.com/webinars/hcl-notes-and-domino-license-cost-reduction-in-the-world-of-dlau/
The introduction of DLAU and the CCB & CCX licensing model caused quite a stir in the HCL community. As a Notes and Domino customer, you may have faced challenges with unexpected user counts and license costs. You probably have questions on how this new licensing approach works and how to benefit from it. Most importantly, you likely have budget constraints and want to save money where possible. Don’t worry, we can help with all of this!
We’ll show you how to fix common misconfigurations that cause higher-than-expected user counts, and how to identify accounts which you can deactivate to save money. There are also frequent patterns that can cause unnecessary cost, like using a person document instead of a mail-in for shared mailboxes. We’ll provide examples and solutions for those as well. And naturally we’ll explain the new licensing model.
Join HCL Ambassador Marc Thomas in this webinar with a special guest appearance from Franz Walder. It will give you the tools and know-how to stay on top of what is going on with Domino licensing. You will be able lower your cost through an optimized configuration and keep it low going forward.
These topics will be covered
- Reducing license cost by finding and fixing misconfigurations and superfluous accounts
- How do CCB and CCX licenses really work?
- Understanding the DLAU tool and how to best utilize it
- Tips for common problem areas, like team mailboxes, functional/test users, etc
- Practical examples and best practices to implement right away
What is an RPA CoE? Session 1 – CoE VisionDianaGray10
In the first session, we will review the organization's vision and how this has an impact on the COE Structure.
Topics covered:
• The role of a steering committee
• How do the organization’s priorities determine CoE Structure?
Speaker:
Chris Bolin, Senior Intelligent Automation Architect Anika Systems
Monitoring and Managing Anomaly Detection on OpenShift.pdfTosin Akinosho
Monitoring and Managing Anomaly Detection on OpenShift
Overview
Dive into the world of anomaly detection on edge devices with our comprehensive hands-on tutorial. This SlideShare presentation will guide you through the entire process, from data collection and model training to edge deployment and real-time monitoring. Perfect for those looking to implement robust anomaly detection systems on resource-constrained IoT/edge devices.
Key Topics Covered
1. Introduction to Anomaly Detection
- Understand the fundamentals of anomaly detection and its importance in identifying unusual behavior or failures in systems.
2. Understanding Edge (IoT)
- Learn about edge computing and IoT, and how they enable real-time data processing and decision-making at the source.
3. What is ArgoCD?
- Discover ArgoCD, a declarative, GitOps continuous delivery tool for Kubernetes, and its role in deploying applications on edge devices.
4. Deployment Using ArgoCD for Edge Devices
- Step-by-step guide on deploying anomaly detection models on edge devices using ArgoCD.
5. Introduction to Apache Kafka and S3
- Explore Apache Kafka for real-time data streaming and Amazon S3 for scalable storage solutions.
6. Viewing Kafka Messages in the Data Lake
- Learn how to view and analyze Kafka messages stored in a data lake for better insights.
7. What is Prometheus?
- Get to know Prometheus, an open-source monitoring and alerting toolkit, and its application in monitoring edge devices.
8. Monitoring Application Metrics with Prometheus
- Detailed instructions on setting up Prometheus to monitor the performance and health of your anomaly detection system.
9. What is Camel K?
- Introduction to Camel K, a lightweight integration framework built on Apache Camel, designed for Kubernetes.
10. Configuring Camel K Integrations for Data Pipelines
- Learn how to configure Camel K for seamless data pipeline integrations in your anomaly detection workflow.
11. What is a Jupyter Notebook?
- Overview of Jupyter Notebooks, an open-source web application for creating and sharing documents with live code, equations, visualizations, and narrative text.
12. Jupyter Notebooks with Code Examples
- Hands-on examples and code snippets in Jupyter Notebooks to help you implement and test anomaly detection models.
Fueling AI with Great Data with Airbyte WebinarZilliz
This talk will focus on how to collect data from a variety of sources, leveraging this data for RAG and other GenAI use cases, and finally charting your course to productionalization.
Dandelion Hashtable: beyond billion requests per second on a commodity serverAntonios Katsarakis
This slide deck presents DLHT, a concurrent in-memory hashtable. Despite efforts to optimize hashtables, that go as far as sacrificing core functionality, state-of-the-art designs still incur multiple memory accesses per request and block request processing in three cases. First, most hashtables block while waiting for data to be retrieved from memory. Second, open-addressing designs, which represent the current state-of-the-art, either cannot free index slots on deletes or must block all requests to do so. Third, index resizes block every request until all objects are copied to the new index. Defying folklore wisdom, DLHT forgoes open-addressing and adopts a fully-featured and memory-aware closed-addressing design based on bounded cache-line-chaining. This design offers lock-free index operations and deletes that free slots instantly, (2) completes most requests with a single memory access, (3) utilizes software prefetching to hide memory latencies, and (4) employs a novel non-blocking and parallel resizing. In a commodity server and a memory-resident workload, DLHT surpasses 1.6B requests per second and provides 3.5x (12x) the throughput of the state-of-the-art closed-addressing (open-addressing) resizable hashtable on Gets (Deletes).
Conversational agents, or chatbots, are increasingly used to access all sorts of services using natural language. While open-domain chatbots - like ChatGPT - can converse on any topic, task-oriented chatbots - the focus of this paper - are designed for specific tasks, like booking a flight, obtaining customer support, or setting an appointment. Like any other software, task-oriented chatbots need to be properly tested, usually by defining and executing test scenarios (i.e., sequences of user-chatbot interactions). However, there is currently a lack of methods to quantify the completeness and strength of such test scenarios, which can lead to low-quality tests, and hence to buggy chatbots.
To fill this gap, we propose adapting mutation testing (MuT) for task-oriented chatbots. To this end, we introduce a set of mutation operators that emulate faults in chatbot designs, an architecture that enables MuT on chatbots built using heterogeneous technologies, and a practical realisation as an Eclipse plugin. Moreover, we evaluate the applicability, effectiveness and efficiency of our approach on open-source chatbots, with promising results.
[OReilly Superstream] Occupy the Space: A grassroots guide to engineering (an...Jason Yip
The typical problem in product engineering is not bad strategy, so much as “no strategy”. This leads to confusion, lack of motivation, and incoherent action. The next time you look for a strategy and find an empty space, instead of waiting for it to be filled, I will show you how to fill it in yourself. If you’re wrong, it forces a correction. If you’re right, it helps create focus. I’ll share how I’ve approached this in the past, both what works and lessons for what didn’t work so well.
Introduction of Cybersecurity with OSS at Code Europe 2024Hiroshi SHIBATA
I develop the Ruby programming language, RubyGems, and Bundler, which are package managers for Ruby. Today, I will introduce how to enhance the security of your application using open-source software (OSS) examples from Ruby and RubyGems.
The first topic is CVE (Common Vulnerabilities and Exposures). I have published CVEs many times. But what exactly is a CVE? I'll provide a basic understanding of CVEs and explain how to detect and handle vulnerabilities in OSS.
Next, let's discuss package managers. Package managers play a critical role in the OSS ecosystem. I'll explain how to manage library dependencies in your application.
I'll share insights into how the Ruby and RubyGems core team works to keep our ecosystem safe. By the end of this talk, you'll have a better understanding of how to safeguard your code.
Taking AI to the Next Level in Manufacturing.pdfssuserfac0301
Read Taking AI to the Next Level in Manufacturing to gain insights on AI adoption in the manufacturing industry, such as:
1. How quickly AI is being implemented in manufacturing.
2. Which barriers stand in the way of AI adoption.
3. How data quality and governance form the backbone of AI.
4. Organizational processes and structures that may inhibit effective AI adoption.
6. Ideas and approaches to help build your organization's AI strategy.
How to Interpret Trends in the Kalyan Rajdhani Mix Chart.pdfChart Kalyan
A Mix Chart displays historical data of numbers in a graphical or tabular form. The Kalyan Rajdhani Mix Chart specifically shows the results of a sequence of numbers over different periods.
One of of the key differentiators of Splunk is the ability to digest all machine data and allow users to quickly analyze it for insight. We call this the universal machine data platform. We’ll look at this in more detail in a bit, but for now, understand that the platform was designed around the premise of being able to consume any machine data even if the format changes; something a relational database cannot do.
(Splunk Cloud is only available in the U.S. and Canada.)
Splunk software reliably collects and indexes all the streaming data from IT systems, technology devices and the Internet of Things in real-time - tens of thousands of sources in unpredictable formats and types. Splunk software is optimized for real-time, low latency and interactivity.
Organizations use Splunk software and their data the following ways:
1. Find and fix problems dramatically faster
2. Automatically monitor to identify issues, problems and attacks
3. Gain end-to-end visibility to track and deliver on IT KPIs and make better-informed IT decisions
4. Gain real-time insight from operational data to make better-informed business decisions
This is described as Operational Intelligence: visibility, insights and intelligence from operational data.
Our customers typically start with Splunk to solve a specific problem, and then expand from there to address a broad range of use cases, across application troubleshooting, IT infrastructure monitoring, security, business analytics, Internet of things, and many others that are entirely innovated by our customers.
Here’s how it works. Splunk software and cloud services reliably collect and index machine data, from a single source to tens of thousands of sources. All in real time.
- Once data is in Splunk, you can search, analyze, report-on and derive insights from all your data - across real-time or historical data that may be stored in Hadoop or other NoSQL data sources.
Splunk software provides an open, fully integrated platform. That means you can collect, index, analyze, report and predict on machine-generated data from a single product. It’s enterprise-ready with high availability and disaster recovery features, role-based access control and scales to index hundreds of terabytes per day. It’s an open platform with over 500 Splunk Apps available and allows for custom development.
Splunk Enterprise is the industry leading software for machine data analytics and has been driving innovation and setting the standard for Operational Intelligence since 2006.
In the beginning, we were first to introduce the paradigm of ‘search’ to IT – to troubleshoot IT operations and application management issues much faster than ever before and to find the proverbial “needle in the haystack”. When asking customers, they often referred to it as “google for the datacenter”.
As the product evolved, Splunk 4 - the engine for machine data - introduced enterprise-class features – dashboards and apps, real-time search and alerts, universal collection and indexing, enterprise controls and map-reduce for horizontal scalability on commodity servers.
And then in 2012 we introduced Splunk 5 – this release represented the evolution of Splunk as an Enterprise Platform for Operational Intelligence. It introduced breakthrough innovations and platform features that included:
A new reporting architecture and transparent summarization technology delivering dramatically faster reports
A new high availability architecture delivering enterprise-class scale and resilience, even while scaling on commodity servers and storage
A robust developer API and SDKs available in mainstream programming languages to enable enterprise developers to leverage Splunk software
Big data ecosystem integrations that included Splunk Hadoop Connect, Splunk DB Connect and the Splunk App for HadoopOps
And continuing our strategy of delivering you the Platform for Operational Intelligence we introduce you to Splunk 6 - The most advanced version of Splunk software ever.
Splunk 6 delivers new and powerful analytics features designed for broader use: non-technical and technical users alike. Splunk 6 is our most advanced version of Splunk software ever – the industry-leading machine data platform.
Powerful Analytics:
Splunk Enterprise 6 takes large-scale machine data analytics to the next level by introducing three breakthrough innovations:
Pivot – opens up the power of analytics to non-technical users with an easy-to-use drag and drop interface to explore, manipulate and visualize data
Data Model – defines meaningful relationships in underlying machine data and makes this data more useful to a broader base of users, in particular non-technical users
Analytics Store – patent-pending technology that accelerates data models by delivering extremely high performance data retrieval for analytical processing, up to 1000x faster than Splunk Enterprise 5
The new Pivot interface, combined with Data Models and Analytics Store makes it dramatically easier for non-technical users and technical users alike to analyze and visualize data in Splunk. Now more users than ever are empowered by Splunk software to get insights from their machine data.
Intuitive User Experience:
Splunk Enterprise 6 includes powerful productivity features for users with a more intuitive user experience:
The new Home Experience – gives users instant access to the data, apps and content they care about
The Enhanced Search Experience – brings search and reporting together – so users can author rich – dynamic reports - build visualizations – tables – and custom searches – faster than ever before
Simplified Management
We’ve made Splunk Enterprise 6 easier to deploy, configure and manage – even as customers expand their Splunk Enterprise deployments to the multi-terabyte scale
Simplified Cluster Management – deliver easier management of mission-critical Splunk software deployments providing everything the Splunk admin needs to monitor high availability on a centralized dashboard
Forwarder Management – support big data scale with easy configuration and management of thousands of forwarders across multiple geographies
Rich Developer Environment
And now Splunk Enterprise 6 provides a more powerful developer environment with the integrated Web Framework. Developers can build custom Splunk Apps, customize dashboards, or add advanced functionality - using standard web technologies, such as JavaScript and Django.
Splunk 6 represents a significant milestone in our mission to make machine data accessible, usable and valuable by everyone.
Find out more at www.splunk.com/6
Splunk is the industry-leading platform for Operational Intelligence, delivering both cloud and on-premise solutions tailored to meet the needs of any size organization.
Splunk is increasingly being used as a mission-critical, enterprise-wide operational intelligence source, processing 100's of terabytes of data per day. Release 6.3 continues our journey to support the ever-expanding requirements of the most demanding organizations
Release 6.3 is especially targeted to meet their needs for scalability and management, extended analysis features, analysis of high-volume data from application and IoT events, and new flexible connectivity options to their business and operational systems.
Release 6.3 is a platform release. All 6.3 features are supported on Splunk Enterprise, most on Splunk Cloud, and select features are supported on the Hunk and Splunk Light products
Organizations are increasingly standardizing their datacenter operations on economically priced servers supporting 16 or more CPU cores. Splunk Enterprise Release 6.3 now supports vertical scaling capabilities to take better advantage of this available power to:
Improve search and reporting performance(Double the performance of most search and reporting activities)
Increase data onboarding capacity
(Double the peak data onboarding speed vs Double the data onboarding speed)
Reduce operating costs(Reduce operating costs by 20% or more)
Previously, Splunk made use of available CPU cores to execute multiple simultaneous searches while indexing data. Release 6.3 vertical scaling uses allows both individual searches and the data indexing process to execute more efficiently by using multiple CPU cores per task. For systems with available CPU cores, the benefits are broad performance improvements in search processing, report generation, data on-boarding capacity and data forwarding efficiency.
Why capacity gain overall?
Intelligent scheduling should increase capacity somewhat by optimally scheduling jobs
Allowing indexing to use additional cores means that burst data can be handled on the same system, and generally that more data/day overall can be processed. This does not necessarily require totally free CPUs to be permanently available, it can just use additional when needed
If there is some available CPU capacity, then running searches faster may mean that more can be done
We think most customers are not using their systems to full capacity today. Cores do not have to be otherwise idle in order for gains to be seen
The net effect of all of this is a 20%+ gain. 50% for typical security scenarios
TCO Influencers
Indexer HW reduction
System capacity gains – data/searches; job scheduling
Standardization of datacenter HW configuration on higher core systems
Simpler management: DMC, indexer auto discovery, single-instance indexers and forwarders
Report 1H vs 10 mins – assumes 5 or 6 cores are used. (in next release you can control core usage per search)
Data ready in half the time – this is moving from 4 to 8 cores for indexing – so a burst takes half
20% capacity reflects our guidance changing from 250 to 300 GB/day
20% indexing HW – same reasoning
Tripled since 2013 is our guidance moving from 100 to 300 (6.0 was 100)
Expansion drop 50% - reflects 1/3 less indexer HW, but overall TCO is more than that, so downgraded to 50% instead of saying 66% TCO reduction
1/3 less HW – based on 100 to 300 increase
New cost 50% lower – same as expansion cost
That’s where we come in. Spunk’s mission is to make machine data accessible, usable, and valuable to everyone.