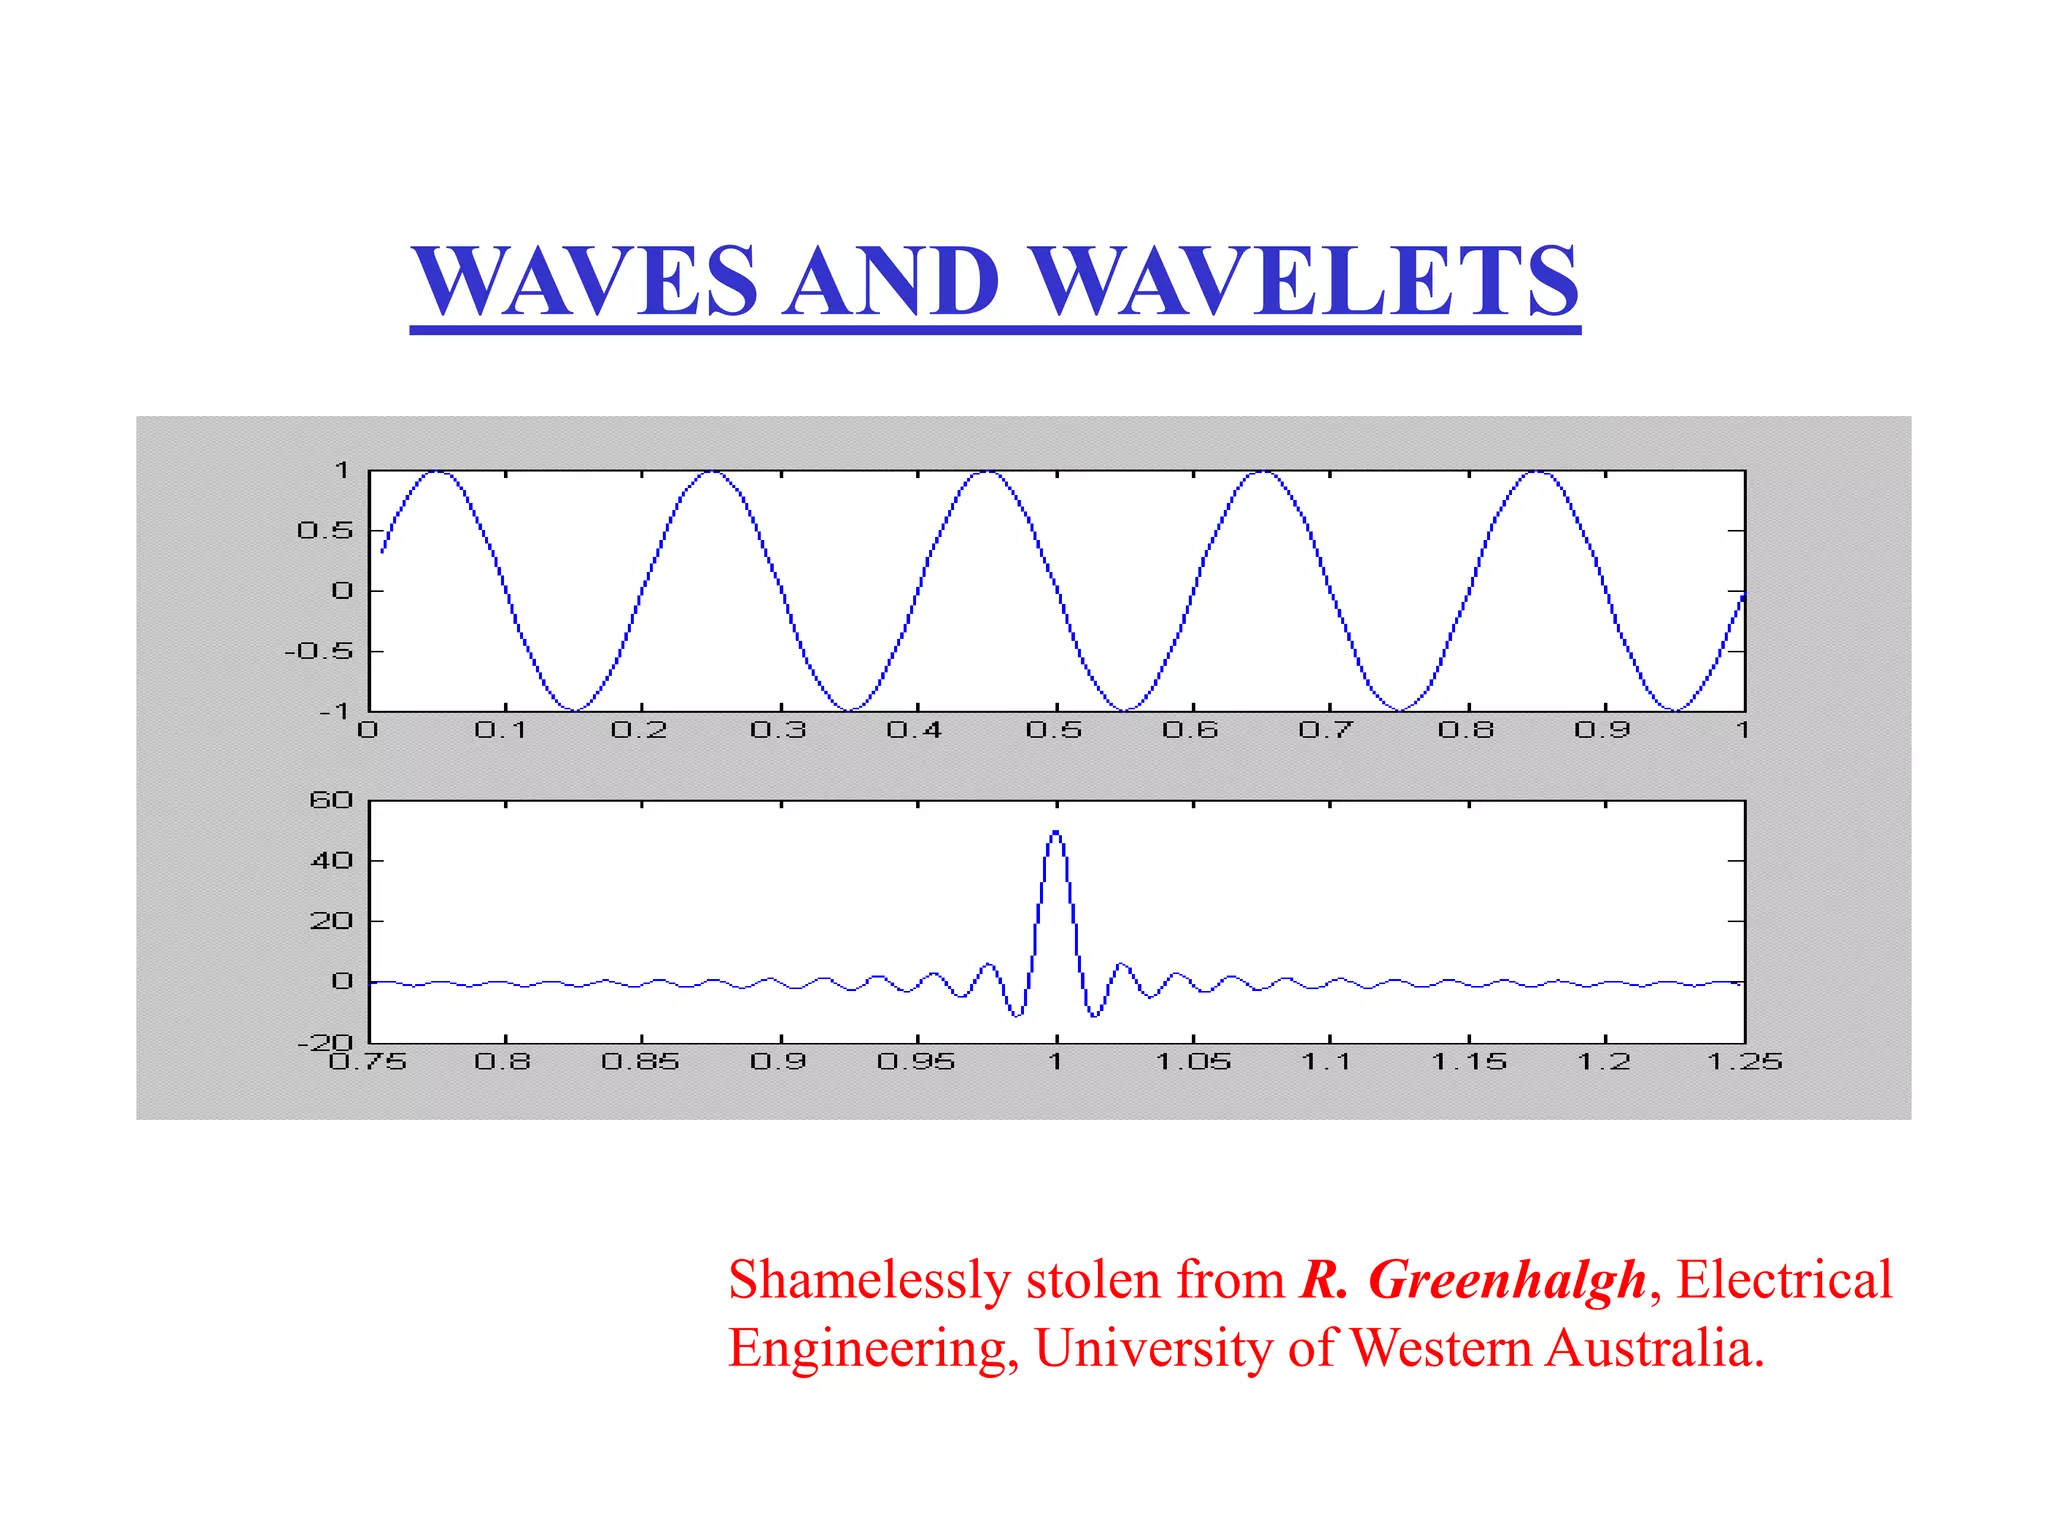
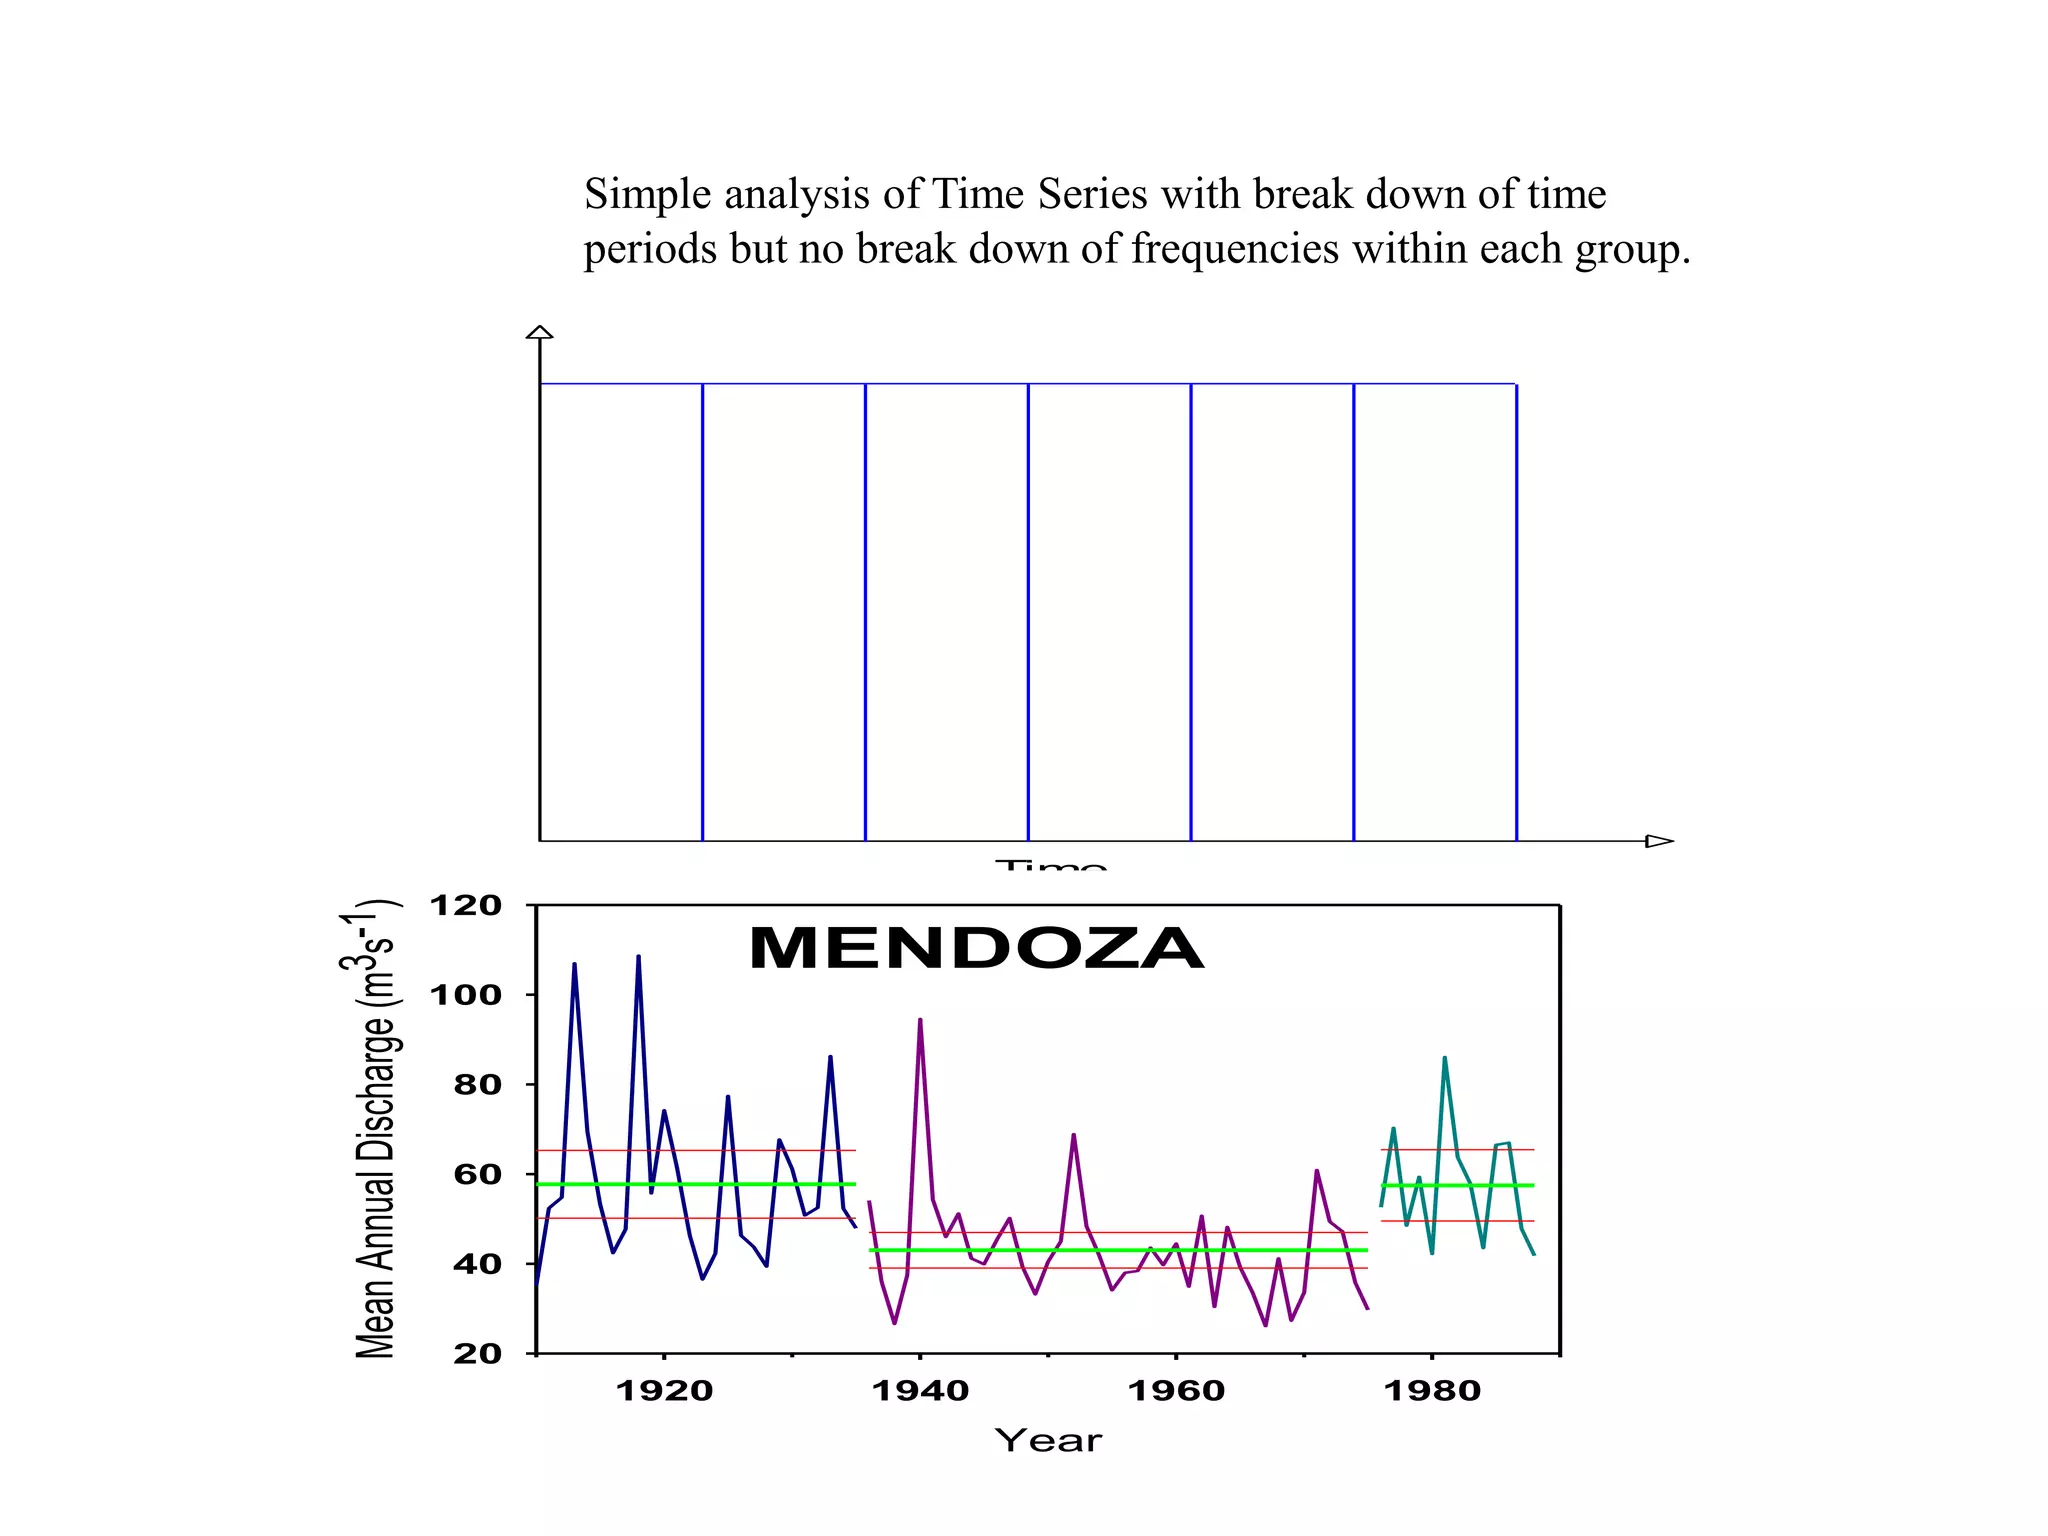
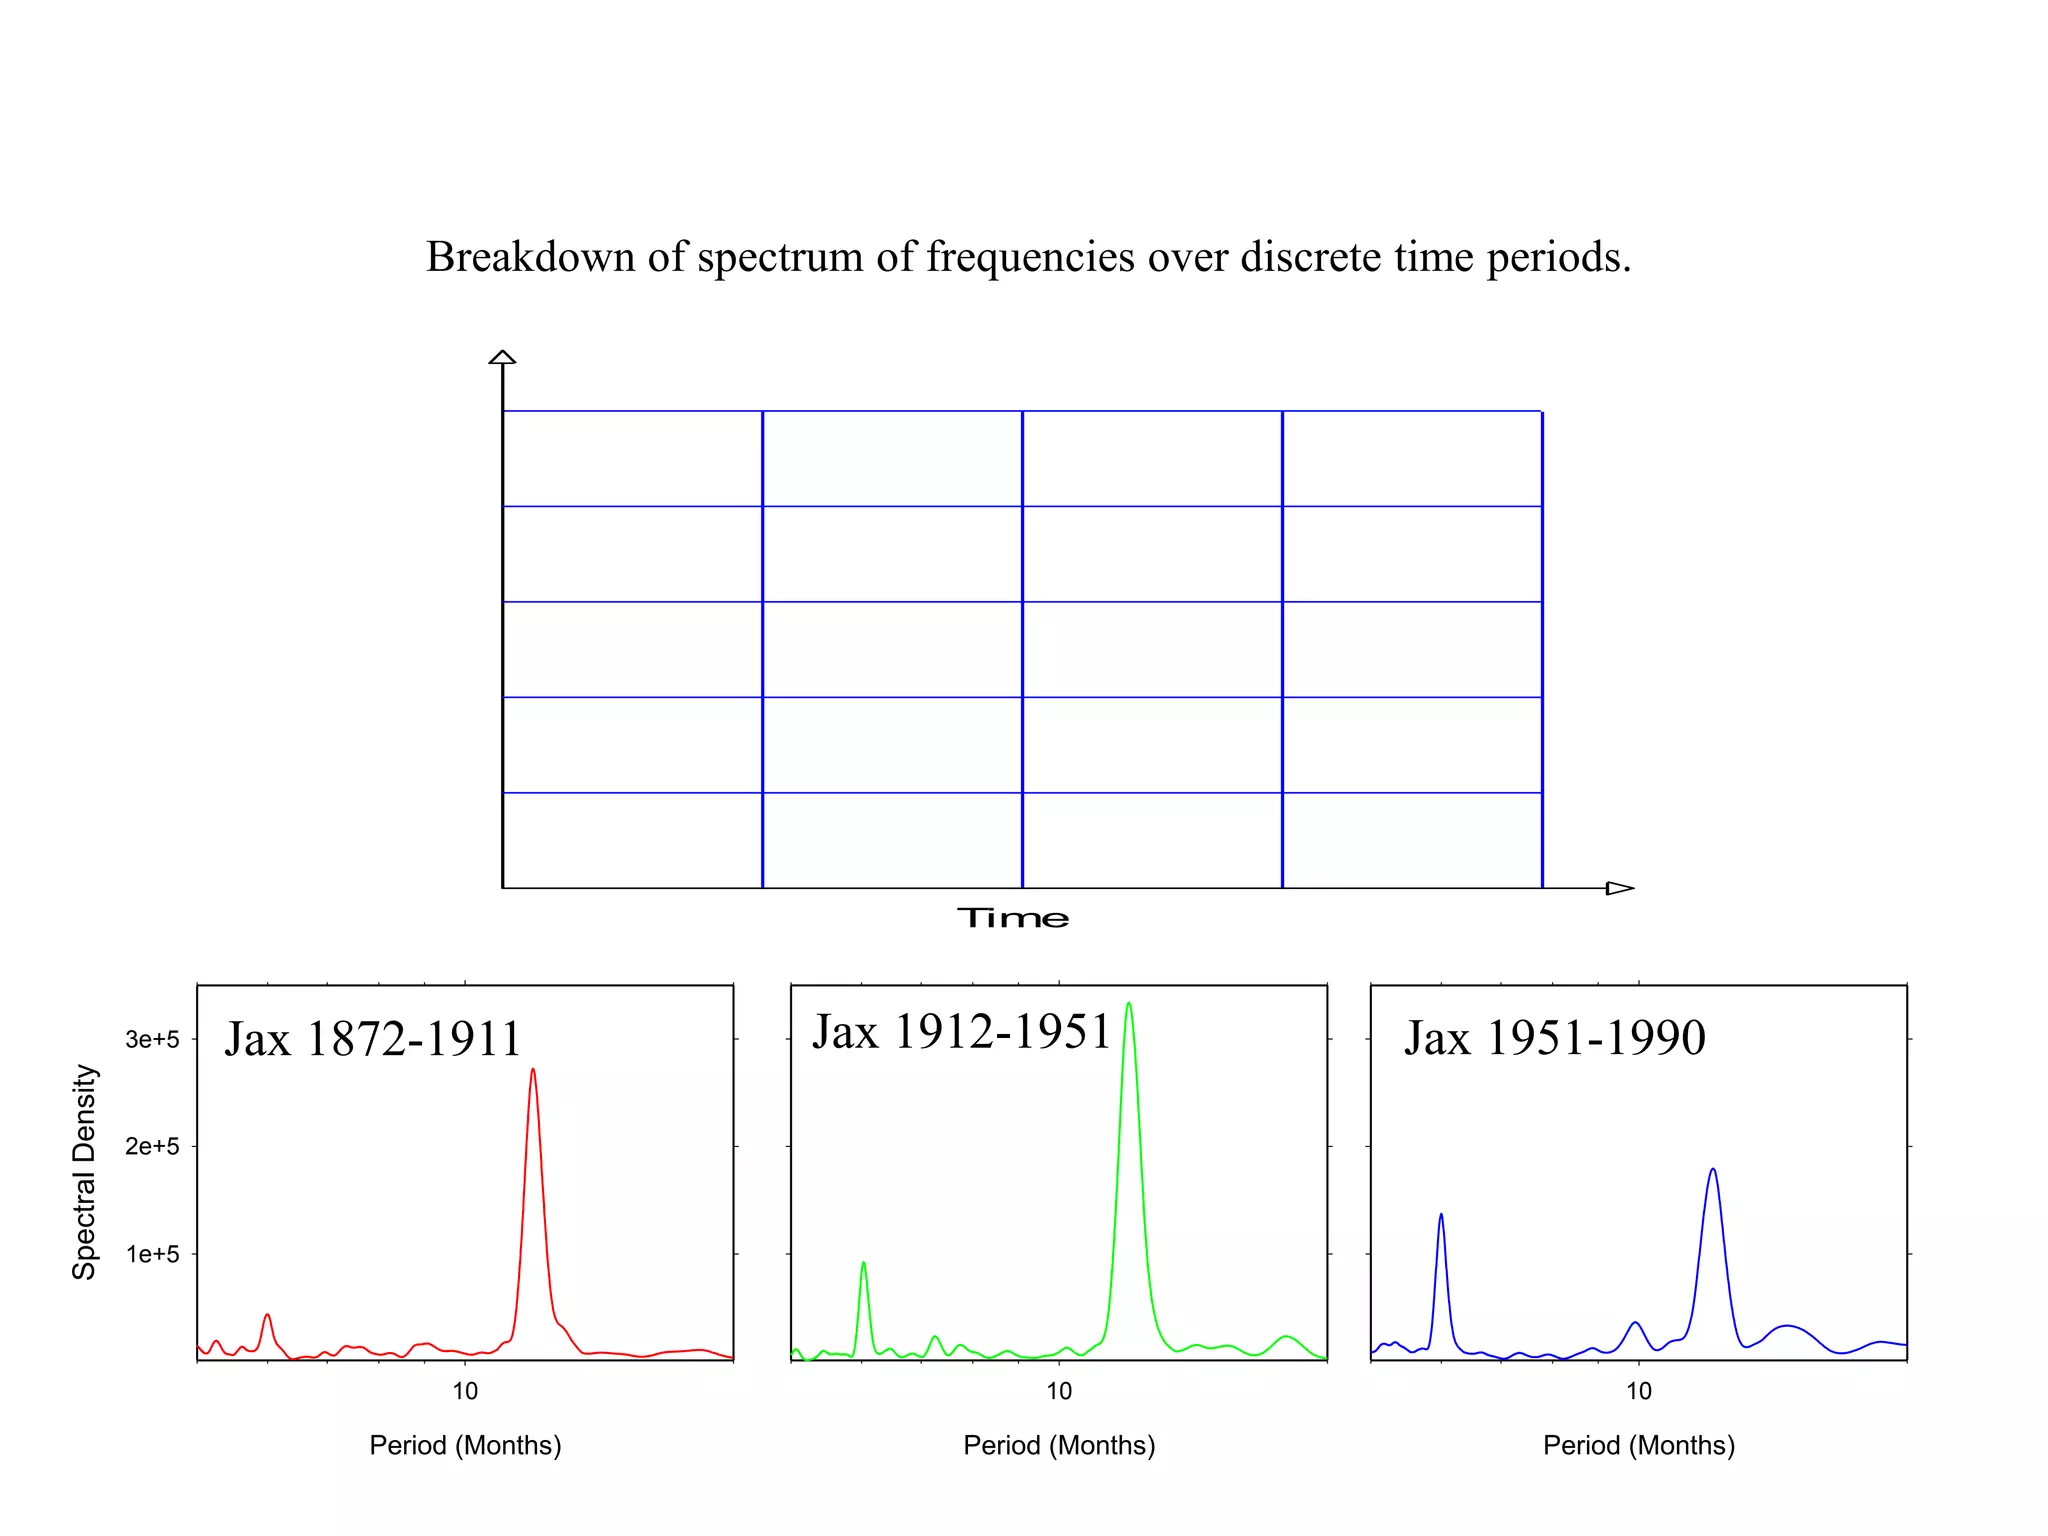
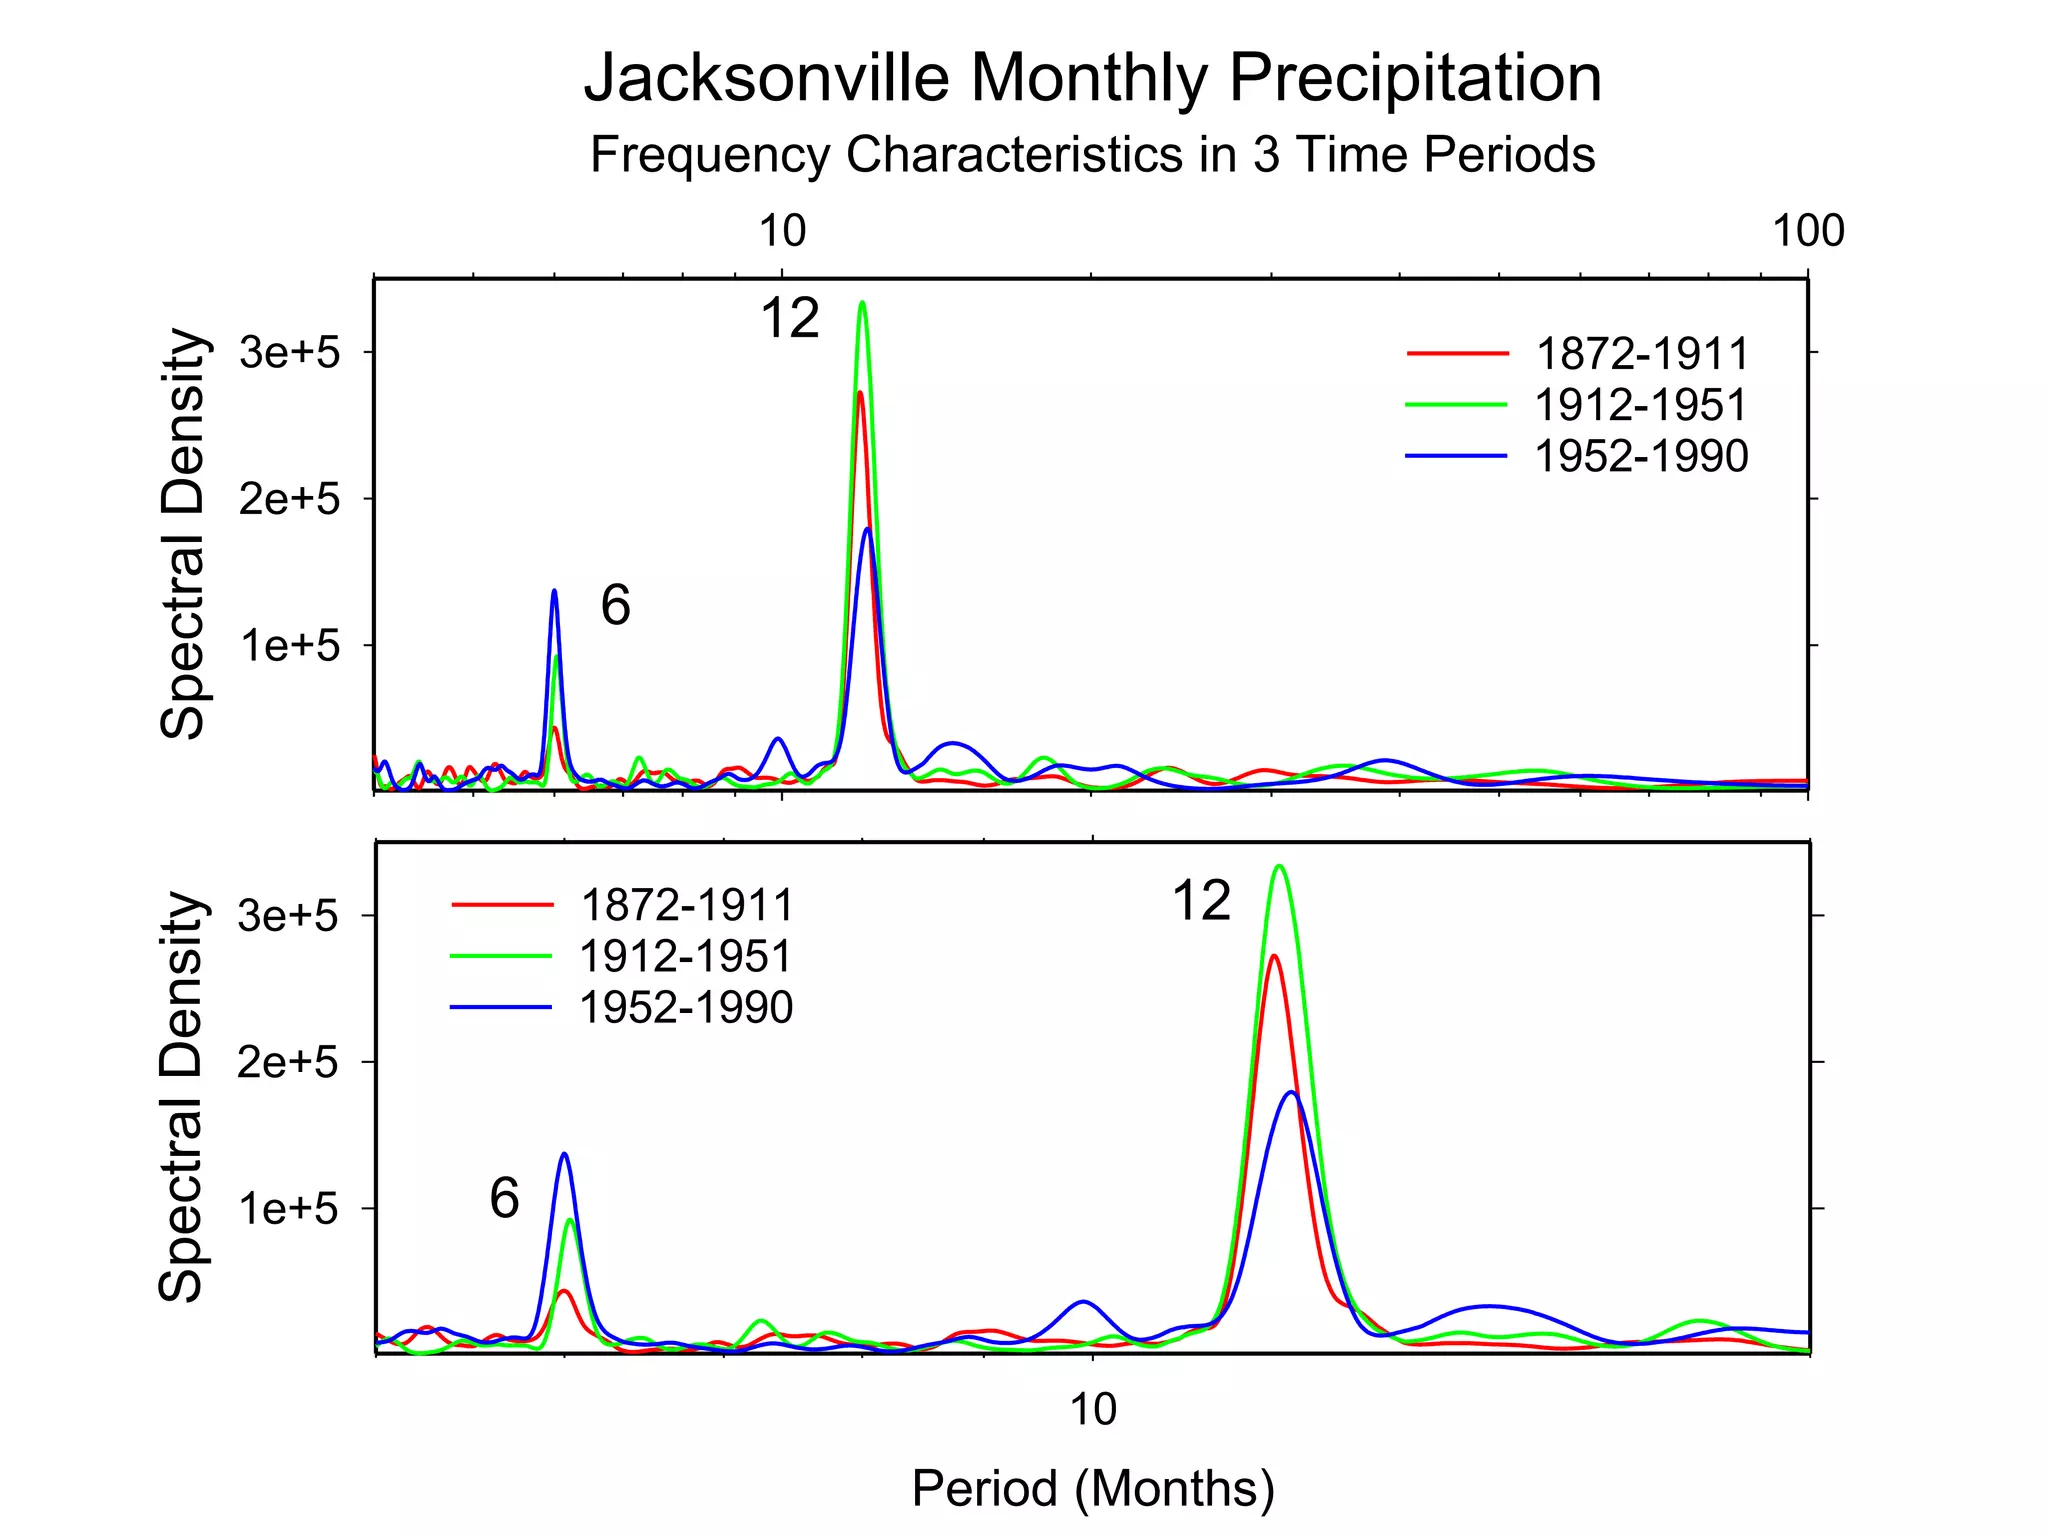
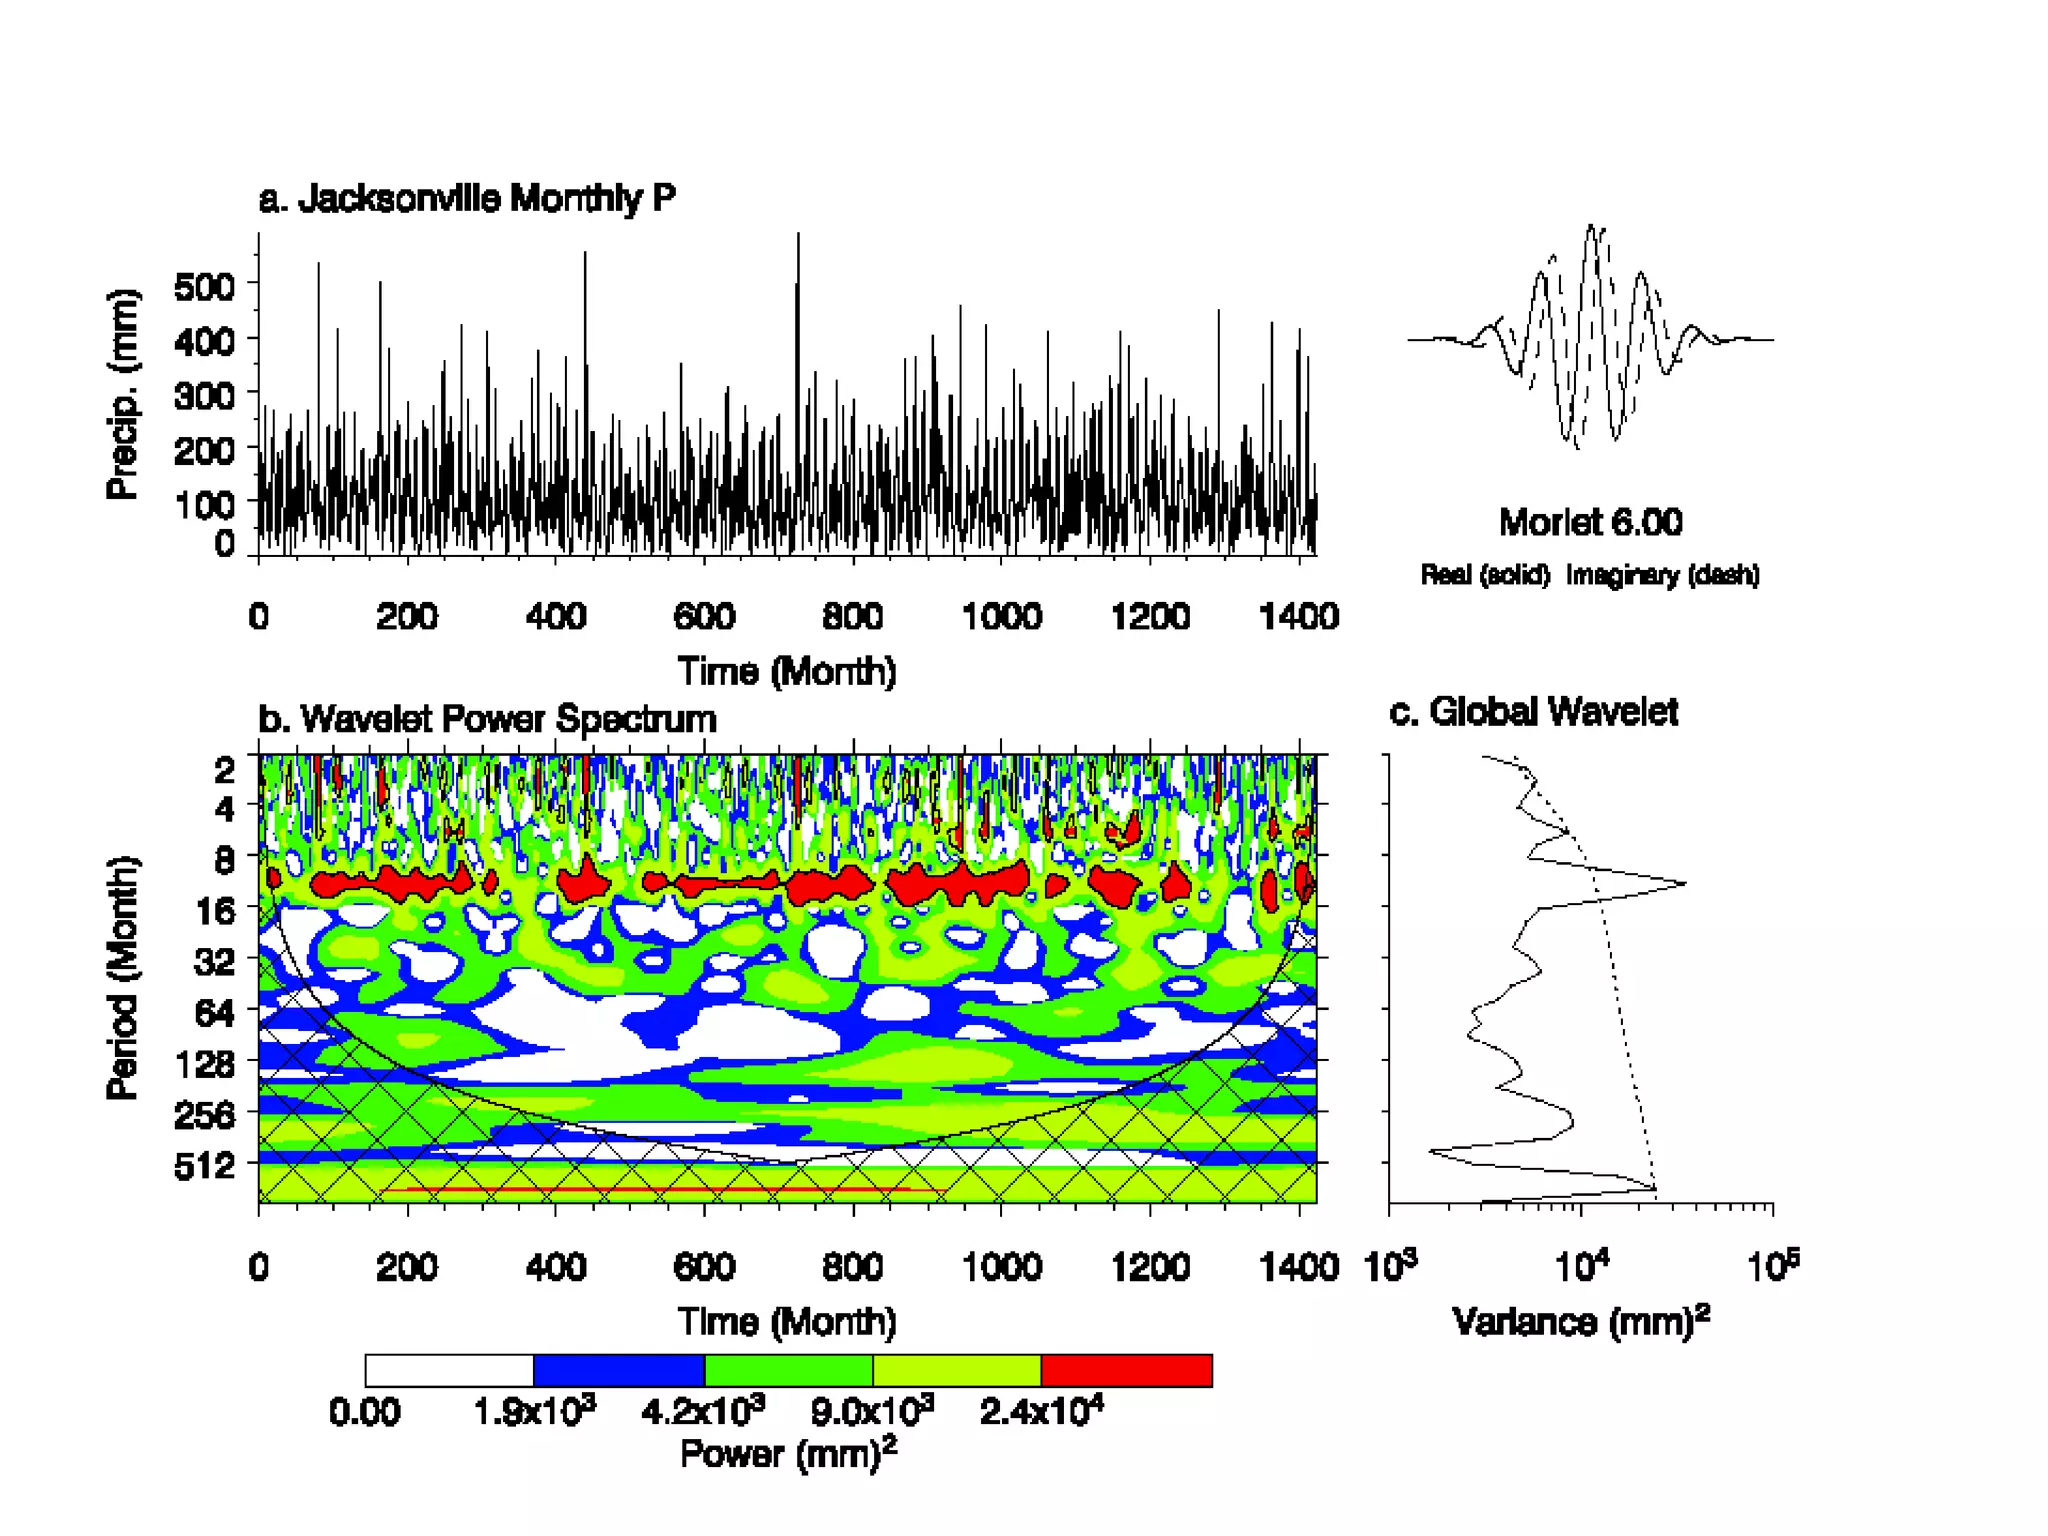
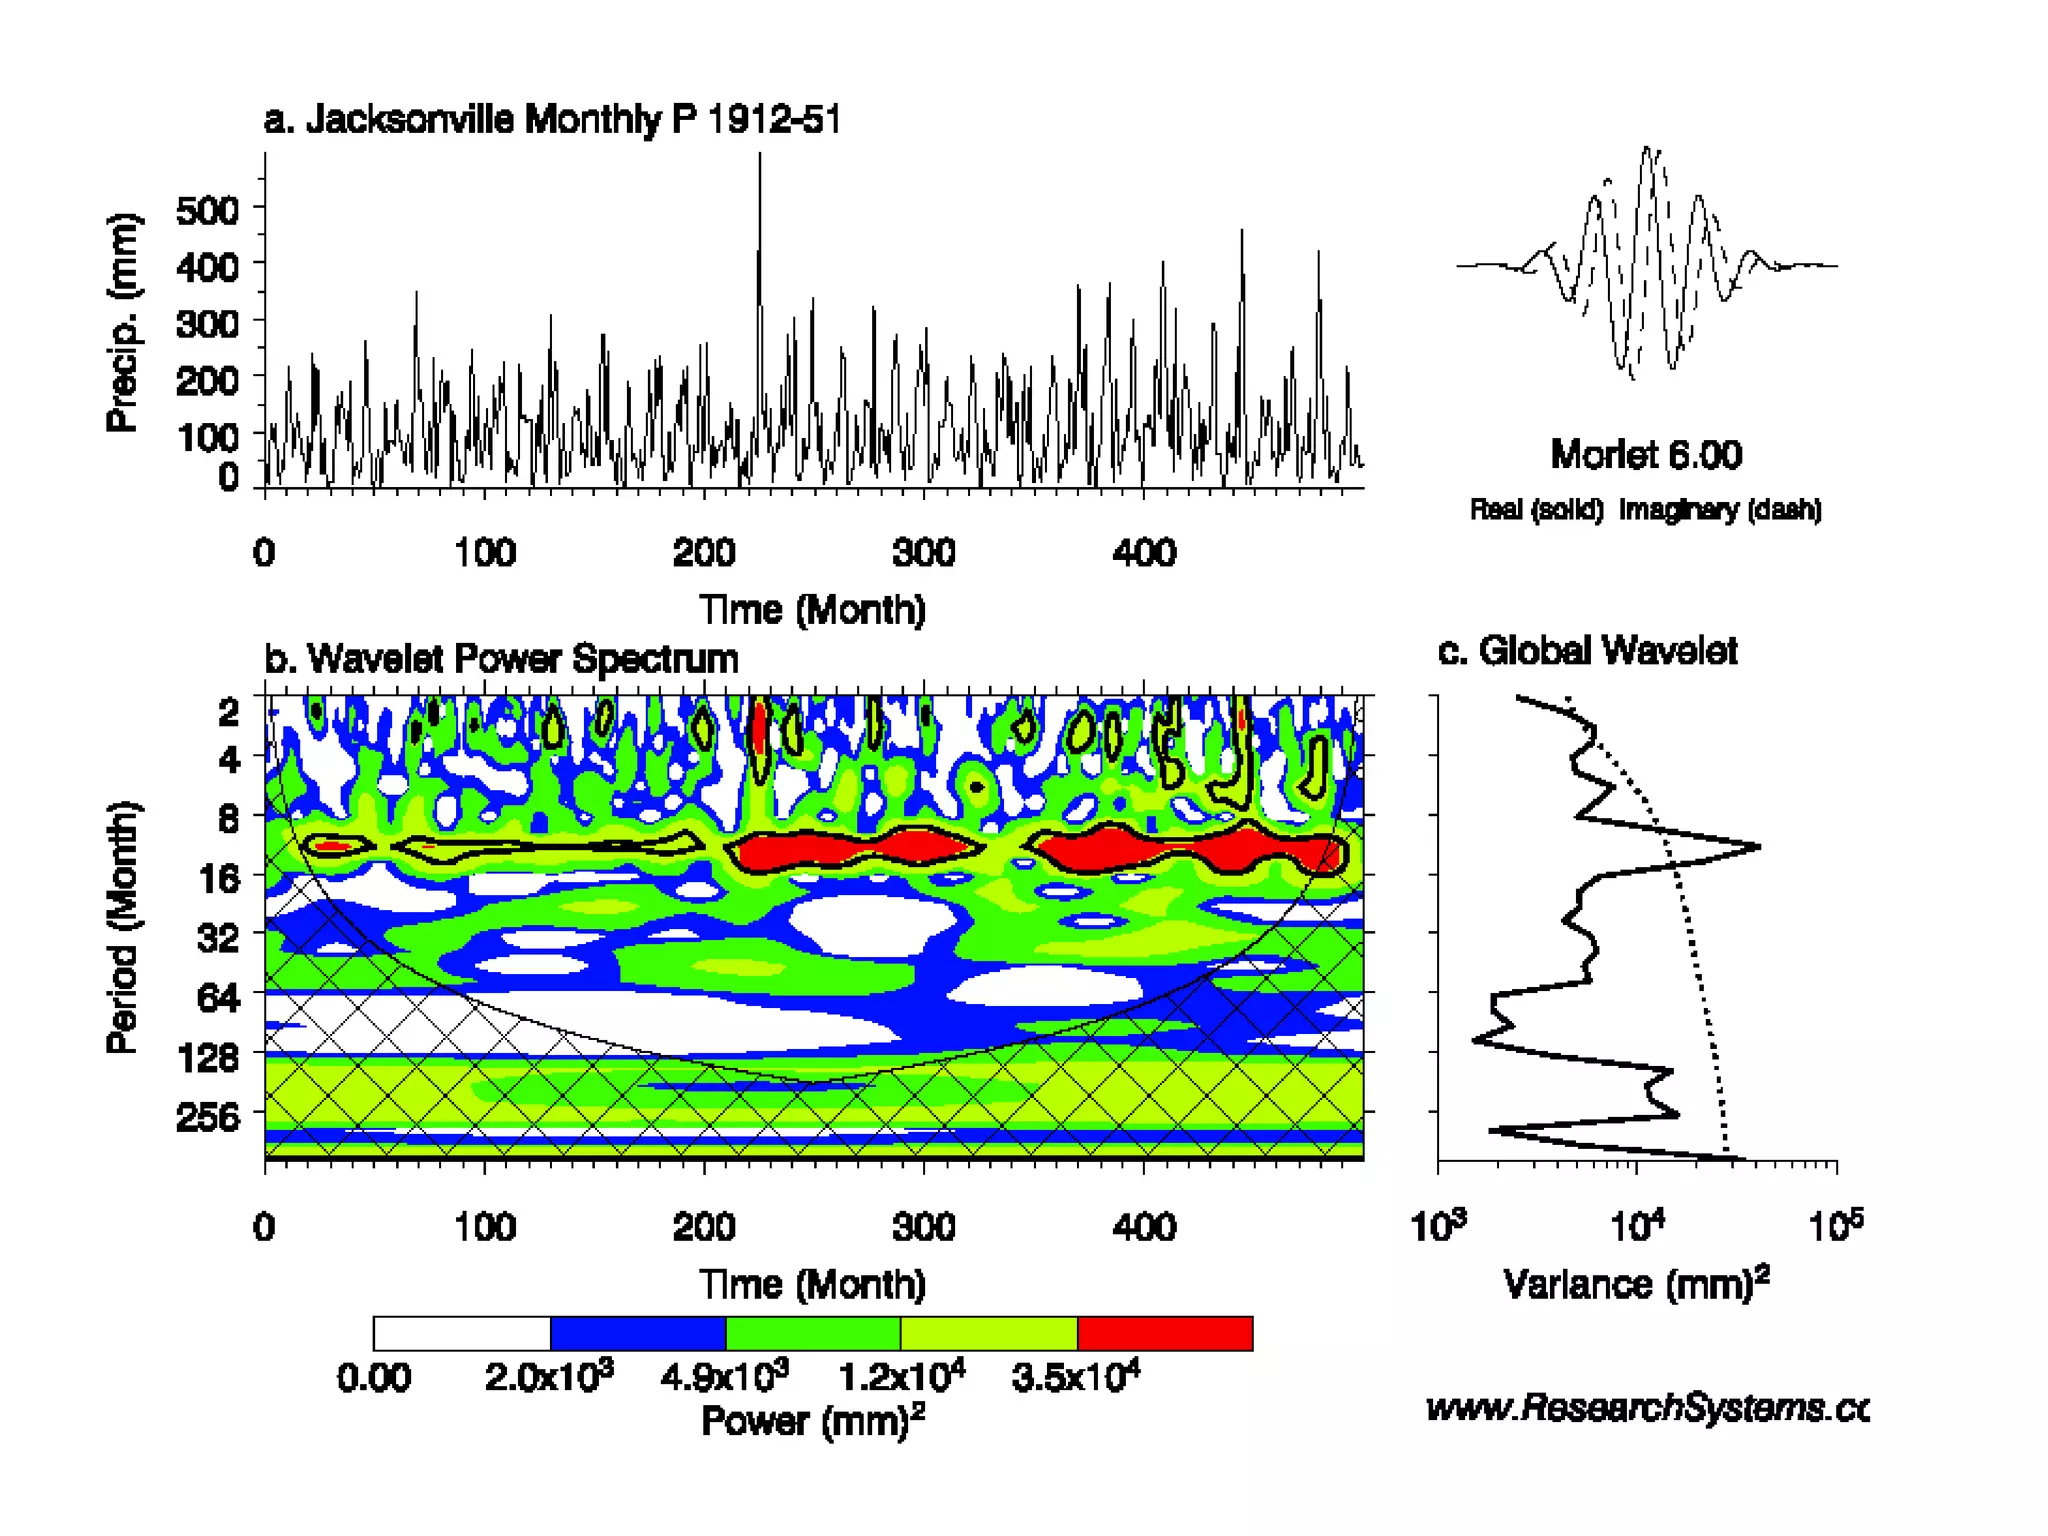
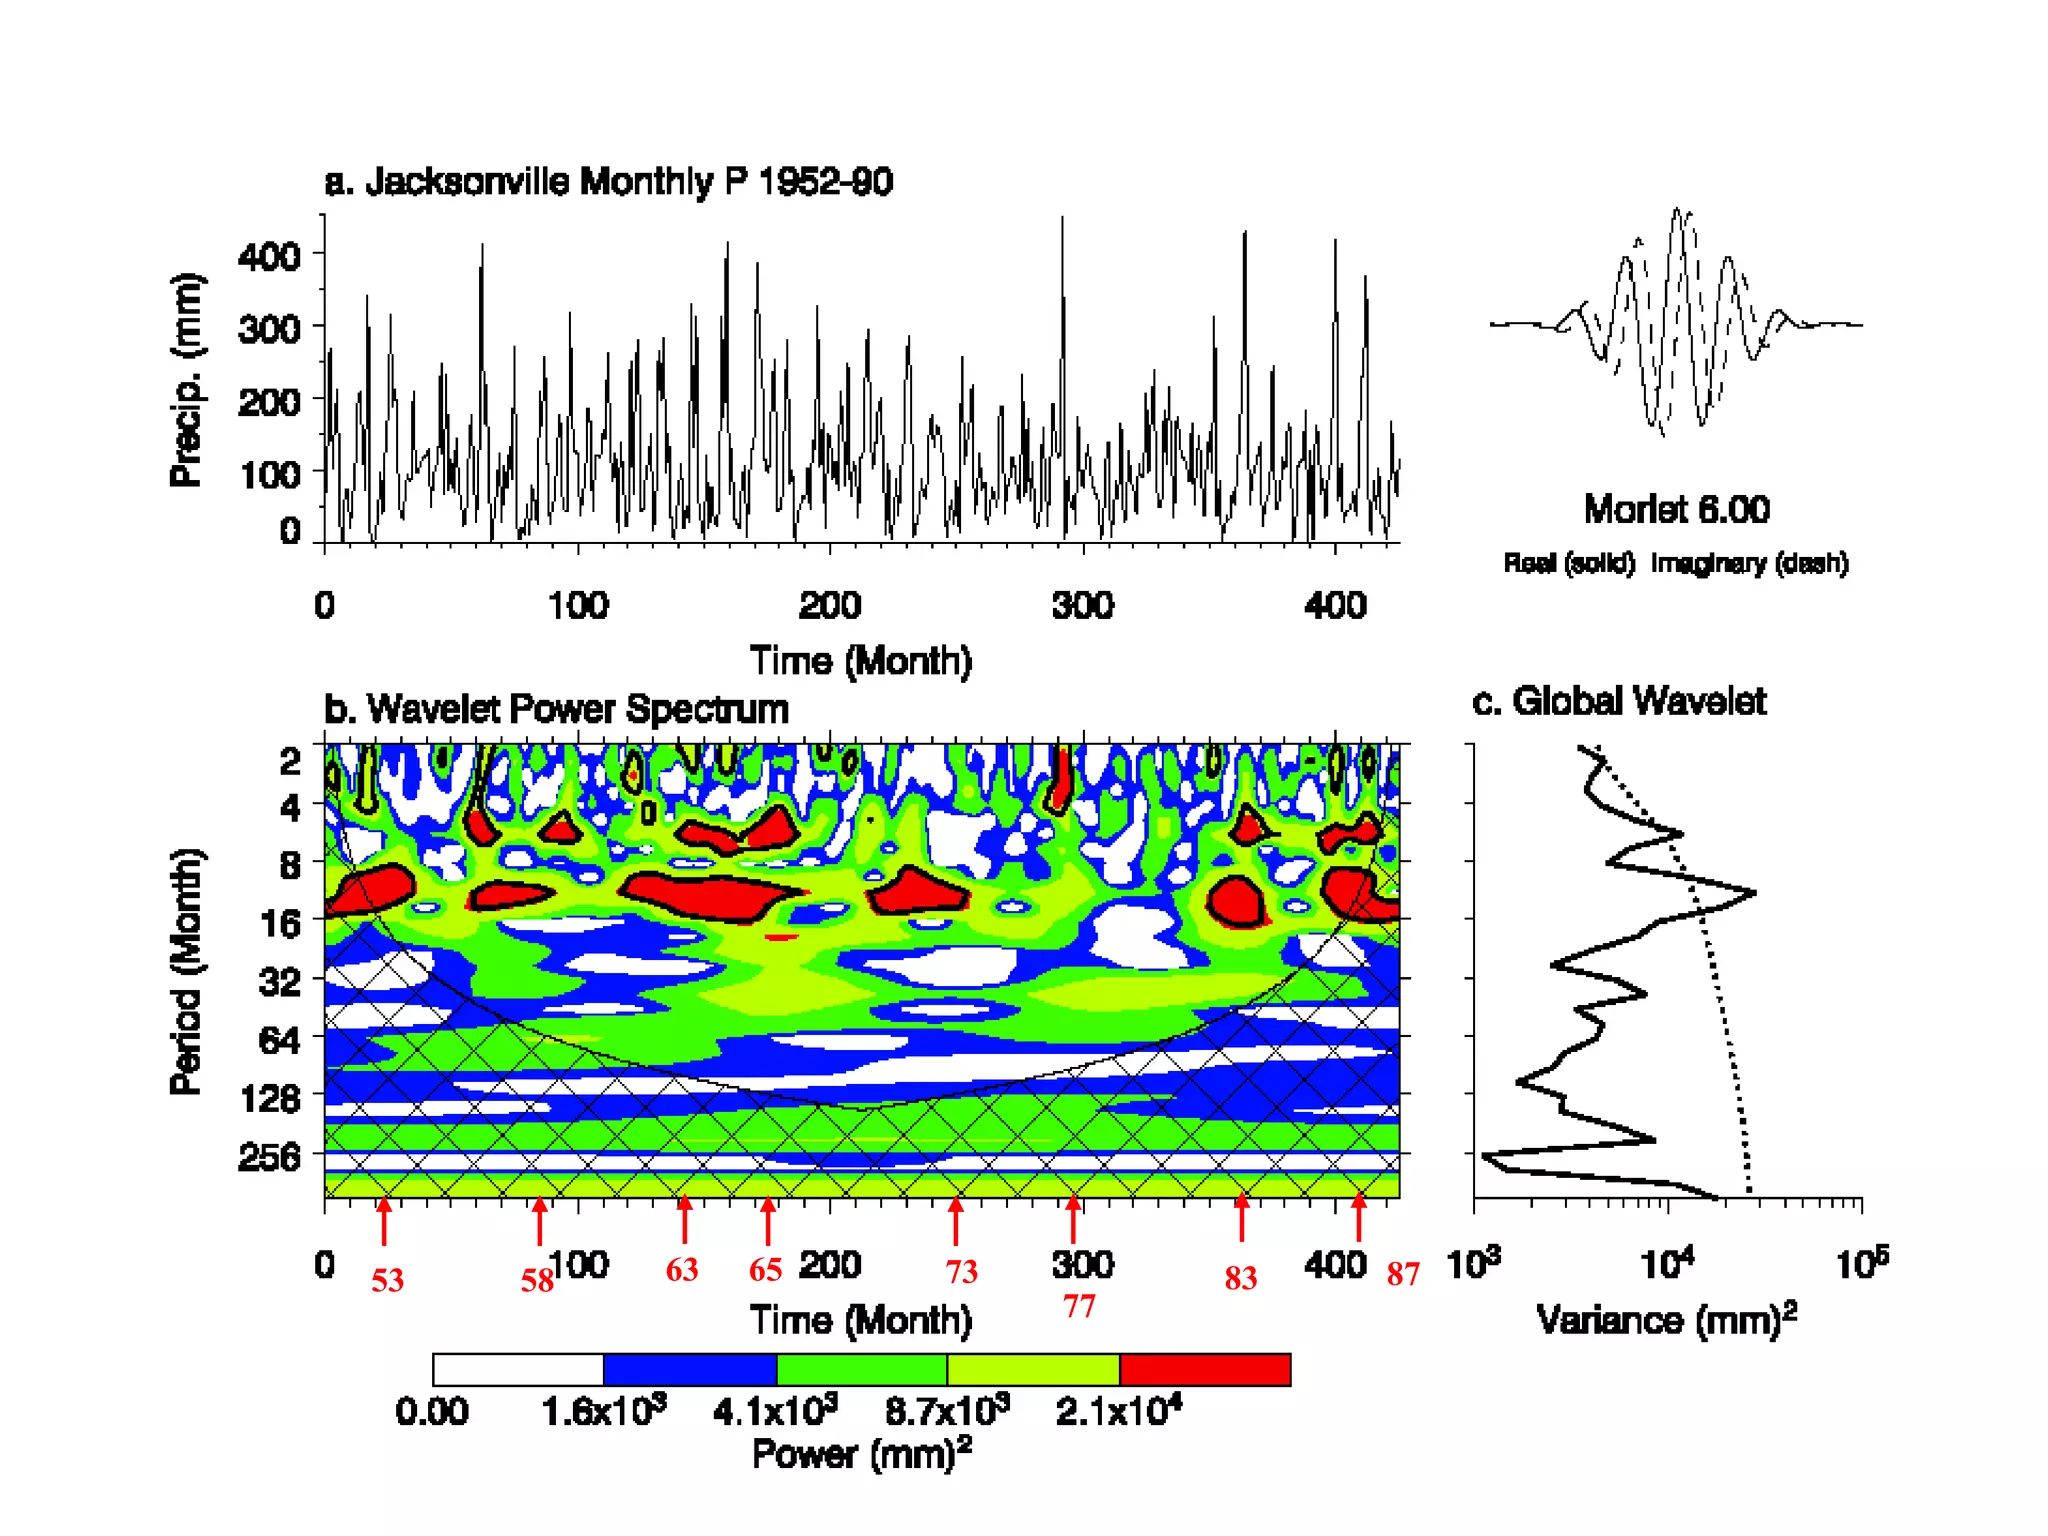
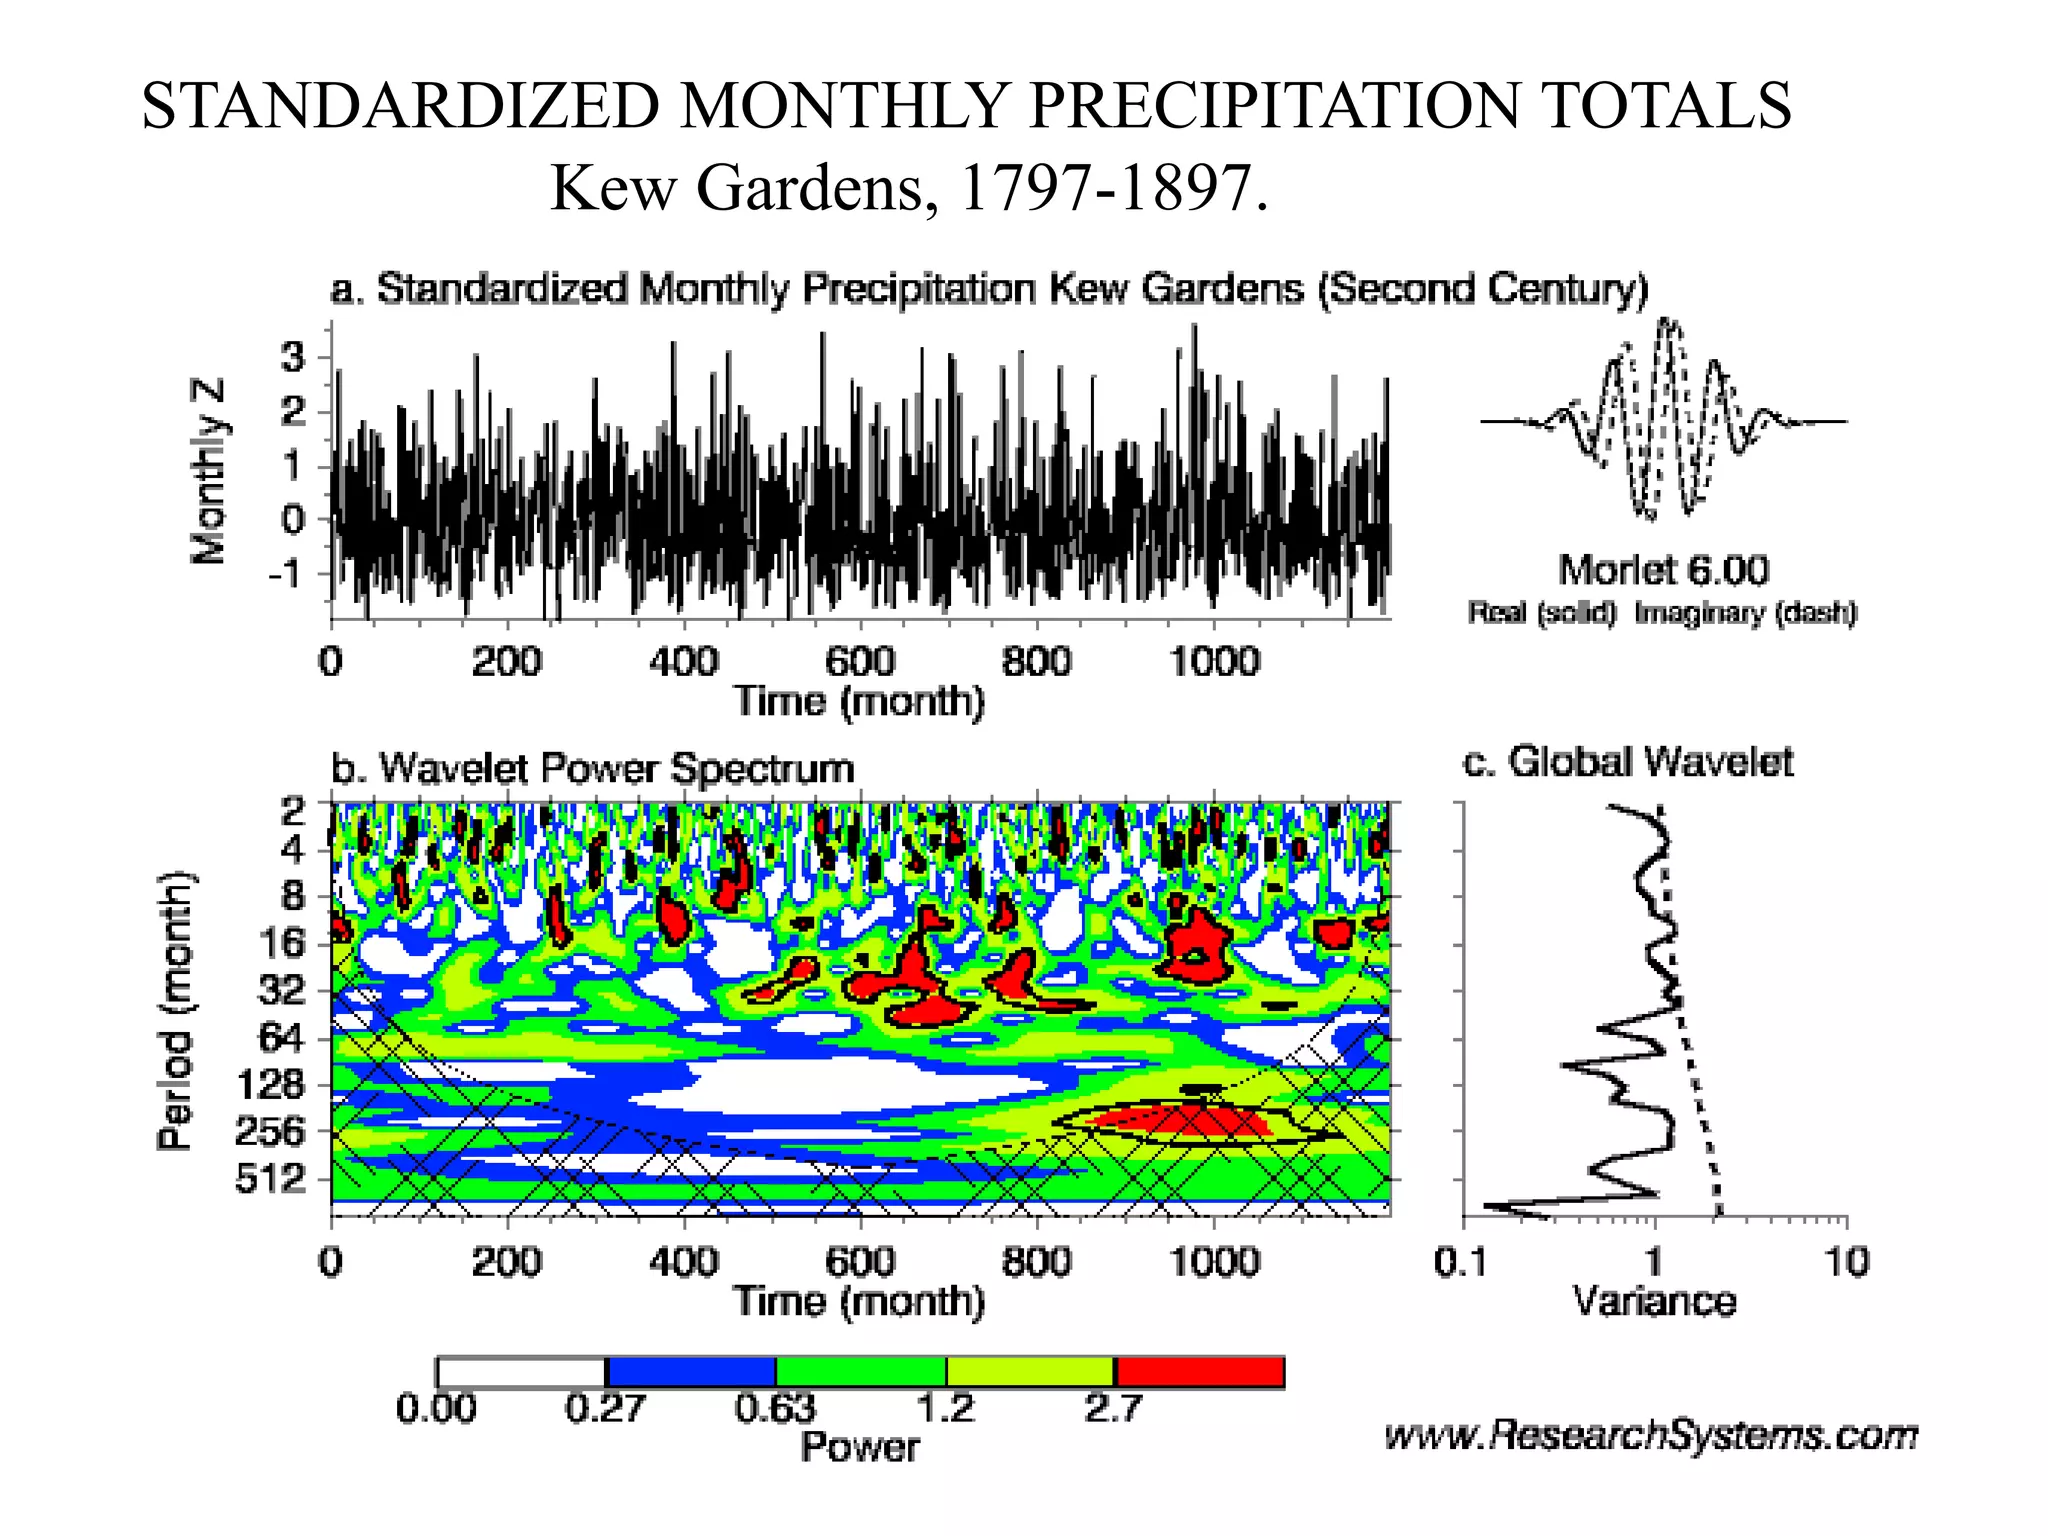
WAVES AND WAVELETS
Shamelessly stolen from R. Greenhalgh, Electrical
Engineering, University of Western Australia.
WINDOWING – SHORT TERM FOURIER TRANSFORM
Frequency
Time
Cumulative Probability (x10-2)
0.1 1 10 30 50 70 90 99 99.9
Annual
Flood
0
200
400
600
800
1000
1200
k = -0.4
k = 0
k = +0.4
 
 
 
 
 
F x k x k
F x x k
k
( ) exp / .............
( ) exp exp / ................
   





 
    
1 0
0
1
 
 
No Differentiation of Process by occurrence in time or frequency
Domain. Purely stochastic process.
Frequency
Time
Simple analysis of Time Series with break down of time
periods but no break down of frequencies within each group.
MENDOZA
Year
1920 1940 1960 1980
Mean
Annual
Discharge
(m
3
s
-1
)
20
40
60
80
100
120
Frequency
Time
10 100 1000
10 100 1000
Relative
Spectral
Density
0.0
0.2
0.4
0.6
0.8
1.0
0.0
0.2
0.4
0.6
0.8
1.0
Simple analysis of frequencies over spectrum periods but
no break down of time and changing frequency characteristics.
Tallahassee Monthly
Precipitation
Frequency
Time
Period (Months)
10
Period (Months)
10
Period (Months)
10
Spectral
Density
1e+5
2e+5
3e+5
Breakdown of spectrum of frequencies over discrete time periods.
Jax 1872-1911 Jax 1912-1951 Jax 1951-1990
Jacksonville Monthly Precipitation
Frequency Characteristics in 3 Time Periods
Period (Months)
10 100
10 100
Spectral
Density
1e+5
2e+5
3e+5
6
12
1872-1911
1912-1951
1952-1990
Period (Months)
10
10
Spectral
Density
1e+5
2e+5
3e+5
6
12
1872-1911
1912-1951
1952-1990
Scale
Time
Various frequencies or “scales”applied repetitively over appropriate
(to “scale”) time periods.
Scale
Time
Basic wavelet form applied over various time scales by “extending” and
“compressing” wavelet over different time periods observations. Compression/ extension
Being analogous to various periods of oscillation.
1872 1882 1892 1902 1911
1872 1882 1892 1902 1911
53 58 63 65 73
77
83 87
Wenchi, 1950-2001.
Month
1 2 3 4 5 6 7 8 9 10 11 12
Monthly
Precipitation
(mm)
0
100
200
300
400
500
ANNUAL AND SEASONAL
PRECIPITATION TOTALS
Wenchi, 1950-2001.
Year
1950 1960 1970 1980 1990 2000
Precipittaion
Total
(mm)
0
200
400
600
800
1000
1200
1400
1600
1800
2000
Annual
AMJ
JA
SO
Regression
Lines
PERCENTAGE OF ANNUAL
PRECIPITATION FALLING
IN EACH SEASON.
Wenchi, 1950-2001.
Year
1950 1960 1970 1980 1990 2000
Percentage
of
Annual
Precipitation
0
10
20
30
40
50
60
70
AMJ
JA
SO
Regression Lines
WENCHI
Month
1 2 3 4 5 6 7 8 9 10 11 12
Monthly
Precipitation
(mm)
0
100
200
300
400
500
1950-1969
1980-2000
STANDARDIZED MONTHLY PRECIPITATION TOTALS
Kew Gardens, 1697-1797.
STANDARDIZED MONTHLY PRECIPITATION TOTALS
Kew Gardens, 1797-1897.
STANDARDIZED MONTHLY PRECIPITATION TOTALS
Kew Gardens, 1897-1980.

Wavelet analysis.ppt

  • 1.
    WAVES AND WAVELETS Shamelesslystolen from R. Greenhalgh, Electrical Engineering, University of Western Australia.
  • 2.
    WINDOWING – SHORTTERM FOURIER TRANSFORM
  • 3.
    Frequency Time Cumulative Probability (x10-2) 0.11 10 30 50 70 90 99 99.9 Annual Flood 0 200 400 600 800 1000 1200 k = -0.4 k = 0 k = +0.4           F x k x k F x x k k ( ) exp / ............. ( ) exp exp / ................                 1 0 0 1     No Differentiation of Process by occurrence in time or frequency Domain. Purely stochastic process.
  • 4.
    Frequency Time Simple analysis ofTime Series with break down of time periods but no break down of frequencies within each group. MENDOZA Year 1920 1940 1960 1980 Mean Annual Discharge (m 3 s -1 ) 20 40 60 80 100 120
  • 5.
    Frequency Time 10 100 1000 10100 1000 Relative Spectral Density 0.0 0.2 0.4 0.6 0.8 1.0 0.0 0.2 0.4 0.6 0.8 1.0 Simple analysis of frequencies over spectrum periods but no break down of time and changing frequency characteristics. Tallahassee Monthly Precipitation
  • 6.
    Frequency Time Period (Months) 10 Period (Months) 10 Period(Months) 10 Spectral Density 1e+5 2e+5 3e+5 Breakdown of spectrum of frequencies over discrete time periods. Jax 1872-1911 Jax 1912-1951 Jax 1951-1990
  • 7.
    Jacksonville Monthly Precipitation FrequencyCharacteristics in 3 Time Periods Period (Months) 10 100 10 100 Spectral Density 1e+5 2e+5 3e+5 6 12 1872-1911 1912-1951 1952-1990 Period (Months) 10 10 Spectral Density 1e+5 2e+5 3e+5 6 12 1872-1911 1912-1951 1952-1990
  • 8.
    Scale Time Various frequencies or“scales”applied repetitively over appropriate (to “scale”) time periods.
  • 9.
    Scale Time Basic wavelet formapplied over various time scales by “extending” and “compressing” wavelet over different time periods observations. Compression/ extension Being analogous to various periods of oscillation.
  • 11.
    1872 1882 18921902 1911 1872 1882 1892 1902 1911
  • 13.
    53 58 6365 73 77 83 87
  • 14.
    Wenchi, 1950-2001. Month 1 23 4 5 6 7 8 9 10 11 12 Monthly Precipitation (mm) 0 100 200 300 400 500
  • 15.
    ANNUAL AND SEASONAL PRECIPITATIONTOTALS Wenchi, 1950-2001. Year 1950 1960 1970 1980 1990 2000 Precipittaion Total (mm) 0 200 400 600 800 1000 1200 1400 1600 1800 2000 Annual AMJ JA SO Regression Lines
  • 16.
    PERCENTAGE OF ANNUAL PRECIPITATIONFALLING IN EACH SEASON. Wenchi, 1950-2001. Year 1950 1960 1970 1980 1990 2000 Percentage of Annual Precipitation 0 10 20 30 40 50 60 70 AMJ JA SO Regression Lines
  • 17.
    WENCHI Month 1 2 34 5 6 7 8 9 10 11 12 Monthly Precipitation (mm) 0 100 200 300 400 500 1950-1969 1980-2000
  • 21.
    STANDARDIZED MONTHLY PRECIPITATIONTOTALS Kew Gardens, 1697-1797.
  • 22.
    STANDARDIZED MONTHLY PRECIPITATIONTOTALS Kew Gardens, 1797-1897.
  • 23.
    STANDARDIZED MONTHLY PRECIPITATIONTOTALS Kew Gardens, 1897-1980.