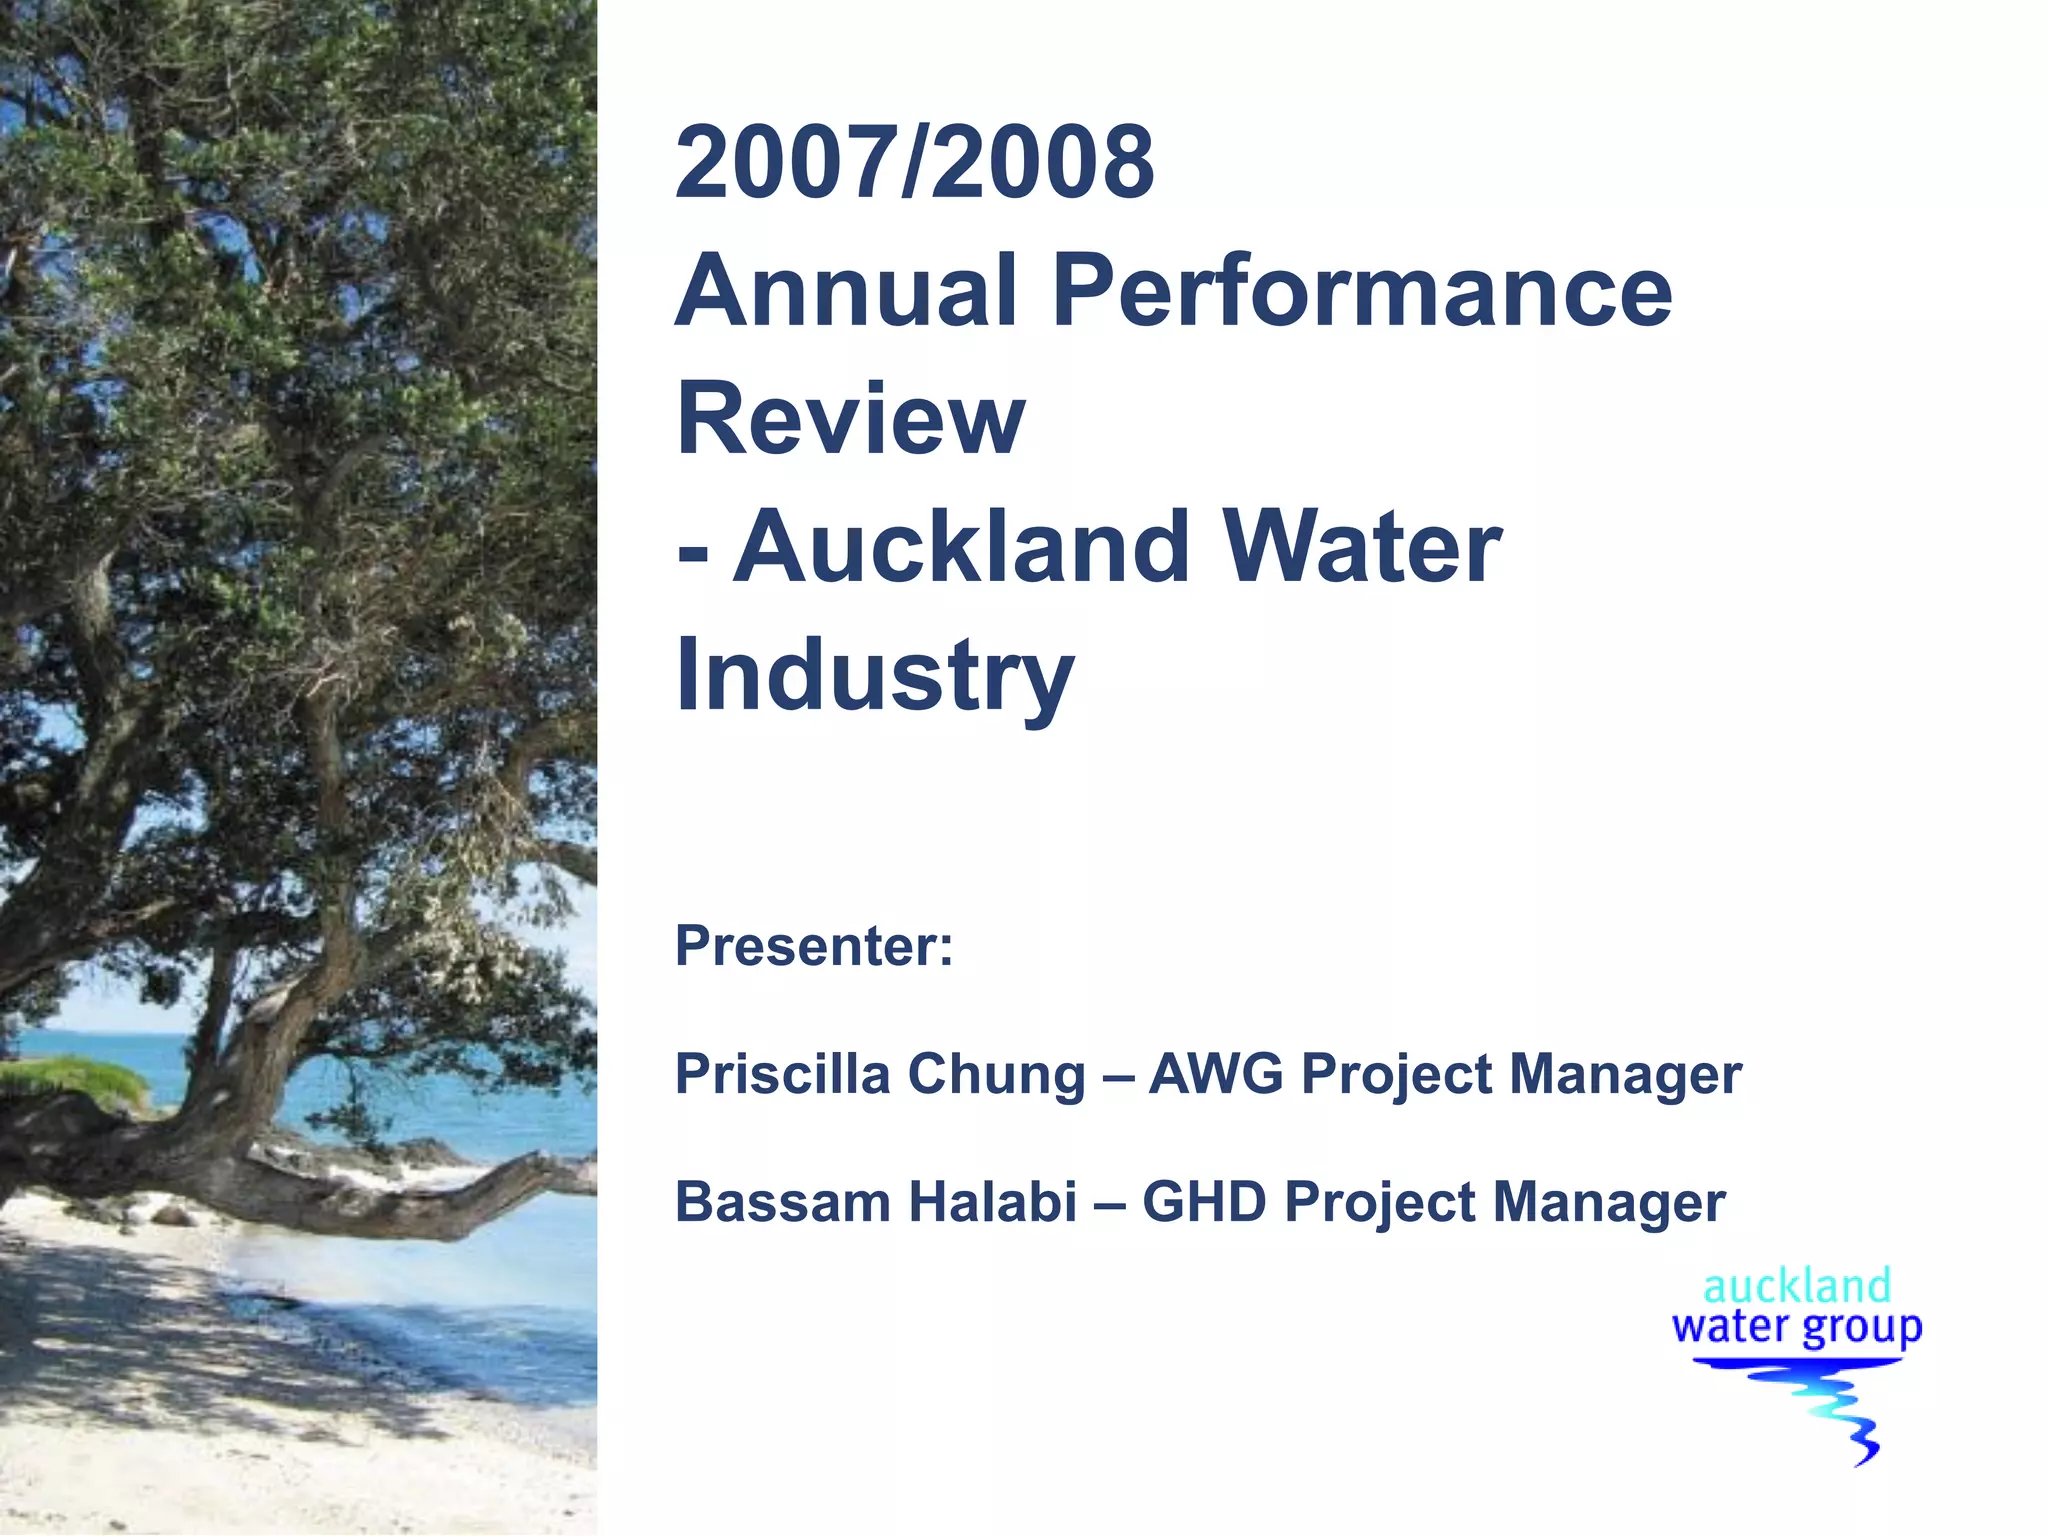
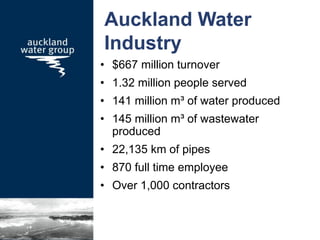
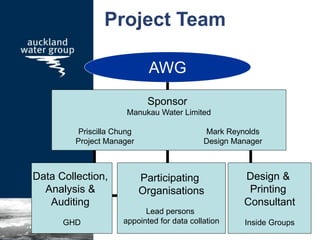
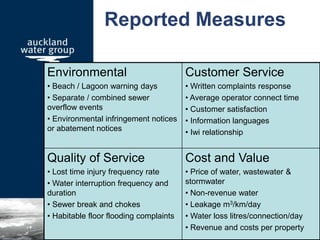
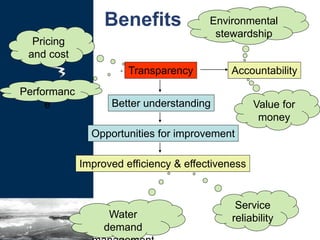
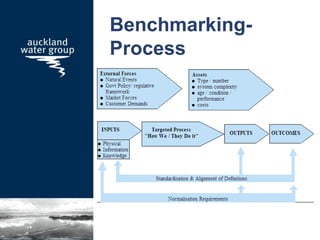
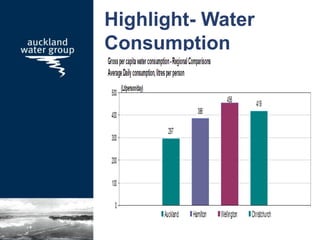
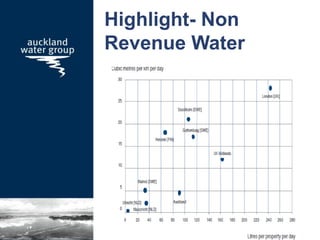
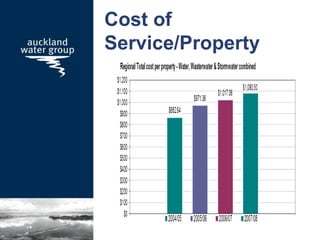
2007/2008
Annual Performance
Review
- Auckland Water
Industry
Presenter:
Priscilla Chung – AWG Project Manager
Bassam Halabi – GHD Project Manager
Presentation Outline
Part 1 – Priscilla Chung
• Introduction
• Objectives
• Project Management Structure
• Programme
• Benefits
Part 2 – Bassam Halabi
• Benchmarking
• Selected results from the Auckland
annual performance review
Part 1
Presented by
Priscilla Chung
Manukau Water Limited
AWG Project Manager
Participants
• $667 million turnover
• 1.32 million people served
• 141 million m³ of water produced
• 145 million m³ of wastewater
produced
• 22,135 km of pipes
• 870 full time employee
• Over 1,000 contractors
Auckland Water
Industry
Purpose
TRANSPARANCY
IN PERFORMANCE
Knowledge
Exchange
Reporting
Facts to Customers
Celebrate
Regional
Achievements
Benchmarking
Accountability
Continuous
Improvement
Project Team
AWG
Sponsor
Manukau Water Limited
Priscilla Chung Mark Reynolds
Project Manager Design Manager
Participating
Organisations
Lead persons
appointed for data collation
Data Collection,
Analysis &
Auditing
GHD
Design &
Printing
Consultant
Inside Groups
Report
Can be downloaded in the following link:
http://www.manukauwater.co.nz/About%20Manukau%20Water/reports_and_publications.htm
Reported Measures
Environmental
• Beach / Lagoon warning days
• Separate / combined sewer
overflow events
• Environmental infringement notices
or abatement notices
Customer Service
• Written complaints response
• Average operator connect time
• Customer satisfaction
• Information languages
• Iwi relationship
Quality of Service
• Lost time injury frequency rate
• Water interruption frequency and
duration
• Sewer break and chokes
• Habitable floor flooding complaints
Cost and Value
• Price of water, wastewater &
stormwater
• Non-revenue water
• Leakage m3/km/day
• Water loss litres/connection/day
• Revenue and costs per property
Launching Function
Media Coverage
Benefits
Transparency Accountability
Better understanding
Opportunities for improvement
Improved efficiency & effectiveness
Pricing
and cost
Performanc
e Value for
money
Environmental
stewardship
Service
reliabilityWater
demand
Part 2
Presented by
Bassam Halabi
GHD Limtied
Consultant Project
Manager
Benchmarking-
Process
Highlight- Water
Consumption
Highlight- Non
Revenue Water
Cost of
Service/Property
Cost of Service/
Property-Breakdown
Stormawater
21%
Wastewater
45%
Water
34%
Price for Standard
Residential User
(200m3/yr)
Effective Weighted Average Costs for Standard Residential User
$243 $250 $259 $261 $256 $268 $279
$354 $380 $392 $392 $383 $370 $378 $394 $420
$254$257
$597
$640 $624 $633
$662
$699$597 $609 $628 $645 $654 $668 $685
$708 $720
$653$651$630
5.59%4.52%1.50%-2.50%-2.0%0.3%3.3%5.5%
$-
$100
$200
$300
$400
$500
$600
$700
$800
1999/00 2000/01 2001/02 2002/03 2003/04 2004/05 2005/06 2006/07 2007/08
Total Charge p.a. inc GST
Water Charge Wastewater Charge % Annual nominal cost increase
CPIadjusted costs from 1999/2000 % Annual nominal cost increase
Prices of Other
Services/Residential
Household
$/annum
Water $ 279
Wastewater $ 420
Telecommunications $ 1,502
Petrol $ 1,981
Cost / Revenue
Ratio
Other Measures
• Environmental – clean beaches,
sewer overflows, infringements
• Customer service – complaints,
call centre, charter, satisfaction,
stakeholders
• Quality of service – lost of injury
frequency rate, interruptions,
flooding
• Details are in the report
Final Notes
• The Auckland water industry led the
way in New Zealand with its first
publication six years ago
• Benchmarking has helped the AWG to
improve water services across the
region
• Water consumption in AK is one of the
lowest in the Country
• Transparency helps to demonstrate
value for money
• More work is required to balance cost
vs revenue for stormwater service
Thank You

WaterNZ Conference AWIO Presentation- draft 3 08-09

  • 1.
    2007/2008 Annual Performance Review - AucklandWater Industry Presenter: Priscilla Chung – AWG Project Manager Bassam Halabi – GHD Project Manager
  • 2.
    Presentation Outline Part 1– Priscilla Chung • Introduction • Objectives • Project Management Structure • Programme • Benefits Part 2 – Bassam Halabi • Benchmarking • Selected results from the Auckland annual performance review
  • 3.
    Part 1 Presented by PriscillaChung Manukau Water Limited AWG Project Manager
  • 4.
  • 5.
    • $667 millionturnover • 1.32 million people served • 141 million m³ of water produced • 145 million m³ of wastewater produced • 22,135 km of pipes • 870 full time employee • Over 1,000 contractors Auckland Water Industry
  • 6.
    Purpose TRANSPARANCY IN PERFORMANCE Knowledge Exchange Reporting Facts toCustomers Celebrate Regional Achievements Benchmarking Accountability Continuous Improvement
  • 7.
    Project Team AWG Sponsor Manukau WaterLimited Priscilla Chung Mark Reynolds Project Manager Design Manager Participating Organisations Lead persons appointed for data collation Data Collection, Analysis & Auditing GHD Design & Printing Consultant Inside Groups
  • 8.
    Report Can be downloadedin the following link: http://www.manukauwater.co.nz/About%20Manukau%20Water/reports_and_publications.htm
  • 9.
    Reported Measures Environmental • Beach/ Lagoon warning days • Separate / combined sewer overflow events • Environmental infringement notices or abatement notices Customer Service • Written complaints response • Average operator connect time • Customer satisfaction • Information languages • Iwi relationship Quality of Service • Lost time injury frequency rate • Water interruption frequency and duration • Sewer break and chokes • Habitable floor flooding complaints Cost and Value • Price of water, wastewater & stormwater • Non-revenue water • Leakage m3/km/day • Water loss litres/connection/day • Revenue and costs per property
  • 10.
  • 11.
  • 12.
    Benefits Transparency Accountability Better understanding Opportunitiesfor improvement Improved efficiency & effectiveness Pricing and cost Performanc e Value for money Environmental stewardship Service reliabilityWater demand
  • 13.
    Part 2 Presented by BassamHalabi GHD Limtied Consultant Project Manager
  • 14.
  • 15.
  • 16.
  • 17.
  • 18.
  • 19.
    Price for Standard ResidentialUser (200m3/yr) Effective Weighted Average Costs for Standard Residential User $243 $250 $259 $261 $256 $268 $279 $354 $380 $392 $392 $383 $370 $378 $394 $420 $254$257 $597 $640 $624 $633 $662 $699$597 $609 $628 $645 $654 $668 $685 $708 $720 $653$651$630 5.59%4.52%1.50%-2.50%-2.0%0.3%3.3%5.5% $- $100 $200 $300 $400 $500 $600 $700 $800 1999/00 2000/01 2001/02 2002/03 2003/04 2004/05 2005/06 2006/07 2007/08 Total Charge p.a. inc GST Water Charge Wastewater Charge % Annual nominal cost increase CPIadjusted costs from 1999/2000 % Annual nominal cost increase
  • 20.
    Prices of Other Services/Residential Household $/annum Water$ 279 Wastewater $ 420 Telecommunications $ 1,502 Petrol $ 1,981
  • 21.
  • 22.
    Other Measures • Environmental– clean beaches, sewer overflows, infringements • Customer service – complaints, call centre, charter, satisfaction, stakeholders • Quality of service – lost of injury frequency rate, interruptions, flooding • Details are in the report
  • 23.
    Final Notes • TheAuckland water industry led the way in New Zealand with its first publication six years ago • Benchmarking has helped the AWG to improve water services across the region • Water consumption in AK is one of the lowest in the Country • Transparency helps to demonstrate value for money • More work is required to balance cost vs revenue for stormwater service
  • 24.