Download as PDF, PPTX

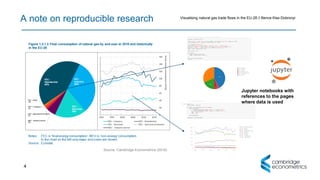
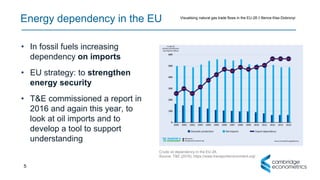
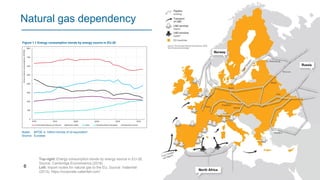
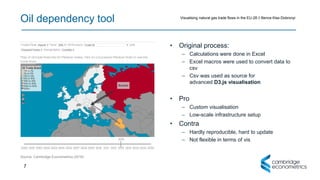


The document outlines a presentation by Bence Kiss-Dobronyi from Cambridge Econometrics on visualizing natural gas trade flows in the EU-28, emphasizing the need for better energy dependency analysis. It compares previous methods using Excel with a new Python-based approach that allows for reproducible and flexible research while maintaining comprehensive data visualization. The presentation highlights energy dependency issues in the EU and the advancements made in integrating data processing and visualization tools.


