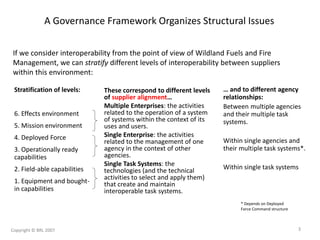
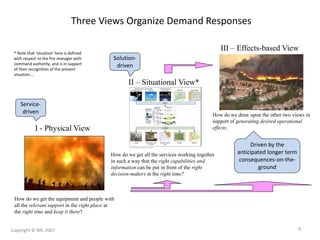
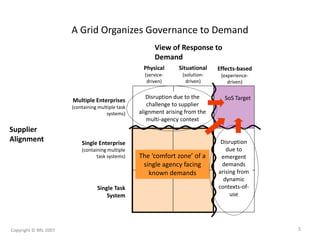
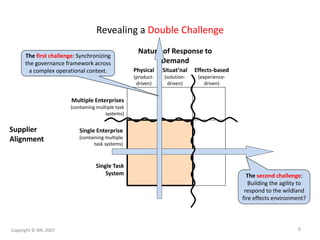
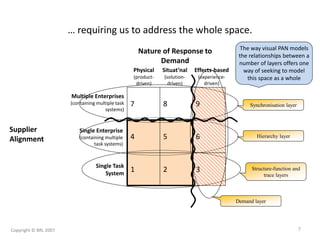
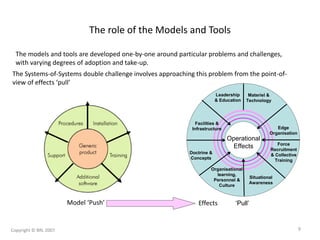
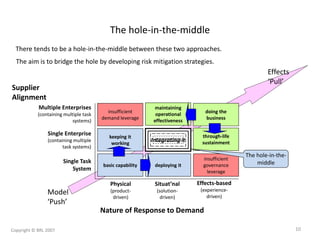
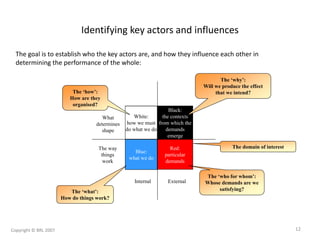
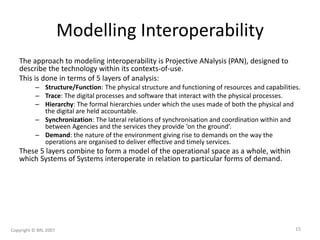
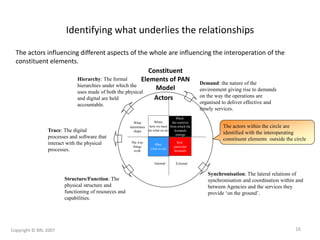
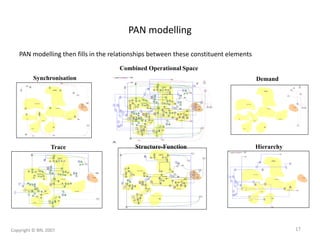
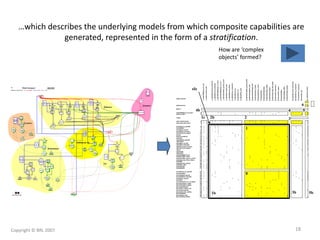
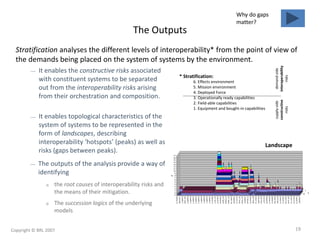
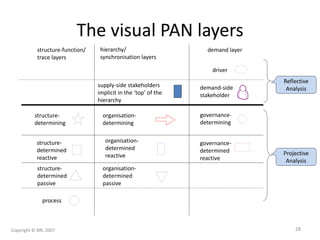
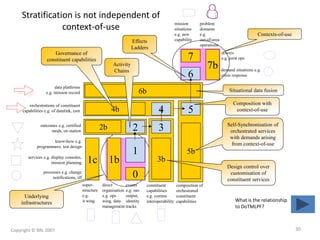
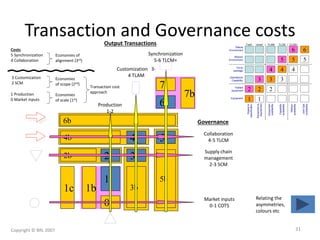
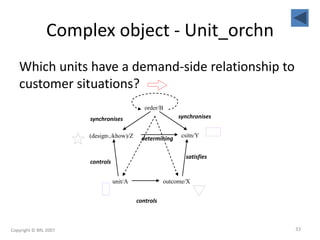
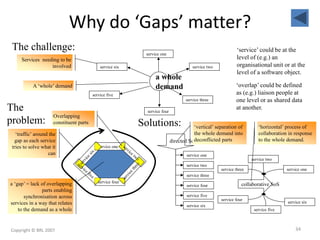
SlideShare a Scribd company logo
1 of 39
Visual Modeling using
projective analysis (PAN)
Philip Boxer
April 20th 2007
Copyright © BRL 2007 1
The ‘double challenge’ space
Copyright © BRL 2007 2
A Governance Framework Organizes Structural Issues
These correspond to different levels
of supplier alignment…
Multiple Enterprises: the activities
related to the operation of a system
of systems within the context of its
uses and users.
Single Enterprise: the activities
related to the management of one
agency in the context of other
agencies.
Single Task Systems: the
technologies (and the technical
activities to select and apply them)
that create and maintain
interoperable task systems.
… and to different agency
relationships:
Between multiple agencies
and their multiple task
systems.
Within single agencies and
their multiple task systems*.
Within single task systems
If we consider interoperability from the point of view of Wildland Fuels and Fire
Management, we can stratify different levels of interoperability between suppliers
within this environment:
Stratification of levels:
6. Effects environment
5. Mission environment
4. Deployed Force
3. Operationally ready
capabilities
2. Field-able capabilities
1. Equipment and bought-
in capabilities
* Depends on Deployed
Force Command structure
Copyright © BRL 2007 3
Three Views Organize Demand Responses
Service-
driven
Solution-
driven
Driven by the
anticipated longer term
consequences-on-the-
ground
I - Physical View
How do we get the equipment and people with
all the relevant support in the right place at
the right time and keep it there?
How do we get all the services working together
in such a way that the right capabilities and
information can be put in front of the right
decision-makers at the right time?
II – Situational View*
* Note that ‘situation’ here is defined
with respect to the fire manager with
command authority, and is in support
of their recognition of the present
situation….
III – Effects-based View
How do we draw upon the other two views in
support of generating desired operational
effects.
Copyright © BRL 2007 4
A Grid Organizes Governance to Demand
View of Response to
Demand
Physical
(service-
driven)
Situational
(solution-
driven)
Effects-based
(experience-
driven)
Supplier
Alignment
Single Task
System
Single Enterprise
(containing multiple
task systems)
Multiple Enterprises
(containing multiple task
systems)
The ‘comfort zone’ of a
single agency facing
known demands
Disruption due to the
challenge to supplier
alignment arising from the
multi-agency context
Disruption
due to
emergent
demands
arising from
dynamic
contexts-of-
use
SoS Target
Copyright © BRL 2007 5
Revealing a Double Challenge
Supplier
Alignment
Nature of Response to
Demand
Physical
(product-
driven)
Situat’nal
(solution-
driven)
Effects-based
(experience-
driven)
Single Task
System
Single Enterprise
(containing multiple
task systems)
Multiple Enterprises
(containing multiple task
systems)
The second challenge:
Building the agility to
respond to the wildland
fire effects environment?
The first challenge: Synchronizing
the governance framework across
a complex operational context.
Copyright © BRL 2007 6
… requiring us to address the whole space.
Hierarchy layer
Structure-function and
trace layers
Synchronisation layer
321
654
987
Demand layer
Supplier
Alignment
Nature of Response to
Demand
Physical
(product-
driven)
Situat’nal
(solution-
driven)
Effects-based
(experience-
driven)
Single Task
System
Single Enterprise
(containing multiple
task systems)
Multiple Enterprises
(containing multiple task
systems)
The way visual PAN models
the relationships between a
number of layers offers one
way of seeking to model
this space as a whole
Copyright © BRL 2007 7
Where does the technology fit
in?!
Copyright © BRL 2007 8
The role of the Models and Tools
Model ‘Push’
The models and tools are developed one-by-one around particular problems and challenges,
with varying degrees of adoption and take-up.
The Systems-of-Systems double challenge involves approaching this problem from the point-of-
view of effects ‘pull’
Effects ‘Pull’
Operational
Effects
Situational
Awareness
Materiel &
Technology
Organisational
learning,
Personnel &
Culture
Edge
Organisation
Leadership
& Education
Force
Recruitment
& Collective
Training
Facilities &
Infrastructure
Doctrine &
Concepts
‘Pull’
Operational
Effects
Situational
Awareness
Materiel &
Technology
Organisational
learning,
Personnel &
Culture
Edge
Organisation
Leadership
& Education
Force
Recruitment
& Collective
Training
Facilities &
Infrastructure
Doctrine &
Concepts
Copyright © BRL 2007 9
There tends to be a hole-in-the-middle between these two approaches.
Model
‘Push’
Effects
‘Pull’
basic capability
keeping it
working
deploying it
insufficient
demand leverage
insufficient
governance
leverage
doing the
business
maintaining
operational
effectiveness
through-life
sustainment
The hole-in-the-middle
Supplier
Alignment
Nature of Response to Demand
Physical
(product-
driven)
Situat’nal
(solution-
driven)
Effects-based
(experience-
driven)
Single Task
System
Single Enterprise
(containing multiple
task systems)
Multiple Enterprises
(containing multiple task
systems)
Integrating it
The hole-in-the-
middle
The aim is to bridge the hole by developing risk mitigation strategies.
Copyright © BRL 2007 10
The ‘I’ position from which a PAN
model is built
Copyright © BRL 2007 11
The domain of interest
White:
how we must
do what we do
Blue:
what we do
Internal External
Red:
particular
demands
Black:
the contexts
from which the
demands
emerge
The way
things
work
What
determines
shape
The ‘who for whom’:
Whose demands are we
satisfying?
The ‘why’:
Will we produce the effect
that we intend?
The ‘what’:
How do things work?
The ‘how’:
How are they
organised?
Identifying key actors and influences
The goal is to establish who the key actors are, and how they influence each other in
determining the performance of the whole:
Copyright © BRL 2007 12
Moving from Influence Mapping into Projective ANalysis
B: (influence maps) hierarchy
layer
C1: (actor-centric PAN) +
synchronisation, structure-function
& trace layers
C2: (demand-centric PAN) +
demand layer
D: (zones of interoperability)
landscapes & risk identification
E: (zone metrics) +
behavior/deontics
Actors, world views x ontologies (4-colours), issues, time-lines
Any currently available material on how the organisation works
Scenarios, ladders, event sequences, orchestration/composition
Stratification, slicing, landscapes and risk identification
e.g. the interface to other M&S approaches
Process
itself
A: consulting team’s pre-work
These layers
can all be
described as
topologies
These require
the addition
of
behaviours/
deontics to
the
topologies
Copyright © BRL 2007 13
The modelling framework
Copyright © BRL 2007 14
Modelling Interoperability
The approach to modeling interoperability is Projective ANalysis (PAN), designed to
describe the technology within its contexts-of-use.
This is done in terms of 5 layers of analysis:
– Structure/Function: The physical structure and functioning of resources and capabilities.
– Trace: The digital processes and software that interact with the physical processes.
– Hierarchy: The formal hierarchies under which the uses made of both the physical and
the digital are held accountable.
– Synchronization: The lateral relations of synchronisation and coordination within and
between Agencies and the services they provide ‘on the ground’.
– Demand: the nature of the environment giving rise to demands on the way the
operations are organised to deliver effective and timely services.
These 5 layers combine to form a model of the operational space as a whole, within
which Systems of Systems interoperate in relation to particular forms of demand.
Copyright © BRL 2007 15
Identifying what underlies the relationships
The actors influencing different aspects of the whole are influencing the interoperation of the
constituent elements.
Hierarchy: The formal
hierarchies under which the
uses made of both the physical
and digital are held
accountable.
Demand: the nature of the
environment giving rise to demands
on the way the operations are
organised to deliver effective and
timely services.
Synchronisation: The lateral relations of
synchronisation and coordination within and
between Agencies and the services they
provide ‘on the ground’.
Structure/Function: The
physical structure and
functioning of resources and
capabilities.
Trace: The digital
processes and software that
interact with the physical
processes.
Actors
The actors within the circle are
identified with the interoperating
constituent elements outside the circle
Constituent
Elements of PAN
Model
White:
how we must
do what we do
Blue:
what we do
Internal External
Red:
particular
demands
Black:
the contexts
from which the
demands
emerge
The way
things
work
What
determines
shape
Copyright © BRL 2007 16
Synchronisation
Trace Structure-Function Hierarchy
Demand
Combined Operational Space
PAN modelling
PAN modelling then fills in the relationships between these constituent elements
Copyright © BRL 2007 17
…which describes the underlying models from which composite capabilities are
generated, represented in the form of a stratification.
1
0
1b
22b1c
3b
4b
3
4 5
6
5b
sfo
How are ‘complex
objects’ formed?
Copyright © BRL 2007 18
The Outputs
Stratification analyses the different levels of interoperability* from the point of view of
the demands being placed on the system of systems by the environment.
— It enables the constructive risks associated
with constituent systems to be separated
out from the interoperability risks arising
from their orchestration and composition.
Landscape
— The outputs of the analysis provide a way of
identifying
o the root causes of interoperability risks and
the means of their mitigation.
o The succession logics of the underlying
models
supply-side
constructive
risks
demand-side
interoperability
risks
6. Effects environment
5. Mission environment
4. Deployed Force
3. Operationally ready capabilities
2. Field-able capabilities
1. Equipment and bought-in capabilities
* Stratification:
— It enables topological characteristics of the
system of systems to be represented in the
form of landscapes, describing
interoperability ‘hotspots’ (peaks) as well as
risks (gaps between peaks).
Why do gaps
matter?
Copyright © BRL 2007 19
The visual syntax
Copyright © BRL 2007 20
Symbols
syncn/dsyncn
unit
outcome
hierarchy/
synchronisation layers
demand-side
stakeholder
demand
situation
driver
customer
situation
demand layer
supplies
dsupplies
determines
ddetermines
frames
dframes
controls
satisfies
drives
contains
capy/system
event/trace
khow/design
process/dprocess
structure-function/
trace layers
Copyright © BRL 2007 21
The visual PAN syntaxStructure-
Function
capabil
ity
kno
w-
how
event
process
outcom
e
A physical process
A capability determining the
behaviour of another capability
or of a process
An event generated by a
process
An outcome generated by a
process, and capable of being
contained by a customer
situation or party to the
satisfaction of a customer
situation.
Know-how that can alter the
way in which other know-how
and capabilities determine
behaviour. Can be party to
satisfying customer situations.
Trace
system
trace
dproces
s
desi
gn
A digital process i.e. a software
process
A digital system that can
determine the behaviour of
another system, a digital process
or a physical process
Design that can alter the way in
which other designs and systems
determine behaviour. Can be
party to satisfying customer
situations.
A digital event created by a
process or a digital process
Hierarchy
unit
A unit of vertical
accountability over all the
entities it controls. (Also
represents their state).
Synchronisation
order
The framing of a horizontal
synchronisation of the
entities it includes
dorder
The digital framing of a
horizontal synchronisation
of the events and traces it
includes
Demand
customer
situation
problem domain
demand
situation
driver
The place from which the
‘I’ of the client system is
formulating its demands
A particular context-of-use
A particular customer
situation within a context-
of-use representing a
particular formulation of a
demand within that
context. (Also represents
the state of the demand).
A driver determining the
nature of the satisfaction
demanded by a customer
situation
How are legal
relations defined?
Copyright © BRL 2007 22
Structure-Function-Trace
Copyright © BRL 2007 23
activity/ trace
chains
contains
contains
contains
drives
demand
organisation
Relations between symbols
determines
determines
determines
controlscontrols
controls
contains
controls
ddetermines
ddetermines
ddetermines
frames
determines
supplies
Used to represent the sourcing
of infrastructure & know-how
dsupplies
state data
dframes dframes
controls
situational data
dsupplies
dsupplies
dsupplies
dsupplies
frames
satisfies
An outcome that
can satisfy must be
accompanied by
know-how
The super-ordinate unit is a
supply-side actor
supplies supplies
supplies
Copyright © BRL 2007 24
hierarchytrace
synchronisation demand
structure-function
composite
Wildfire middle-out
Copyright © BRL 2007 25
Why these symbols?
Copyright © BRL 2007 26
What the modeller models
boundary perimeter
3rd order
2nd order
deterministic
structure-
determined
reactive*
structure-
determined
passive*
Process*
edge
deterministic
structure-
determining*
organisation-
determined
reactive
organisation-
determined
passive
non-deterministic
deterministic
organisation-
determining
governance-
determined
reactive
non-deterministic
stakeholder
governance-
determining
driver
non-deterministic
On the supply-side,
the stakeholder is
represented as the
top of a hierarchy
closures
1st order
Modeller’s model of the system-of-interest:
How does this relate
to DoDAF?
stakeholder
Copyright © BRL 2007 27
The visual PAN layers
structure-
determined
reactive
structure-
determined
passive
structure-
determining
process
structure-function/
trace layers
demand-side
stakeholder
governance-
determining
driver
governance-
determined
reactive
demand layerhierarchy/
synchronisation layers
organisation-
determining
organisation-
determined
reactive
organisation-
determined
passive
supply-side stakeholders
implicit in the ‘top’ of the
hierarchy
Projective
Analysis
Reflective
Analysis
Copyright © BRL 2007 28
What is the stratification?
Copyright © BRL 2007 29
1c
super-
structure
e.g.
it wing
Contexts-of-use
5b
5
composition of
orchestrated
constituent
capabilities
Underlying
infrastructures
Stratification is not independent of
context-of-use
Composition with
context-of-use
Self-Synchronisation of
orchestrated services
with demands arising
from context-of-use
constituent
capabilities
e.g. comms
interoperability
3b
3
7
drivers
e.g. joint ops
7b
problem
domains
e.g.
out-of-area
operations
6
demand situations e.g.
crisis response
mission
situations
e.g. aew
capability
1b
direct
organisation
e.g. ops
wing, data
management
0processes e.g. change
notifications, iff
events
e.g. nav
output,
identity
tracks
1services e.g. display consoles,
mission planning
know-how e.g.
programmers, test design
What is the relationship
to DoTMLPF?
Effects
Ladders
2b 2outcomes e.g. certified
mods, on station
Design control over
customisation of
constituent services
orchestrations of constituent
capabilities e.g. of datalink, esm 4b 4
6b
data platforms
e.g. mission record
Activity
Chains
Governance of
constituent capabilities
Situational data fusion
Copyright © BRL 2007 30
Transaction and Governance costs
7
7b
6
5b
54b 4
2b
3b
2 3
1c 1b
0
1
6b Governance
Output Transactions
Operational
Capability
Force
package
Mission
Environment
1
2
3
Equipmentto
requirement
2
3
4
Equipment
availability
3
4
5
Capability
availability
4
5
6
Mission
availability
Effects
Environment
Equipment
Fielded
equipment
5
6
JointOps
availability
1
2
Supplyto
specification
‘smart’ ‘TLAM’ TLCM TLCM+Trad’l
Collaboration
4-5 TLCM
Supply chain
management
2-3 SCM
Market inputs
0-1 COTS
Production
1-2
Synchronization
5-6 TLCM+
Costs
5 Synchronization
4 Collaboration
Economies of
alignment (3rd)
Customization 3-
4 TLAM
Transaction cost
approach
Economies
of scale (1st)
1 Production
0 Market inputs
Economies
of scope (2nd)
3 Customization
2 SCM
Relating the
asymmetries,
colours etc
Copyright © BRL 2007 31
END
Copyright © BRL 2007 32
order/B
(designkhow)/Z csitn/Y
unit/A outcome/X
Complex object - Unit_orchn
Which units have a demand-side relationship to
customer situations?
satisfies
synchronisessynchronises
controls
controls
determining
Copyright © BRL 2007 33
Overlapping
constituent parts
Why do ‘Gaps’ matter?
a ‘gap’ = lack of overlapping
parts enabling
synchronisation across
services in a way that relates
to the demand as a whole
service four
service one
‘traffic’ around the
gap as each service
tries to solve what it
can
a whole
demandA ‘whole’ demand
service one
service two
service three
service four
service five
service six
Services needing to be
involved
‘service’ could be at the
level of (e.g.) an
organisational unit or at the
level of a software object.
‘overlap’ could be defined
as (e.g.) liaison people at
one level or as shared data
at another.
collaborative SoS
service one
service two
service three
service four
service five
service six
‘horizontal’ process of
collaboration in response
to the whole demand.
The challenge:
The
problem: Solutions:
service one
service two
service three
service four
service five
service six
directed SoS
‘vertical’ separation of
the whole demand into
deconflicted parts
Copyright © BRL 2007 34
Visual PAN Syntax
Copyright © BRL 2007 35
The DLoDs/DoTMLPF
Command
Copyright © BRL 2007 36
Mapping the different schemas
6-level
stratification 1st
2nd
3rd
WHO/M
WHY
HOW
WHAT
Four colours/
causes
7
6
5
4
3
2
1
0
8-level
stratification
The Three Asymmetries: the three forms of
asymmetry forming the basis of competitive
advantage –
3rd – the demand is not the experience,
2nd – the business is not the solution, and
1st – the technology is not the product.
Copyright © BRL 2007 37
modelling
contexts
contexts-of-
governance
contexts-
of-use
modalities
of reality
The Zachman Connection
SCOPE
(Competitive context)
Planning
BUSINESS
MODEL
(Conceptual)
Owning
SYSTEM
MODEL
(Logical)
Designing
TECHNOLOGY
MODEL
(Physical)
Building
DETAILED
REPRESENTATIONS
(out-of-modelling-context)
Subcontracting
DATA
(WHAT)
e.g. data
MOTIVATION
(WHY)
e.g. strategy
TIME
(WHEN)
e.g. schedule
PEOPLE
(WHO)
e.g. organisation
NETWORK
(WHERE)
e.g. network
FUNCTION
(HOW)
e.g. function
USE CONTEXT
(WHO for WHOM)
e.g. particular client
USE CONTEXT
(WHO for WHOM)
e.g. particular client
EVENT
(WHAT)
e.g. things done
EVENT
(WHAT)
e.g. things done
COLLABORATIVE
MODEL
(Pragmatic)
Governing
COLLABORATIVE
MODEL
(Pragmatic)
Governing
Copyright © BRL 2007 38
Source of coloured squares: Zachman
Framework, www.zifa.com
SCOPE
(Competitive context)
Planning
BUSINESS MODEL
(Conceptual)
Owning
SYSTEM
MODEL
(Logical)
Designing
TECHNOLOGY
MODEL
(Physical)
Building
DETAILED
REPRESENTATIONS
(out-of-modelling-context)
Subcontracting
DATA
(WHAT)
e.g. data
MOTIVATION
(WHY)
e.g. strategy
TIME
(WHEN)
e.g. schedule
PEOPLE
(WHO)
e.g. organisation
NETWORK
(WHERE)
e.g. network
FUNCTION
(HOW)
e.g. function
USE CONTEXT
(WHO for WHOM)
e.g. particular client
EVENT
(WHAT)
e.g. things done
COLLABORATIVE
MODEL
(Pragmatic)
Governing
The WHAT The WHYThe WHO/MThe HOW
Copyright © BRL 2007 39

More Related Content

Similar to Visual modeling using projective analysis (pan)

Using the LEADing Practice Capability Reference Content
Using the LEADing Practice Capability Reference ContentUsing the LEADing Practice Capability Reference Content
Using the LEADing Practice Capability Reference ContentGlobal University Alliance
 
Is The Architectures Of The Convnets ) For Action...
Is The Architectures Of The Convnets ) For Action...Is The Architectures Of The Convnets ) For Action...
Is The Architectures Of The Convnets ) For Action...Sheila Guy
 
ALIVE: Combining Organizational and Coordination Theory with Model Driven App...
ALIVE: Combining Organizational and Coordination Theory with Model Driven App...ALIVE: Combining Organizational and Coordination Theory with Model Driven App...
ALIVE: Combining Organizational and Coordination Theory with Model Driven App...Digibiz'09 Conference
 
Presenting an Excusable Model of Enterprise Architecture for Evaluation of R...
Presenting an Excusable Model of Enterprise  Architecture for Evaluation of R...Presenting an Excusable Model of Enterprise  Architecture for Evaluation of R...
Presenting an Excusable Model of Enterprise Architecture for Evaluation of R...Editor IJCATR
 
System Modelling.ppt
System Modelling.pptSystem Modelling.ppt
System Modelling.pptAnishNarayan4
 
2021 the double challenge of requisite agility
2021 the double challenge of requisite agility2021 the double challenge of requisite agility
2021 the double challenge of requisite agilityBoxer Research Ltd
 
Thoughts On Architecting V4 2
Thoughts On Architecting V4 2Thoughts On Architecting V4 2
Thoughts On Architecting V4 2bmercer
 
Object oriented software engineering
Object oriented software engineeringObject oriented software engineering
Object oriented software engineeringVarsha Ajith
 
Practical DoD Architecture Framework (DoDAF) with Innoslate
Practical DoD Architecture Framework (DoDAF) with InnoslatePractical DoD Architecture Framework (DoDAF) with Innoslate
Practical DoD Architecture Framework (DoDAF) with InnoslateElizabeth Steiner
 
An agent based approach for building complex software systems
An agent based approach for building complex software systemsAn agent based approach for building complex software systems
An agent based approach for building complex software systemsIcaro Santos
 
Software requirement analysis enhancements byprioritizing re
Software requirement analysis enhancements byprioritizing reSoftware requirement analysis enhancements byprioritizing re
Software requirement analysis enhancements byprioritizing reAlleneMcclendon878
 
Managing Interdependencies in Complex Organizations
Managing Interdependencies in Complex OrganizationsManaging Interdependencies in Complex Organizations
Managing Interdependencies in Complex OrganizationsNicolay Worren
 

Similar to Visual modeling using projective analysis (pan) (20)

Organic Planning
Organic PlanningOrganic Planning
Organic Planning
 
Using the LEADing Practice Capability Reference Content
Using the LEADing Practice Capability Reference ContentUsing the LEADing Practice Capability Reference Content
Using the LEADing Practice Capability Reference Content
 
Class notes
Class notesClass notes
Class notes
 
Is The Architectures Of The Convnets ) For Action...
Is The Architectures Of The Convnets ) For Action...Is The Architectures Of The Convnets ) For Action...
Is The Architectures Of The Convnets ) For Action...
 
ALIVE: Combining Organizational and Coordination Theory with Model Driven App...
ALIVE: Combining Organizational and Coordination Theory with Model Driven App...ALIVE: Combining Organizational and Coordination Theory with Model Driven App...
ALIVE: Combining Organizational and Coordination Theory with Model Driven App...
 
Presenting an Excusable Model of Enterprise Architecture for Evaluation of R...
Presenting an Excusable Model of Enterprise  Architecture for Evaluation of R...Presenting an Excusable Model of Enterprise  Architecture for Evaluation of R...
Presenting an Excusable Model of Enterprise Architecture for Evaluation of R...
 
System Modelling.ppt
System Modelling.pptSystem Modelling.ppt
System Modelling.ppt
 
2021 the double challenge of requisite agility
2021 the double challenge of requisite agility2021 the double challenge of requisite agility
2021 the double challenge of requisite agility
 
Thoughts On Architecting V4 2
Thoughts On Architecting V4 2Thoughts On Architecting V4 2
Thoughts On Architecting V4 2
 
Object oriented software engineering
Object oriented software engineeringObject oriented software engineering
Object oriented software engineering
 
Practical DoD Architecture Framework (DoDAF) with Innoslate
Practical DoD Architecture Framework (DoDAF) with InnoslatePractical DoD Architecture Framework (DoDAF) with Innoslate
Practical DoD Architecture Framework (DoDAF) with Innoslate
 
uml.pptx
uml.pptxuml.pptx
uml.pptx
 
Chapter 9
Chapter 9Chapter 9
Chapter 9
 
SE chapters 6-7
SE chapters 6-7SE chapters 6-7
SE chapters 6-7
 
Slides chapters 6-7
Slides chapters 6-7Slides chapters 6-7
Slides chapters 6-7
 
Ch07
Ch07Ch07
Ch07
 
Ch07
Ch07Ch07
Ch07
 
An agent based approach for building complex software systems
An agent based approach for building complex software systemsAn agent based approach for building complex software systems
An agent based approach for building complex software systems
 
Software requirement analysis enhancements byprioritizing re
Software requirement analysis enhancements byprioritizing reSoftware requirement analysis enhancements byprioritizing re
Software requirement analysis enhancements byprioritizing re
 
Managing Interdependencies in Complex Organizations
Managing Interdependencies in Complex OrganizationsManaging Interdependencies in Complex Organizations
Managing Interdependencies in Complex Organizations
 

More from Boxer Research Ltd

Thinking psychoanalytically about desire in organizations - why we need a 3rd...
Thinking psychoanalytically about desire in organizations - why we need a 3rd...Thinking psychoanalytically about desire in organizations - why we need a 3rd...
Thinking psychoanalytically about desire in organizations - why we need a 3rd...Boxer Research Ltd
 
Creating value in ecosystems: the place of the well-bounded organisation
Creating value in ecosystems: the place of the well-bounded organisationCreating value in ecosystems: the place of the well-bounded organisation
Creating value in ecosystems: the place of the well-bounded organisationBoxer Research Ltd
 
Governance in Ultra-Large-Scale Systems
Governance in Ultra-Large-Scale SystemsGovernance in Ultra-Large-Scale Systems
Governance in Ultra-Large-Scale SystemsBoxer Research Ltd
 
The impact of governance approaches on system of-system environments
The impact of governance approaches on system of-system environmentsThe impact of governance approaches on system of-system environments
The impact of governance approaches on system of-system environmentsBoxer Research Ltd
 
Building organizational agility into large scale software-reliant environments
Building organizational agility into large scale software-reliant environmentsBuilding organizational agility into large scale software-reliant environments
Building organizational agility into large scale software-reliant environmentsBoxer Research Ltd
 
Systems of systems engineering and the pragmatics of demand
Systems of systems engineering and the pragmatics of demandSystems of systems engineering and the pragmatics of demand
Systems of systems engineering and the pragmatics of demandBoxer Research Ltd
 
Enterprise architecture for complex system of-systems contexts
Enterprise architecture for complex system of-systems contextsEnterprise architecture for complex system of-systems contexts
Enterprise architecture for complex system of-systems contextsBoxer Research Ltd
 
Strategic and economic drivers of governance
Strategic and economic drivers of governanceStrategic and economic drivers of governance
Strategic and economic drivers of governanceBoxer Research Ltd
 
Competing within Ecosystems: determining requisite agility in system-of-syste...
Competing within Ecosystems: determining requisite agility in system-of-syste...Competing within Ecosystems: determining requisite agility in system-of-syste...
Competing within Ecosystems: determining requisite agility in system-of-syste...Boxer Research Ltd
 
Supporting Social Complexity in Collaborative Enterprises
Supporting Social Complexity in Collaborative EnterprisesSupporting Social Complexity in Collaborative Enterprises
Supporting Social Complexity in Collaborative EnterprisesBoxer Research Ltd
 
Enterprise Architecture and Governance
Enterprise Architecture and GovernanceEnterprise Architecture and Governance
Enterprise Architecture and GovernanceBoxer Research Ltd
 

More from Boxer Research Ltd (17)

2021 working beyond the pale
2021 working beyond the pale2021 working beyond the pale
2021 working beyond the pale
 
En gendering leadership
En gendering leadershipEn gendering leadership
En gendering leadership
 
Thinking psychoanalytically about desire in organizations - why we need a 3rd...
Thinking psychoanalytically about desire in organizations - why we need a 3rd...Thinking psychoanalytically about desire in organizations - why we need a 3rd...
Thinking psychoanalytically about desire in organizations - why we need a 3rd...
 
Creating value in ecosystems: the place of the well-bounded organisation
Creating value in ecosystems: the place of the well-bounded organisationCreating value in ecosystems: the place of the well-bounded organisation
Creating value in ecosystems: the place of the well-bounded organisation
 
Competing in Ecosystems
Competing in EcosystemsCompeting in Ecosystems
Competing in Ecosystems
 
Governance in Ultra-Large-Scale Systems
Governance in Ultra-Large-Scale SystemsGovernance in Ultra-Large-Scale Systems
Governance in Ultra-Large-Scale Systems
 
The impact of governance approaches on system of-system environments
The impact of governance approaches on system of-system environmentsThe impact of governance approaches on system of-system environments
The impact of governance approaches on system of-system environments
 
Building organizational agility into large scale software-reliant environments
Building organizational agility into large scale software-reliant environmentsBuilding organizational agility into large scale software-reliant environments
Building organizational agility into large scale software-reliant environments
 
Systems of systems engineering and the pragmatics of demand
Systems of systems engineering and the pragmatics of demandSystems of systems engineering and the pragmatics of demand
Systems of systems engineering and the pragmatics of demand
 
Enterprise architecture for complex system of-systems contexts
Enterprise architecture for complex system of-systems contextsEnterprise architecture for complex system of-systems contexts
Enterprise architecture for complex system of-systems contexts
 
Strategic and economic drivers of governance
Strategic and economic drivers of governanceStrategic and economic drivers of governance
Strategic and economic drivers of governance
 
The value of agility
The value of agilityThe value of agility
The value of agility
 
Competing within Ecosystems: determining requisite agility in system-of-syste...
Competing within Ecosystems: determining requisite agility in system-of-syste...Competing within Ecosystems: determining requisite agility in system-of-syste...
Competing within Ecosystems: determining requisite agility in system-of-syste...
 
Kuhn and Lakatos
Kuhn and LakatosKuhn and Lakatos
Kuhn and Lakatos
 
Value for defence
Value for defenceValue for defence
Value for defence
 
Supporting Social Complexity in Collaborative Enterprises
Supporting Social Complexity in Collaborative EnterprisesSupporting Social Complexity in Collaborative Enterprises
Supporting Social Complexity in Collaborative Enterprises
 
Enterprise Architecture and Governance
Enterprise Architecture and GovernanceEnterprise Architecture and Governance
Enterprise Architecture and Governance
 

Recently uploaded

定制英国白金汉大学毕业证(UCB毕业证书) 成绩单原版一比一
定制英国白金汉大学毕业证(UCB毕业证书)																			成绩单原版一比一定制英国白金汉大学毕业证(UCB毕业证书)																			成绩单原版一比一
定制英国白金汉大学毕业证(UCB毕业证书) 成绩单原版一比一ffjhghh
 
Predicting Employee Churn: A Data-Driven Approach Project Presentation
Predicting Employee Churn: A Data-Driven Approach Project PresentationPredicting Employee Churn: A Data-Driven Approach Project Presentation
Predicting Employee Churn: A Data-Driven Approach Project PresentationBoston Institute of Analytics
 
RA-11058_IRR-COMPRESS Do 198 series of 1998
RA-11058_IRR-COMPRESS Do 198 series of 1998RA-11058_IRR-COMPRESS Do 198 series of 1998
RA-11058_IRR-COMPRESS Do 198 series of 1998YohFuh
 
B2 Creative Industry Response Evaluation.docx
B2 Creative Industry Response Evaluation.docxB2 Creative Industry Response Evaluation.docx
B2 Creative Industry Response Evaluation.docxStephen266013
 
Brighton SEO | April 2024 | Data Storytelling
Brighton SEO | April 2024 | Data StorytellingBrighton SEO | April 2024 | Data Storytelling
Brighton SEO | April 2024 | Data StorytellingNeil Barnes
 
Digi Khata Problem along complete plan.pptx
Digi Khata Problem along complete plan.pptxDigi Khata Problem along complete plan.pptx
Digi Khata Problem along complete plan.pptxTanveerAhmed817946
 
Indian Call Girls in Abu Dhabi O5286O24O8 Call Girls in Abu Dhabi By Independ...
Indian Call Girls in Abu Dhabi O5286O24O8 Call Girls in Abu Dhabi By Independ...Indian Call Girls in Abu Dhabi O5286O24O8 Call Girls in Abu Dhabi By Independ...
Indian Call Girls in Abu Dhabi O5286O24O8 Call Girls in Abu Dhabi By Independ...dajasot375
 
VIP High Class Call Girls Bikaner Anushka 8250192130 Independent Escort Servi...
VIP High Class Call Girls Bikaner Anushka 8250192130 Independent Escort Servi...VIP High Class Call Girls Bikaner Anushka 8250192130 Independent Escort Servi...
VIP High Class Call Girls Bikaner Anushka 8250192130 Independent Escort Servi...Suhani Kapoor
 
High Class Call Girls Noida Sector 39 Aarushi 🔝8264348440🔝 Independent Escort...
High Class Call Girls Noida Sector 39 Aarushi 🔝8264348440🔝 Independent Escort...High Class Call Girls Noida Sector 39 Aarushi 🔝8264348440🔝 Independent Escort...
High Class Call Girls Noida Sector 39 Aarushi 🔝8264348440🔝 Independent Escort...soniya singh
 
Full night 🥵 Call Girls Delhi New Friends Colony {9711199171} Sanya Reddy ✌️o...
Full night 🥵 Call Girls Delhi New Friends Colony {9711199171} Sanya Reddy ✌️o...Full night 🥵 Call Girls Delhi New Friends Colony {9711199171} Sanya Reddy ✌️o...
Full night 🥵 Call Girls Delhi New Friends Colony {9711199171} Sanya Reddy ✌️o...shivangimorya083
 
VIP Call Girls Service Miyapur Hyderabad Call +91-8250192130
VIP Call Girls Service Miyapur Hyderabad Call +91-8250192130VIP Call Girls Service Miyapur Hyderabad Call +91-8250192130
VIP Call Girls Service Miyapur Hyderabad Call +91-8250192130Suhani Kapoor
 
Industrialised data - the key to AI success.pdf
Industrialised data - the key to AI success.pdfIndustrialised data - the key to AI success.pdf
Industrialised data - the key to AI success.pdfLars Albertsson
 
04242024_CCC TUG_Joins and Relationships
04242024_CCC TUG_Joins and Relationships04242024_CCC TUG_Joins and Relationships
04242024_CCC TUG_Joins and Relationshipsccctableauusergroup
 
Saket, (-DELHI )+91-9654467111-(=)CHEAP Call Girls in Escorts Service Saket C...
Saket, (-DELHI )+91-9654467111-(=)CHEAP Call Girls in Escorts Service Saket C...Saket, (-DELHI )+91-9654467111-(=)CHEAP Call Girls in Escorts Service Saket C...
Saket, (-DELHI )+91-9654467111-(=)CHEAP Call Girls in Escorts Service Saket C...Sapana Sha
 
Best VIP Call Girls Noida Sector 39 Call Me: 8448380779
Best VIP Call Girls Noida Sector 39 Call Me: 8448380779Best VIP Call Girls Noida Sector 39 Call Me: 8448380779
Best VIP Call Girls Noida Sector 39 Call Me: 8448380779Delhi Call girls
 
{Pooja: 9892124323 } Call Girl in Mumbai | Jas Kaur Rate 4500 Free Hotel Del...
{Pooja:  9892124323 } Call Girl in Mumbai | Jas Kaur Rate 4500 Free Hotel Del...{Pooja:  9892124323 } Call Girl in Mumbai | Jas Kaur Rate 4500 Free Hotel Del...
{Pooja: 9892124323 } Call Girl in Mumbai | Jas Kaur Rate 4500 Free Hotel Del...Pooja Nehwal
 
Schema on read is obsolete. Welcome metaprogramming..pdf
Schema on read is obsolete. Welcome metaprogramming..pdfSchema on read is obsolete. Welcome metaprogramming..pdf
Schema on read is obsolete. Welcome metaprogramming..pdfLars Albertsson
 

Recently uploaded (20)

定制英国白金汉大学毕业证(UCB毕业证书) 成绩单原版一比一
定制英国白金汉大学毕业证(UCB毕业证书)																			成绩单原版一比一定制英国白金汉大学毕业证(UCB毕业证书)																			成绩单原版一比一
定制英国白金汉大学毕业证(UCB毕业证书) 成绩单原版一比一
 
Predicting Employee Churn: A Data-Driven Approach Project Presentation
Predicting Employee Churn: A Data-Driven Approach Project PresentationPredicting Employee Churn: A Data-Driven Approach Project Presentation
Predicting Employee Churn: A Data-Driven Approach Project Presentation
 
RA-11058_IRR-COMPRESS Do 198 series of 1998
RA-11058_IRR-COMPRESS Do 198 series of 1998RA-11058_IRR-COMPRESS Do 198 series of 1998
RA-11058_IRR-COMPRESS Do 198 series of 1998
 
B2 Creative Industry Response Evaluation.docx
B2 Creative Industry Response Evaluation.docxB2 Creative Industry Response Evaluation.docx
B2 Creative Industry Response Evaluation.docx
 
Brighton SEO | April 2024 | Data Storytelling
Brighton SEO | April 2024 | Data StorytellingBrighton SEO | April 2024 | Data Storytelling
Brighton SEO | April 2024 | Data Storytelling
 
Decoding Loan Approval: Predictive Modeling in Action
Decoding Loan Approval: Predictive Modeling in ActionDecoding Loan Approval: Predictive Modeling in Action
Decoding Loan Approval: Predictive Modeling in Action
 
Digi Khata Problem along complete plan.pptx
Digi Khata Problem along complete plan.pptxDigi Khata Problem along complete plan.pptx
Digi Khata Problem along complete plan.pptx
 
Indian Call Girls in Abu Dhabi O5286O24O8 Call Girls in Abu Dhabi By Independ...
Indian Call Girls in Abu Dhabi O5286O24O8 Call Girls in Abu Dhabi By Independ...Indian Call Girls in Abu Dhabi O5286O24O8 Call Girls in Abu Dhabi By Independ...
Indian Call Girls in Abu Dhabi O5286O24O8 Call Girls in Abu Dhabi By Independ...
 
VIP High Class Call Girls Bikaner Anushka 8250192130 Independent Escort Servi...
VIP High Class Call Girls Bikaner Anushka 8250192130 Independent Escort Servi...VIP High Class Call Girls Bikaner Anushka 8250192130 Independent Escort Servi...
VIP High Class Call Girls Bikaner Anushka 8250192130 Independent Escort Servi...
 
E-Commerce Order PredictionShraddha Kamble.pptx
E-Commerce Order PredictionShraddha Kamble.pptxE-Commerce Order PredictionShraddha Kamble.pptx
E-Commerce Order PredictionShraddha Kamble.pptx
 
High Class Call Girls Noida Sector 39 Aarushi 🔝8264348440🔝 Independent Escort...
High Class Call Girls Noida Sector 39 Aarushi 🔝8264348440🔝 Independent Escort...High Class Call Girls Noida Sector 39 Aarushi 🔝8264348440🔝 Independent Escort...
High Class Call Girls Noida Sector 39 Aarushi 🔝8264348440🔝 Independent Escort...
 
VIP Call Girls Service Charbagh { Lucknow Call Girls Service 9548273370 } Boo...
VIP Call Girls Service Charbagh { Lucknow Call Girls Service 9548273370 } Boo...VIP Call Girls Service Charbagh { Lucknow Call Girls Service 9548273370 } Boo...
VIP Call Girls Service Charbagh { Lucknow Call Girls Service 9548273370 } Boo...
 
Full night 🥵 Call Girls Delhi New Friends Colony {9711199171} Sanya Reddy ✌️o...
Full night 🥵 Call Girls Delhi New Friends Colony {9711199171} Sanya Reddy ✌️o...Full night 🥵 Call Girls Delhi New Friends Colony {9711199171} Sanya Reddy ✌️o...
Full night 🥵 Call Girls Delhi New Friends Colony {9711199171} Sanya Reddy ✌️o...
 
VIP Call Girls Service Miyapur Hyderabad Call +91-8250192130
VIP Call Girls Service Miyapur Hyderabad Call +91-8250192130VIP Call Girls Service Miyapur Hyderabad Call +91-8250192130
VIP Call Girls Service Miyapur Hyderabad Call +91-8250192130
 
Industrialised data - the key to AI success.pdf
Industrialised data - the key to AI success.pdfIndustrialised data - the key to AI success.pdf
Industrialised data - the key to AI success.pdf
 
04242024_CCC TUG_Joins and Relationships
04242024_CCC TUG_Joins and Relationships04242024_CCC TUG_Joins and Relationships
04242024_CCC TUG_Joins and Relationships
 
Saket, (-DELHI )+91-9654467111-(=)CHEAP Call Girls in Escorts Service Saket C...
Saket, (-DELHI )+91-9654467111-(=)CHEAP Call Girls in Escorts Service Saket C...Saket, (-DELHI )+91-9654467111-(=)CHEAP Call Girls in Escorts Service Saket C...
Saket, (-DELHI )+91-9654467111-(=)CHEAP Call Girls in Escorts Service Saket C...
 
Best VIP Call Girls Noida Sector 39 Call Me: 8448380779
Best VIP Call Girls Noida Sector 39 Call Me: 8448380779Best VIP Call Girls Noida Sector 39 Call Me: 8448380779
Best VIP Call Girls Noida Sector 39 Call Me: 8448380779
 
{Pooja: 9892124323 } Call Girl in Mumbai | Jas Kaur Rate 4500 Free Hotel Del...
{Pooja:  9892124323 } Call Girl in Mumbai | Jas Kaur Rate 4500 Free Hotel Del...{Pooja:  9892124323 } Call Girl in Mumbai | Jas Kaur Rate 4500 Free Hotel Del...
{Pooja: 9892124323 } Call Girl in Mumbai | Jas Kaur Rate 4500 Free Hotel Del...
 
Schema on read is obsolete. Welcome metaprogramming..pdf
Schema on read is obsolete. Welcome metaprogramming..pdfSchema on read is obsolete. Welcome metaprogramming..pdf
Schema on read is obsolete. Welcome metaprogramming..pdf
 

Visual modeling using projective analysis (pan)

  • 1. Visual Modeling using projective analysis (PAN) Philip Boxer April 20th 2007 Copyright © BRL 2007 1
  • 2. The ‘double challenge’ space Copyright © BRL 2007 2
  • 3. A Governance Framework Organizes Structural Issues These correspond to different levels of supplier alignment… Multiple Enterprises: the activities related to the operation of a system of systems within the context of its uses and users. Single Enterprise: the activities related to the management of one agency in the context of other agencies. Single Task Systems: the technologies (and the technical activities to select and apply them) that create and maintain interoperable task systems. … and to different agency relationships: Between multiple agencies and their multiple task systems. Within single agencies and their multiple task systems*. Within single task systems If we consider interoperability from the point of view of Wildland Fuels and Fire Management, we can stratify different levels of interoperability between suppliers within this environment: Stratification of levels: 6. Effects environment 5. Mission environment 4. Deployed Force 3. Operationally ready capabilities 2. Field-able capabilities 1. Equipment and bought- in capabilities * Depends on Deployed Force Command structure Copyright © BRL 2007 3
  • 4. Three Views Organize Demand Responses Service- driven Solution- driven Driven by the anticipated longer term consequences-on-the- ground I - Physical View How do we get the equipment and people with all the relevant support in the right place at the right time and keep it there? How do we get all the services working together in such a way that the right capabilities and information can be put in front of the right decision-makers at the right time? II – Situational View* * Note that ‘situation’ here is defined with respect to the fire manager with command authority, and is in support of their recognition of the present situation…. III – Effects-based View How do we draw upon the other two views in support of generating desired operational effects. Copyright © BRL 2007 4
  • 5. A Grid Organizes Governance to Demand View of Response to Demand Physical (service- driven) Situational (solution- driven) Effects-based (experience- driven) Supplier Alignment Single Task System Single Enterprise (containing multiple task systems) Multiple Enterprises (containing multiple task systems) The ‘comfort zone’ of a single agency facing known demands Disruption due to the challenge to supplier alignment arising from the multi-agency context Disruption due to emergent demands arising from dynamic contexts-of- use SoS Target Copyright © BRL 2007 5
  • 6. Revealing a Double Challenge Supplier Alignment Nature of Response to Demand Physical (product- driven) Situat’nal (solution- driven) Effects-based (experience- driven) Single Task System Single Enterprise (containing multiple task systems) Multiple Enterprises (containing multiple task systems) The second challenge: Building the agility to respond to the wildland fire effects environment? The first challenge: Synchronizing the governance framework across a complex operational context. Copyright © BRL 2007 6
  • 7. … requiring us to address the whole space. Hierarchy layer Structure-function and trace layers Synchronisation layer 321 654 987 Demand layer Supplier Alignment Nature of Response to Demand Physical (product- driven) Situat’nal (solution- driven) Effects-based (experience- driven) Single Task System Single Enterprise (containing multiple task systems) Multiple Enterprises (containing multiple task systems) The way visual PAN models the relationships between a number of layers offers one way of seeking to model this space as a whole Copyright © BRL 2007 7
  • 8. Where does the technology fit in?! Copyright © BRL 2007 8
  • 9. The role of the Models and Tools Model ‘Push’ The models and tools are developed one-by-one around particular problems and challenges, with varying degrees of adoption and take-up. The Systems-of-Systems double challenge involves approaching this problem from the point-of- view of effects ‘pull’ Effects ‘Pull’ Operational Effects Situational Awareness Materiel & Technology Organisational learning, Personnel & Culture Edge Organisation Leadership & Education Force Recruitment & Collective Training Facilities & Infrastructure Doctrine & Concepts ‘Pull’ Operational Effects Situational Awareness Materiel & Technology Organisational learning, Personnel & Culture Edge Organisation Leadership & Education Force Recruitment & Collective Training Facilities & Infrastructure Doctrine & Concepts Copyright © BRL 2007 9
  • 10. There tends to be a hole-in-the-middle between these two approaches. Model ‘Push’ Effects ‘Pull’ basic capability keeping it working deploying it insufficient demand leverage insufficient governance leverage doing the business maintaining operational effectiveness through-life sustainment The hole-in-the-middle Supplier Alignment Nature of Response to Demand Physical (product- driven) Situat’nal (solution- driven) Effects-based (experience- driven) Single Task System Single Enterprise (containing multiple task systems) Multiple Enterprises (containing multiple task systems) Integrating it The hole-in-the- middle The aim is to bridge the hole by developing risk mitigation strategies. Copyright © BRL 2007 10
  • 11. The ‘I’ position from which a PAN model is built Copyright © BRL 2007 11
  • 12. The domain of interest White: how we must do what we do Blue: what we do Internal External Red: particular demands Black: the contexts from which the demands emerge The way things work What determines shape The ‘who for whom’: Whose demands are we satisfying? The ‘why’: Will we produce the effect that we intend? The ‘what’: How do things work? The ‘how’: How are they organised? Identifying key actors and influences The goal is to establish who the key actors are, and how they influence each other in determining the performance of the whole: Copyright © BRL 2007 12
  • 13. Moving from Influence Mapping into Projective ANalysis B: (influence maps) hierarchy layer C1: (actor-centric PAN) + synchronisation, structure-function & trace layers C2: (demand-centric PAN) + demand layer D: (zones of interoperability) landscapes & risk identification E: (zone metrics) + behavior/deontics Actors, world views x ontologies (4-colours), issues, time-lines Any currently available material on how the organisation works Scenarios, ladders, event sequences, orchestration/composition Stratification, slicing, landscapes and risk identification e.g. the interface to other M&S approaches Process itself A: consulting team’s pre-work These layers can all be described as topologies These require the addition of behaviours/ deontics to the topologies Copyright © BRL 2007 13
  • 15. Modelling Interoperability The approach to modeling interoperability is Projective ANalysis (PAN), designed to describe the technology within its contexts-of-use. This is done in terms of 5 layers of analysis: – Structure/Function: The physical structure and functioning of resources and capabilities. – Trace: The digital processes and software that interact with the physical processes. – Hierarchy: The formal hierarchies under which the uses made of both the physical and the digital are held accountable. – Synchronization: The lateral relations of synchronisation and coordination within and between Agencies and the services they provide ‘on the ground’. – Demand: the nature of the environment giving rise to demands on the way the operations are organised to deliver effective and timely services. These 5 layers combine to form a model of the operational space as a whole, within which Systems of Systems interoperate in relation to particular forms of demand. Copyright © BRL 2007 15
  • 16. Identifying what underlies the relationships The actors influencing different aspects of the whole are influencing the interoperation of the constituent elements. Hierarchy: The formal hierarchies under which the uses made of both the physical and digital are held accountable. Demand: the nature of the environment giving rise to demands on the way the operations are organised to deliver effective and timely services. Synchronisation: The lateral relations of synchronisation and coordination within and between Agencies and the services they provide ‘on the ground’. Structure/Function: The physical structure and functioning of resources and capabilities. Trace: The digital processes and software that interact with the physical processes. Actors The actors within the circle are identified with the interoperating constituent elements outside the circle Constituent Elements of PAN Model White: how we must do what we do Blue: what we do Internal External Red: particular demands Black: the contexts from which the demands emerge The way things work What determines shape Copyright © BRL 2007 16
  • 17. Synchronisation Trace Structure-Function Hierarchy Demand Combined Operational Space PAN modelling PAN modelling then fills in the relationships between these constituent elements Copyright © BRL 2007 17
  • 18. …which describes the underlying models from which composite capabilities are generated, represented in the form of a stratification. 1 0 1b 22b1c 3b 4b 3 4 5 6 5b sfo How are ‘complex objects’ formed? Copyright © BRL 2007 18
  • 19. The Outputs Stratification analyses the different levels of interoperability* from the point of view of the demands being placed on the system of systems by the environment. — It enables the constructive risks associated with constituent systems to be separated out from the interoperability risks arising from their orchestration and composition. Landscape — The outputs of the analysis provide a way of identifying o the root causes of interoperability risks and the means of their mitigation. o The succession logics of the underlying models supply-side constructive risks demand-side interoperability risks 6. Effects environment 5. Mission environment 4. Deployed Force 3. Operationally ready capabilities 2. Field-able capabilities 1. Equipment and bought-in capabilities * Stratification: — It enables topological characteristics of the system of systems to be represented in the form of landscapes, describing interoperability ‘hotspots’ (peaks) as well as risks (gaps between peaks). Why do gaps matter? Copyright © BRL 2007 19
  • 20. The visual syntax Copyright © BRL 2007 20
  • 22. The visual PAN syntaxStructure- Function capabil ity kno w- how event process outcom e A physical process A capability determining the behaviour of another capability or of a process An event generated by a process An outcome generated by a process, and capable of being contained by a customer situation or party to the satisfaction of a customer situation. Know-how that can alter the way in which other know-how and capabilities determine behaviour. Can be party to satisfying customer situations. Trace system trace dproces s desi gn A digital process i.e. a software process A digital system that can determine the behaviour of another system, a digital process or a physical process Design that can alter the way in which other designs and systems determine behaviour. Can be party to satisfying customer situations. A digital event created by a process or a digital process Hierarchy unit A unit of vertical accountability over all the entities it controls. (Also represents their state). Synchronisation order The framing of a horizontal synchronisation of the entities it includes dorder The digital framing of a horizontal synchronisation of the events and traces it includes Demand customer situation problem domain demand situation driver The place from which the ‘I’ of the client system is formulating its demands A particular context-of-use A particular customer situation within a context- of-use representing a particular formulation of a demand within that context. (Also represents the state of the demand). A driver determining the nature of the satisfaction demanded by a customer situation How are legal relations defined? Copyright © BRL 2007 22
  • 24. activity/ trace chains contains contains contains drives demand organisation Relations between symbols determines determines determines controlscontrols controls contains controls ddetermines ddetermines ddetermines frames determines supplies Used to represent the sourcing of infrastructure & know-how dsupplies state data dframes dframes controls situational data dsupplies dsupplies dsupplies dsupplies frames satisfies An outcome that can satisfy must be accompanied by know-how The super-ordinate unit is a supply-side actor supplies supplies supplies Copyright © BRL 2007 24
  • 27. What the modeller models boundary perimeter 3rd order 2nd order deterministic structure- determined reactive* structure- determined passive* Process* edge deterministic structure- determining* organisation- determined reactive organisation- determined passive non-deterministic deterministic organisation- determining governance- determined reactive non-deterministic stakeholder governance- determining driver non-deterministic On the supply-side, the stakeholder is represented as the top of a hierarchy closures 1st order Modeller’s model of the system-of-interest: How does this relate to DoDAF? stakeholder Copyright © BRL 2007 27
  • 28. The visual PAN layers structure- determined reactive structure- determined passive structure- determining process structure-function/ trace layers demand-side stakeholder governance- determining driver governance- determined reactive demand layerhierarchy/ synchronisation layers organisation- determining organisation- determined reactive organisation- determined passive supply-side stakeholders implicit in the ‘top’ of the hierarchy Projective Analysis Reflective Analysis Copyright © BRL 2007 28
  • 29. What is the stratification? Copyright © BRL 2007 29
  • 30. 1c super- structure e.g. it wing Contexts-of-use 5b 5 composition of orchestrated constituent capabilities Underlying infrastructures Stratification is not independent of context-of-use Composition with context-of-use Self-Synchronisation of orchestrated services with demands arising from context-of-use constituent capabilities e.g. comms interoperability 3b 3 7 drivers e.g. joint ops 7b problem domains e.g. out-of-area operations 6 demand situations e.g. crisis response mission situations e.g. aew capability 1b direct organisation e.g. ops wing, data management 0processes e.g. change notifications, iff events e.g. nav output, identity tracks 1services e.g. display consoles, mission planning know-how e.g. programmers, test design What is the relationship to DoTMLPF? Effects Ladders 2b 2outcomes e.g. certified mods, on station Design control over customisation of constituent services orchestrations of constituent capabilities e.g. of datalink, esm 4b 4 6b data platforms e.g. mission record Activity Chains Governance of constituent capabilities Situational data fusion Copyright © BRL 2007 30
  • 31. Transaction and Governance costs 7 7b 6 5b 54b 4 2b 3b 2 3 1c 1b 0 1 6b Governance Output Transactions Operational Capability Force package Mission Environment 1 2 3 Equipmentto requirement 2 3 4 Equipment availability 3 4 5 Capability availability 4 5 6 Mission availability Effects Environment Equipment Fielded equipment 5 6 JointOps availability 1 2 Supplyto specification ‘smart’ ‘TLAM’ TLCM TLCM+Trad’l Collaboration 4-5 TLCM Supply chain management 2-3 SCM Market inputs 0-1 COTS Production 1-2 Synchronization 5-6 TLCM+ Costs 5 Synchronization 4 Collaboration Economies of alignment (3rd) Customization 3- 4 TLAM Transaction cost approach Economies of scale (1st) 1 Production 0 Market inputs Economies of scope (2nd) 3 Customization 2 SCM Relating the asymmetries, colours etc Copyright © BRL 2007 31
  • 33. order/B (designkhow)/Z csitn/Y unit/A outcome/X Complex object - Unit_orchn Which units have a demand-side relationship to customer situations? satisfies synchronisessynchronises controls controls determining Copyright © BRL 2007 33
  • 34. Overlapping constituent parts Why do ‘Gaps’ matter? a ‘gap’ = lack of overlapping parts enabling synchronisation across services in a way that relates to the demand as a whole service four service one ‘traffic’ around the gap as each service tries to solve what it can a whole demandA ‘whole’ demand service one service two service three service four service five service six Services needing to be involved ‘service’ could be at the level of (e.g.) an organisational unit or at the level of a software object. ‘overlap’ could be defined as (e.g.) liaison people at one level or as shared data at another. collaborative SoS service one service two service three service four service five service six ‘horizontal’ process of collaboration in response to the whole demand. The challenge: The problem: Solutions: service one service two service three service four service five service six directed SoS ‘vertical’ separation of the whole demand into deconflicted parts Copyright © BRL 2007 34
  • 35. Visual PAN Syntax Copyright © BRL 2007 35
  • 37. Mapping the different schemas 6-level stratification 1st 2nd 3rd WHO/M WHY HOW WHAT Four colours/ causes 7 6 5 4 3 2 1 0 8-level stratification The Three Asymmetries: the three forms of asymmetry forming the basis of competitive advantage – 3rd – the demand is not the experience, 2nd – the business is not the solution, and 1st – the technology is not the product. Copyright © BRL 2007 37
  • 38. modelling contexts contexts-of- governance contexts- of-use modalities of reality The Zachman Connection SCOPE (Competitive context) Planning BUSINESS MODEL (Conceptual) Owning SYSTEM MODEL (Logical) Designing TECHNOLOGY MODEL (Physical) Building DETAILED REPRESENTATIONS (out-of-modelling-context) Subcontracting DATA (WHAT) e.g. data MOTIVATION (WHY) e.g. strategy TIME (WHEN) e.g. schedule PEOPLE (WHO) e.g. organisation NETWORK (WHERE) e.g. network FUNCTION (HOW) e.g. function SCOPE (Competitive context) Planning BUSINESS MODEL (Conceptual) Owning SYSTEM MODEL (Logical) Designing TECHNOLOGY MODEL (Physical) Building DETAILED REPRESENTATIONS (out-of-modelling-context) Subcontracting DATA (WHAT) e.g. data MOTIVATION (WHY) e.g. strategy TIME (WHEN) e.g. schedule PEOPLE (WHO) e.g. organisation NETWORK (WHERE) e.g. network FUNCTION (HOW) e.g. function USE CONTEXT (WHO for WHOM) e.g. particular client USE CONTEXT (WHO for WHOM) e.g. particular client EVENT (WHAT) e.g. things done EVENT (WHAT) e.g. things done COLLABORATIVE MODEL (Pragmatic) Governing COLLABORATIVE MODEL (Pragmatic) Governing Copyright © BRL 2007 38
  • 39. Source of coloured squares: Zachman Framework, www.zifa.com SCOPE (Competitive context) Planning BUSINESS MODEL (Conceptual) Owning SYSTEM MODEL (Logical) Designing TECHNOLOGY MODEL (Physical) Building DETAILED REPRESENTATIONS (out-of-modelling-context) Subcontracting DATA (WHAT) e.g. data MOTIVATION (WHY) e.g. strategy TIME (WHEN) e.g. schedule PEOPLE (WHO) e.g. organisation NETWORK (WHERE) e.g. network FUNCTION (HOW) e.g. function USE CONTEXT (WHO for WHOM) e.g. particular client EVENT (WHAT) e.g. things done COLLABORATIVE MODEL (Pragmatic) Governing The WHAT The WHYThe WHO/MThe HOW Copyright © BRL 2007 39