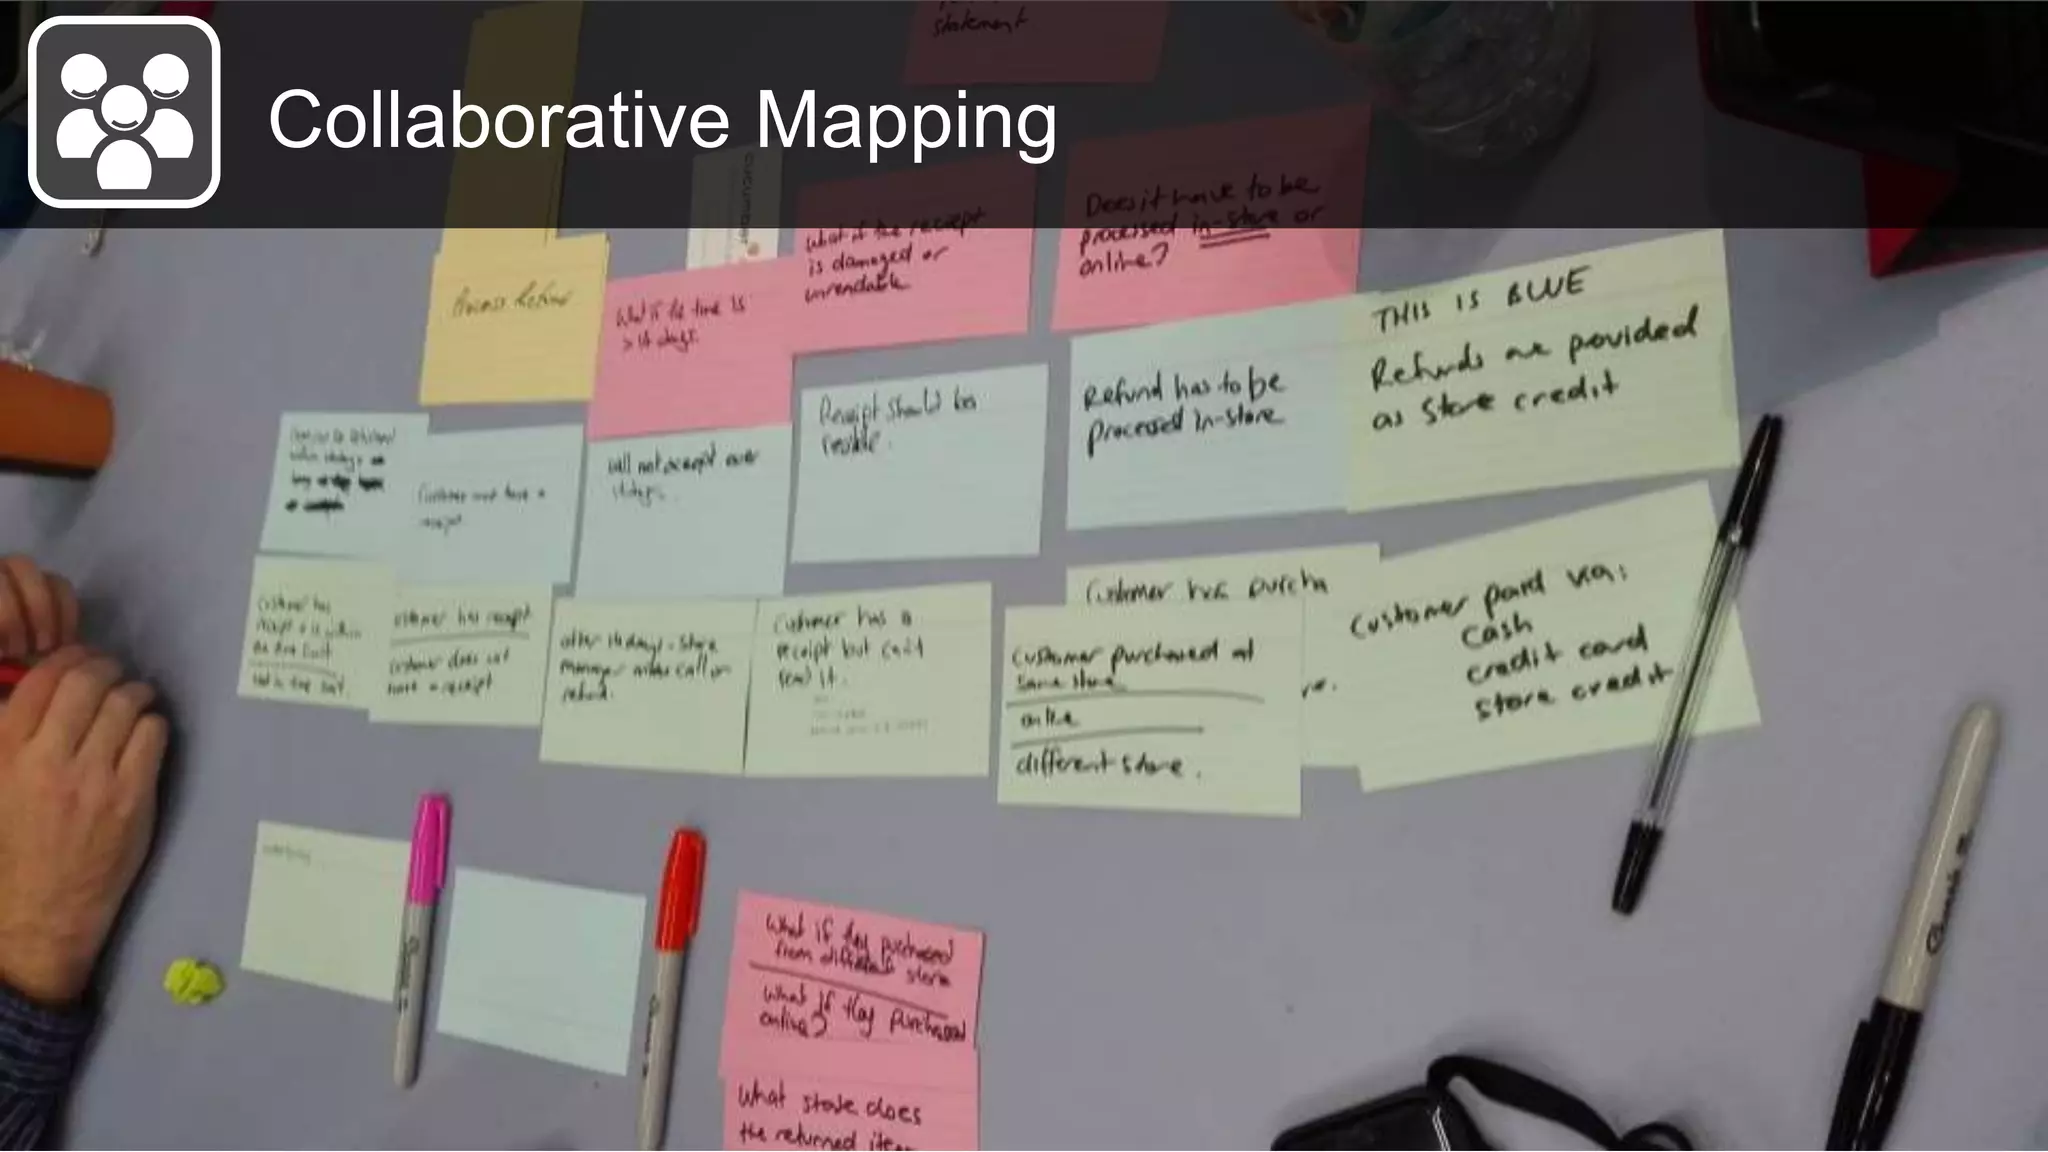
This document discusses how visuals can help teams with planning, communication, and collaboration. It provides examples of using visuals for mapping processes, showing progress, developing strategies, and facilitating remote retrospectives. The authors found that visuals were effective for providing clarity, engaging teams, and developing shared understanding when collaboratively working on the same visual canvas. They conclude that experimenting with different visual approaches can help teams answer challenges and that the power of visuals lies in guiding and aligning team activities.
Introduction to kanban calgary .net user group - feb 6Dave White
February 6, 2013 Calgary .NET User Group Lunch Seminar series - An introduction to Kanban presented by Dave White of Imaginet (http://www.imaginet.com) and board member at Lean Kanban University (http://www.leankanbanuniversity.com)
Unit Testing - Calgary .NET User Group - Nov 26 2014 - Depth ConsultingDave White
This is a talk I presented at the Calgary .NET User Group on November 26, 2014. It is part of a Developer Fundamentals Series that Simon Timms and myself are putting on for the Calgary Development community.
Phases of Team basics - Team building, required for different projects. Tools required to solve the problems.
Types of communication method and Plan for communication management to achieve it.
Team Shaping - Building a shared understandingSven Peters
Teamwork is tough, and it’s not getting easier. As more teams switch to remote or hybrid work models, building and maintaining a sense of connection and shared purpose among team members is becoming increasingly challenging. If we're going to get our teams healthy, we need to hit the teamwork gym!
Learn how to build a healthy team! We'll develop a shared understanding of responsibilities, team goals, how you work together, and our relationship with other teams. With just four simple exercises, you can bring your team in shape to become more productive and innovative. So let's pump...you up!
we developing a training / coaching concept / programme under the working title GROWTW, which is dedicated to enhance the ability of managers to act with CSR...
The best-laid change management plan can be challenged and derailed if the impact, emotions and reactions of the people who are involved are not considered and accommodated.
Synergy is a consulting company that helps clients achieve more together than they could alone. Synergy works with clients to build and improve their teams and networks and foster a culture of collaboration and cooperation. Synergy serves clients from various industries and sectors.
Synergy Sales Deck is an example of a solution sales deck for businesses in consulting and advisory services.
You Built It They Will Come_webversion092010tmharpster
Everybody loves creating courses and solutions...but many of us sort of lose interest when it's time to implement. This presentation - via a true-life case study - offers 7 tips to ensure that you get the results you hoped for and you avoid the traps that cause many solutions to fizzle.
2013 OVCN INNOVATION & ACTION! Conference
'If Demonstrating Impact Seems Boring, You're Doing it Wrong' facilitated by Andrew Taylor of Taylor Newberry Consulting Inc.
http://taylornewberry.ca/
#OVCNaction
Strong, Successful Teams - Ensuring High Performance in Remote TeamsVickyPatmore
Keeping teams performing and aligned on success is a challenge even when you get to meet up. In this new world of sustainability and Coronavirus, we have to look to new strategies and ways to ensure that our teams continue to collaborate and keep close together.
Accelerate your Kubernetes clusters with Varnish CachingThijs Feryn
A presentation about the usage and availability of Varnish on Kubernetes. This talk explores the capabilities of Varnish caching and shows how to use the Varnish Helm chart to deploy it to Kubernetes.
This presentation was delivered at K8SUG Singapore. See https://feryn.eu/presentations/accelerate-your-kubernetes-clusters-with-varnish-caching-k8sug-singapore-28-2024 for more details.
Encryption in Microsoft 365 - ExpertsLive Netherlands 2024Albert Hoitingh
In this session I delve into the encryption technology used in Microsoft 365 and Microsoft Purview. Including the concepts of Customer Key and Double Key Encryption.
The Art of the Pitch: WordPress Relationships and SalesLaura Byrne
Clients don’t know what they don’t know. What web solutions are right for them? How does WordPress come into the picture? How do you make sure you understand scope and timeline? What do you do if sometime changes?
All these questions and more will be explored as we talk about matching clients’ needs with what your agency offers without pulling teeth or pulling your hair out. Practical tips, and strategies for successful relationship building that leads to closing the deal.
Why You Should Replace Windows 11 with Nitrux Linux 3.5.0 for enhanced perfor...SOFTTECHHUB
The choice of an operating system plays a pivotal role in shaping our computing experience. For decades, Microsoft's Windows has dominated the market, offering a familiar and widely adopted platform for personal and professional use. However, as technological advancements continue to push the boundaries of innovation, alternative operating systems have emerged, challenging the status quo and offering users a fresh perspective on computing.
One such alternative that has garnered significant attention and acclaim is Nitrux Linux 3.5.0, a sleek, powerful, and user-friendly Linux distribution that promises to redefine the way we interact with our devices. With its focus on performance, security, and customization, Nitrux Linux presents a compelling case for those seeking to break free from the constraints of proprietary software and embrace the freedom and flexibility of open-source computing.
Securing your Kubernetes cluster_ a step-by-step guide to success !KatiaHIMEUR1
Today, after several years of existence, an extremely active community and an ultra-dynamic ecosystem, Kubernetes has established itself as the de facto standard in container orchestration. Thanks to a wide range of managed services, it has never been so easy to set up a ready-to-use Kubernetes cluster.
However, this ease of use means that the subject of security in Kubernetes is often left for later, or even neglected. This exposes companies to significant risks.
In this talk, I'll show you step-by-step how to secure your Kubernetes cluster for greater peace of mind and reliability.
Observability Concepts EVERY Developer Should Know -- DeveloperWeek Europe.pdfPaige Cruz
Monitoring and observability aren’t traditionally found in software curriculums and many of us cobble this knowledge together from whatever vendor or ecosystem we were first introduced to and whatever is a part of your current company’s observability stack.
While the dev and ops silo continues to crumble….many organizations still relegate monitoring & observability as the purview of ops, infra and SRE teams. This is a mistake - achieving a highly observable system requires collaboration up and down the stack.
I, a former op, would like to extend an invitation to all application developers to join the observability party will share these foundational concepts to build on:
Elevating Tactical DDD Patterns Through Object CalisthenicsDorra BARTAGUIZ
After immersing yourself in the blue book and its red counterpart, attending DDD-focused conferences, and applying tactical patterns, you're left with a crucial question: How do I ensure my design is effective? Tactical patterns within Domain-Driven Design (DDD) serve as guiding principles for creating clear and manageable domain models. However, achieving success with these patterns requires additional guidance. Interestingly, we've observed that a set of constraints initially designed for training purposes remarkably aligns with effective pattern implementation, offering a more ‘mechanical’ approach. Let's explore together how Object Calisthenics can elevate the design of your tactical DDD patterns, offering concrete help for those venturing into DDD for the first time!
State of ICS and IoT Cyber Threat Landscape Report 2024 previewPrayukth K V
The IoT and OT threat landscape report has been prepared by the Threat Research Team at Sectrio using data from Sectrio, cyber threat intelligence farming facilities spread across over 85 cities around the world. In addition, Sectrio also runs AI-based advanced threat and payload engagement facilities that serve as sinks to attract and engage sophisticated threat actors, and newer malware including new variants and latent threats that are at an earlier stage of development.
The latest edition of the OT/ICS and IoT security Threat Landscape Report 2024 also covers:
State of global ICS asset and network exposure
Sectoral targets and attacks as well as the cost of ransom
Global APT activity, AI usage, actor and tactic profiles, and implications
Rise in volumes of AI-powered cyberattacks
Major cyber events in 2024
Malware and malicious payload trends
Cyberattack types and targets
Vulnerability exploit attempts on CVEs
Attacks on counties – USA
Expansion of bot farms – how, where, and why
In-depth analysis of the cyber threat landscape across North America, South America, Europe, APAC, and the Middle East
Why are attacks on smart factories rising?
Cyber risk predictions
Axis of attacks – Europe
Systemic attacks in the Middle East
Download the full report from here:
https://sectrio.com/resources/ot-threat-landscape-reports/sectrio-releases-ot-ics-and-iot-security-threat-landscape-report-2024/
GraphRAG is All You need? LLM & Knowledge GraphGuy Korland
Guy Korland, CEO and Co-founder of FalkorDB, will review two articles on the integration of language models with knowledge graphs.
1. Unifying Large Language Models and Knowledge Graphs: A Roadmap.
https://arxiv.org/abs/2306.08302
2. Microsoft Research's GraphRAG paper and a review paper on various uses of knowledge graphs:
https://www.microsoft.com/en-us/research/blog/graphrag-unlocking-llm-discovery-on-narrative-private-data/
Dev Dives: Train smarter, not harder – active learning and UiPath LLMs for do...UiPathCommunity
💥 Speed, accuracy, and scaling – discover the superpowers of GenAI in action with UiPath Document Understanding and Communications Mining™:
See how to accelerate model training and optimize model performance with active learning
Learn about the latest enhancements to out-of-the-box document processing – with little to no training required
Get an exclusive demo of the new family of UiPath LLMs – GenAI models specialized for processing different types of documents and messages
This is a hands-on session specifically designed for automation developers and AI enthusiasts seeking to enhance their knowledge in leveraging the latest intelligent document processing capabilities offered by UiPath.
Speakers:
👨🏫 Andras Palfi, Senior Product Manager, UiPath
👩🏫 Lenka Dulovicova, Product Program Manager, UiPath
Transcript: Selling digital books in 2024: Insights from industry leaders - T...BookNet Canada
The publishing industry has been selling digital audiobooks and ebooks for over a decade and has found its groove. What’s changed? What has stayed the same? Where do we go from here? Join a group of leading sales peers from across the industry for a conversation about the lessons learned since the popularization of digital books, best practices, digital book supply chain management, and more.
Link to video recording: https://bnctechforum.ca/sessions/selling-digital-books-in-2024-insights-from-industry-leaders/
Presented by BookNet Canada on May 28, 2024, with support from the Department of Canadian Heritage.
8. Visual answers
Plan Communicate Collaborate
How do we develop shared understanding?
How do we collaborate remotely?
How do we capture team feedback?
18. What have we learnt?
Plan Communicate Collaborate
Showing the big picture
Visualise process
Team Self-selection
19. What have we learnt?
Plan Communicate Collaborate
Showing the big picture
Visualise process
Team Self-selection
Visuals can map out the path for teams to follow
Showing process and gathering feedback during
the process helped us adapt and improve
1 week to completely redefine our teams.
Visuals + Self-selection rocks!
26. What have we learnt?
Plan Communicate Collaborate
Showing the big picture
Visualise progress
Team Self-selection
Visual strategy
Sharing a new Process
27. What have we learnt?
Plan Communicate Collaborate
Showing the big picture
Visualise progress
Team Self-selection
The visuals shared enough
information for our teams to
work with the strategy
Video was an engaging
way of communicating
detail effectively
Ideas had to be simple
enough to be
communicated visually
Team understood the
process from the visuals
alone
Visual strategy
Sharing a new Process
32. Remote retrospectives
Regular retrospectives were visual but didn’t
really work
Visuals needed to be part of a shared
scenario
Remote people couldn’t participate in the
same way
35. What have we learnt?
Plan Communicate Collaborate
Collaborative mapping
Remote retrospectives
Shared understanding &
scenarios
Showing the big picture
Visualise progress
Team Self-selection
Visual strategy
Sharing a new Process
36. What have we learnt?
Plan Communicate Collaborate
Collaborative mapping
Remote retrospectives
Shared understanding &
scenarios
Showing the big picture
Visualise progress
Team Self-selection
Testing strategy
Sharing a new Process
Personal Development
The whole team collaboratively develops a shared
visual map which tells a story
Remote facilitation needs all participants to have
an even playing field
Shared understanding and ownership emerges
from working on the same canvas
37. Insights
THE POWER OF VISUALS
to help our teams in planning, communication & collaboration.
Providing clarity and direction to guide our activities
38. Insights
VISIBLE vs VISUAL
Presenting the information in a way that is engaging and easily
understandable to align our teams and share understanding.
39. Insights
EXPERIMENT, EXPERIMENT AND EXPERIMENT!
There are visual approaches that you can use in answering your
challenges … try some, learn from their impact and share them!
This talk is based mainly around our visualisation work with Fairfax Product Technology.
Fairfax Product Technology is the in-house Agile development shop responsible for much of the stuff.co.nz platform, especially the journalists and editors tools for writing and publishing articles
After a reset around a year ago, two teams - Dream Team and Team Lamp - came together in a self-selection exercise. Team members selecting which business goals to align t
But first, why visualise?
Visual Learners
Much of our communication is visual and many of us are visual learners who learn best when new ideas and information is presented visually.
Immediacy
We can often process visual information faster than speech or text, especially where we recognise elements of familiar patterns
For example, once we’ve learnt the meaning of traffic lights we can apply the same colour patterns to other area of life. for example, RED alerting us to danger, YELLOW to warn us of risk and ALL THREE COLOURS to indicate progress or status.
Engaging
And in general, we’ve found the visuals we’ve experimented with are much more engaging for our teams, stakeholders (and beyond) than other forms of communication … and hopefully you’ll see that in a few of our examples.
<have changed reasons slightly to:
Visual learners
Immediacy - we process visual information quickly, especially when the visuals are similar to patterns we already understand
Engaging - many people prefer to engage with visual information
Memorable -
“
Traffic lights …
Studies, % is what we see … power of infographics, engage with better …
Patterns, colours, images
Gustavo Deco …
Pukeko, image, wikipedia
Famous brands … car logos … how we link a visual to a concept
-- http://www.slideshare.net/ethos3/the-power-of-visuals
-- Lynne’s visual mojo
-- http://blog.wyzowl.com/power-visual-communication-infographic
You’ve all heard the saying that “a picture is worth a thousand words” … Some of these pictures you can recognise the meaning without needing to have words (traffic lights, brands, emoticons).
All The visual experiments we’ll share in this talk will be based on this simple model that defines the main areas existing in any team environment: Plan, Communicate and Collaborate.
To be able to move forward, you need to know where you are and where you need to go to.
To understand our location in developing a product we need to see the big picture and how what we’re working on now fits into that
Where possible our teams have used whiteboard walls to map out the product we’re delivering, where we are now and how to get to the goal we’re after.
This wall covers the path for our Team Lamp to deliver a beta mobile website last year and was drawn by Fairfax’s UX lead Jane.
Here’s an example of how we’ve enhanced our visuals to make visible more detail on progress in team planning meetings and showcases with our stakeholders…
We can also use visuals to ensure clarity and focus where we are close to delivering a product. In this case we had just over a month until a release date for a product, which as a team we had agreed was an achievable timeline, but only if we had clear direction, were co-ordinated in the work we did and we reduced the noise of low priority work for our team members.
And here’s how we used it on a wall by our team area. Simple visual updates of progress for each of our goals, highlighting who was focused on each goal.
Another key part when planning is to define and organise our teams to achieve our missions.
We prepared the visual on the left to represent the whole transition path we wanted the team to follow. In this visual we captured each step together with a list of expected outcomes
The first step was to define our new teams and we really wanted our people to be part of the definition process. We really believe self-organising teams need to be at the core to achieve success.
we come up with the idea to use the self-selection experiment Sandy Mamoli presented some time ago.
Our product owners pitched their missions and their needs and then we went through an iterative process where everybody could choose the team to join based on three rules that were also visible in the wall: what’s the best choice for the company? where would you be able to be most valuable? where would you grow the most?
We used our avatars from the physical board to choose teams and at the end of the first step, in only 1 hour, we had two new teams: Dream Team and Team Lamp.
Once we had the two new teams we followed with each of them the rest of the process: definition of the working agreements, definition of the methodology to use and definition of all the team ceremonies to keep alignment with our product owners working from Auckland
At Fairfax we implemented a test strategy based upon the central idea of "testing as a team“, which simply-put was about our teams sharing the testing load.
The strategy extended “Testing as a team” to collaborating on testing throughout development and beyond.
Rather than focus on a written strategy, we were inspired by Lynne Cazaly’s visualisation work to try and visualise the strategy.
The visual test strategy captured our guiding principles for testing in a one-page illustration to be displayed on team walls and other shared team spaces, enabling it to be used as a reference in stand-ups and team discussions on testing.
The visuals were intended to communicate just enough about each of the principles, so that team members can work with the strategy without having to have read the detail behind it.
https://youtu.be/GicfweqCYJk
One experiment we tried to communicate the implementation detail behind the strategy was a micro-learning video which showed the Visual Test Strategy emerging with Jaume drawing, as I narrated the strategy detail.
We recorded the video one afternoon at work, using my phone and after a few takes got the illustration flow and camera angles right. The narration was captured separately on the same phone and the finished video was built around the narration. I edited the using open-source software, especially a tool called Blender which I highly recommend as a powerful video editor
In the communication part we’ve also been experimenting with visuals to minimise the waste of time when sharing new processes or ideas.
The idea has been to make use of visuals to share new processes to be followed instead of having a long meeting session to present it to a big group of people and evaluate the outcome of the communication.
One of the things we’ve been trying to work on is our personal development process. We’ve defined the way we want to help our people develop in three different steps
This is one of the visuals we created to communicate this new personal development process and a specific example using Trello.
We sent the visual to everybody with the three steps to follow (define goals / create actions / continuous flow) and we didn’t add any extra meetings to communicate it. All the information was shown in this one-page visual and my own personal development trello board was used as an example to make it really clear.
While much of what we have shown so far is visually appealing, being visual doesn’t necessarily have to be artistic, or be created by a single artist
In these experiments we looked at ways to involve a whole team in simple visuals, collaborating with colours and patterns to develop a shared understanding.
This slide shows an example map, which is a collaborative map breaking down a user story into its acceptance criteria and examples which can be used to verify if the acceptance criteria have been met. It is similar in concept to story or feature mapping, but at a more detailed level.
https://cucumber.io/blog/2015/12/08/example-mapping-introduction
We can take these mapping ideas to more traditional contexts and challenges
On the left we have a detailed strategy being structured collaboratively based upon a group brainstorming exercise. The map created gave us a clear visual on the most complex areas and ideas on how we could split the strategy work
On the right we have what started as a basic feature map being collaboratively elaborated on, mapped against timelines and grouped into possible releases, to generate a project. The power of both uses lies in the simplicity of generating the visuals and the greater team ownership of artefacts that might otherwise have been the work of only one or two team members.
One of our focuses in collaboration has been around remote collaboration as we’ve got our POs in Auckland together with part of one of our product delivery teams.
First retro using google drive, same canvas, same scenario, same postits
Send invite at the beginning, all join, use boxes as post its and follow the facilitator.
Preparation similar to normal one
How this one worked
Starfish, other examples from there
Normal practice now, even for co-located teams with our product owner in remote
same conversation, same boundaries
We keep all the feedback, naturally get all the outcomes.