

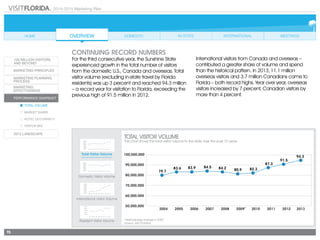
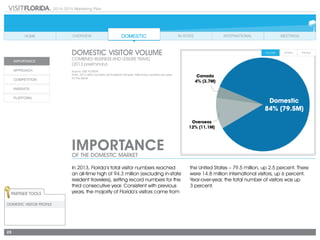
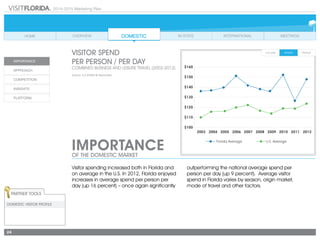
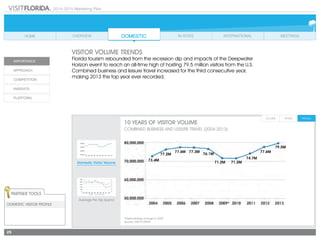
![2014-2015 Marketing Plan
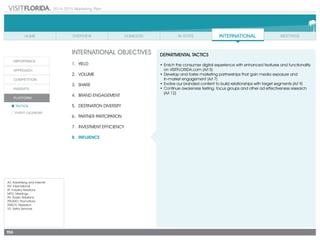
14
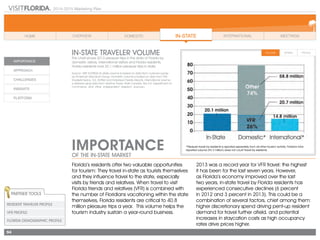
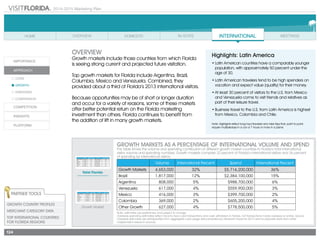
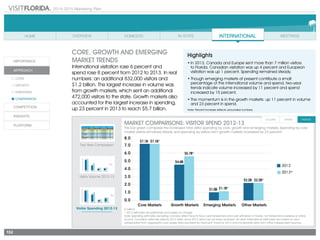
MARKETING EFFECTIVENESS
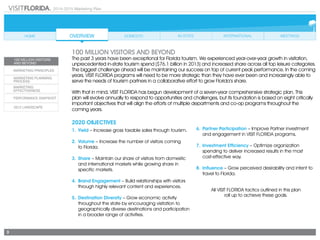
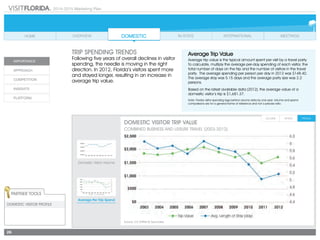
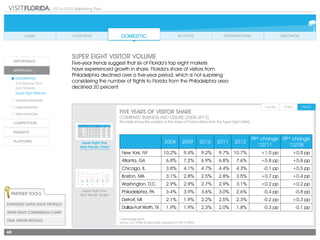
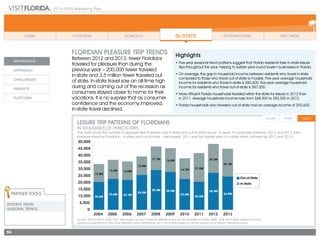
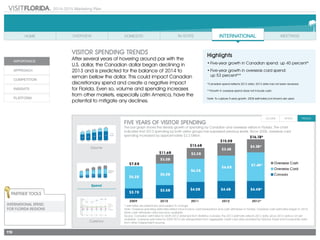
VISIT FLORIDA measures its ability to influence visitors through an annual independent third-party
survey that began in 2008. In 2013, VISIT FLORIDA marketing materials and initiatives influenced
38 percent of the people who visited the state.
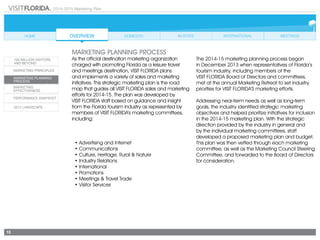
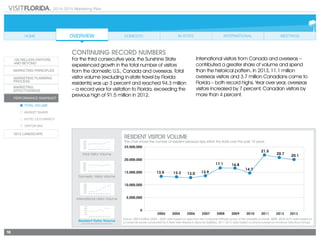
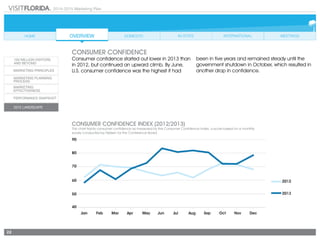
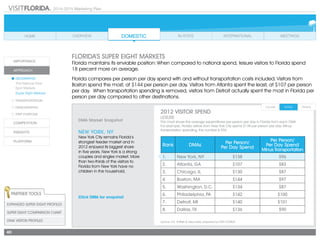
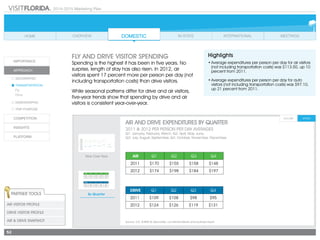
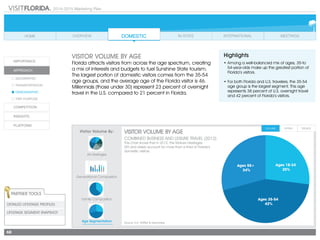
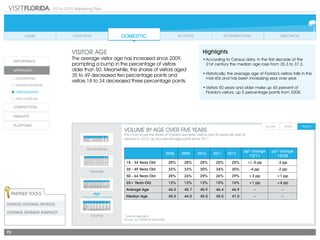
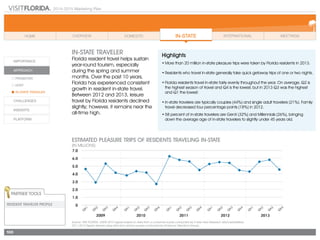
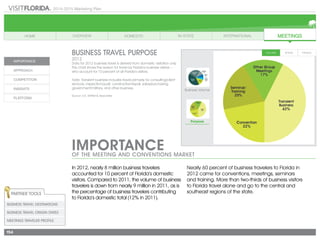
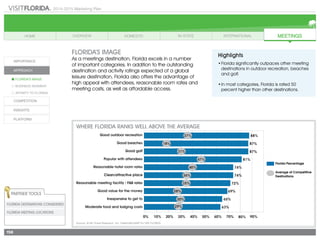
VISIT FLORIDA INFLUENCE ON VISITORS [2009-2013]
This graph shows the percentage of visitors to the state each year who acknowledged being influenced by VISIT FLORIDA
marketing efforts. In 2009, VISIT FLORIDA campaigns and materials influenced over 27 percent of Florida’s visitors; in 2013,
VISIT FLORIDA influenced 38 percent of Florida’s visitors.
Source: VISIT FLORIDA](https://image.slidesharecdn.com/visitflorida2014-140604033347-phpapp02/85/Visit-Florida-2014-2015-Marketing-Plan-15-320.jpg)


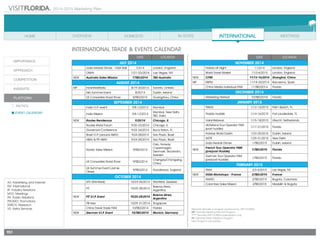
![2014-2015 Marketing Plan
130
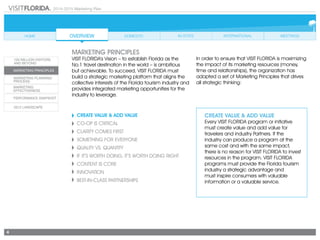
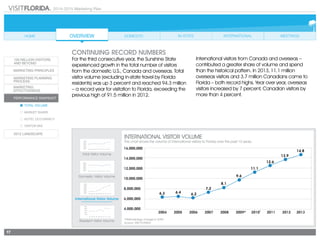
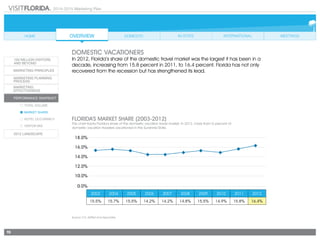
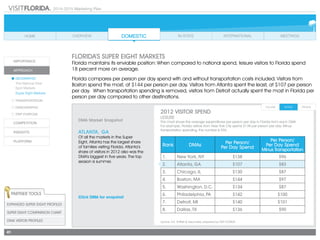
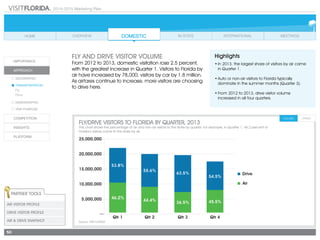
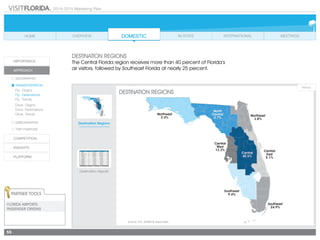
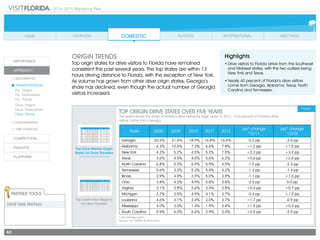
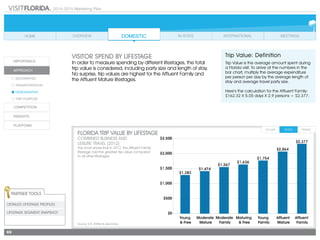
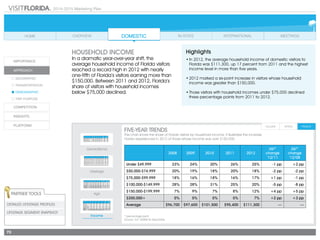
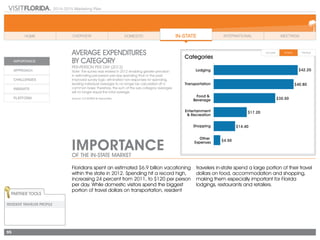
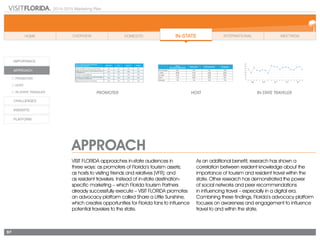
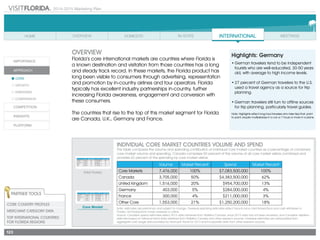
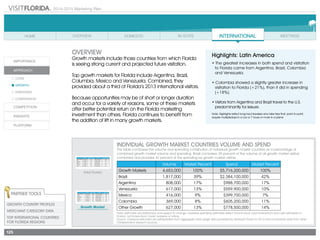
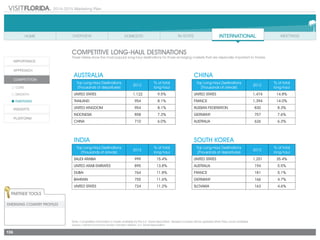
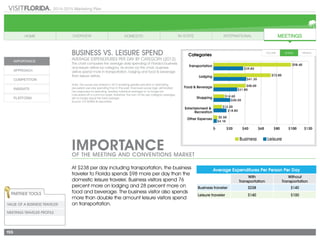
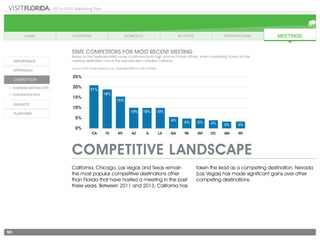
Two-Year Comparisons
This table shows [two-year] changes in volume and spending by key core, growth and emerging markets. Between 2012
and 2013, the number of international visitors increased 6 percent while spending by these visitors increased 8 percent.
Note: estimates are preliminary and subject to change
Source: Canadian visitation estimate derived using trend data obtained from Statistics Canada and the spending estimate reflects 2012 data,
since 2013 data has not been received. All other international estimates are extrapolated from aggregate card usage data provided by
VisaVue® Travel for the 2013 and incorporate data from other independent research sources.
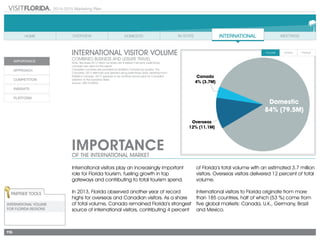
CORE, GROWTH AND EMERGING
MARKET TRENDS
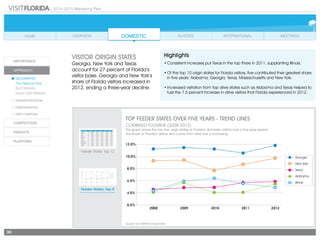
International visitation rose 6 percent and
spend rose 8 percent from 2012 to 2013. In real
numbers: an additional 832,000 visitors and
$1.2 billion. The largest increase in volume was
from growth markets, which sent an additional
472,000 visitors to the state. Growth markets also
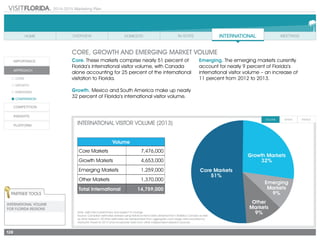
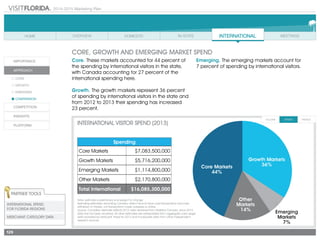
accounted for the largest increase in spending,
up 23 percent in 2013 to reach $5.7 billion.
Two Year Comparison
Visitor Volume 2012-13
Visitor Spending 2012-13
Volume Change '13/'12 Spending Change '13/'12
Total International 14,759,000 6% 16,085,300,000 8%
Core Markets 7,476,000 3% 7,083,500,000 0%
Canada 3,705,000 4% 4,383,500,000 0%
Europe 3,771,000 1% 2,700,000,000 0%
Growth Markets 4,653,000 11% 5,716,200,000 23%
South America 4,237,000 12% 5,316,500,000 25%
Mexico 416,000 7% 399,700,000 5%
Emerging Markets 1,259,000 11% 1,114,800,000 15%
Other Markets 1,370,000 3% 2,170,800,000 1%
Highlights
• In 2013, Canada and Europe sent more than 7 million visitors
to Florida. Canadian visitation was up 4 percent and European
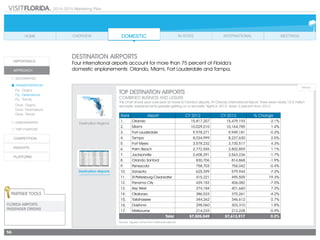
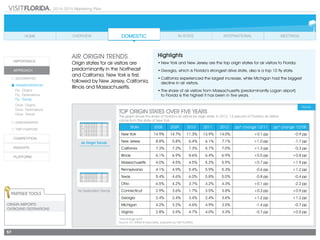
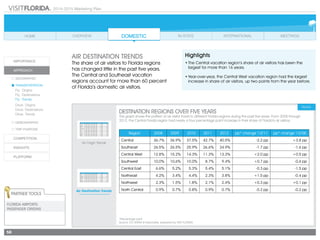
visitation was up 1 percent. Spending remained steady.
• Though emerging markets at present contribute a small
percentage of the international volume and spend, two-year
trends indicate volume increased by 11 percent and spend
increased by 15 percent.
• The momentum is in the growth markets: up 11 percent in volume
and 23 percent in spend.
Note: Percent increase reflects unrounded numbers.](https://image.slidesharecdn.com/visitflorida2014-140604033347-phpapp02/85/Visit-Florida-2014-2015-Marketing-Plan-131-320.jpg)


This document is VISIT FLORIDA's 2014-2015 marketing plan. It outlines VISIT FLORIDA's strategic goals, marketing principles, and planned marketing initiatives for the year. VISIT FLORIDA is the official tourism marketing organization for Florida that was created as a public-private partnership in 1996. The plan was developed with input from Florida's tourism industry and identifies eight objectives for 2020, including increasing tourism revenue, visitation numbers, and Florida's market share. It also describes VISIT FLORIDA's role in cooperative marketing programs and content creation to promote travel to Florida.


