Downloaded 104 times


![VMT
Unsafe Driving:
Combo Segment Straight Segment
VMT per Average PU Utilization Factor VMT per Average PU Utilization Factor
< 80,000 1 < 20,000 1
80,000 - 160,000 1 + 0.6 [(VMT per PU - 80,000) / 20,000 - 60,000 VMT per PU / 20,000
80,000]
160,000 - 200,000 1.6 60,000 - 200,000 3
> 200,000 1 > 200,000 1
No Recent VMT 1
No Recent VMT 1
Information
Information
© 2010 Vigillo LLC. All Rights Reserved.](https://image.slidesharecdn.com/vigillocsarebuiltwebinar-aug20107-100813172727-phpapp01/85/Vigillo-CSA-Rebuilt-Webinar-Slides-August-2010-11-320.jpg)
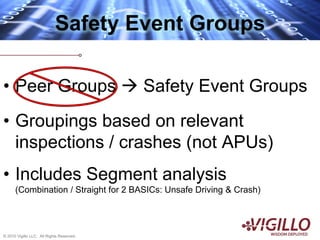
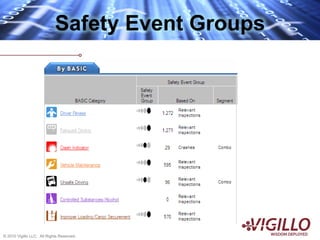
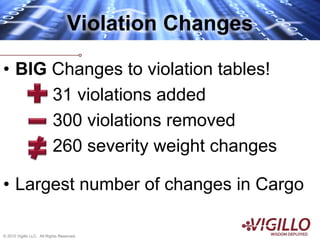
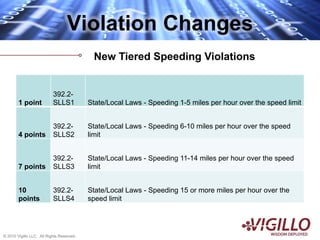
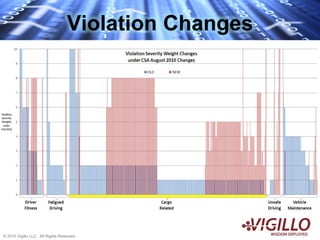
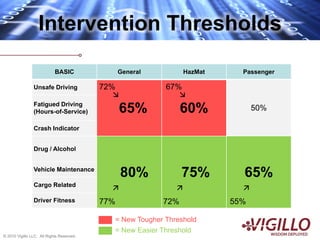

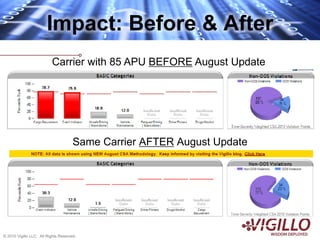
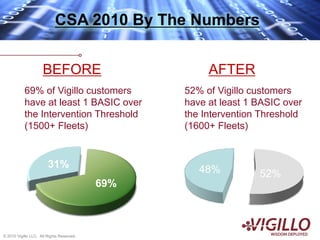
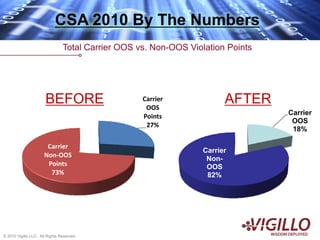
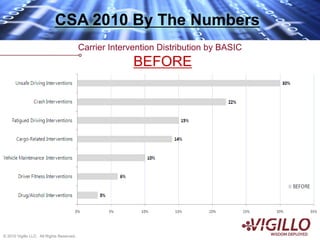
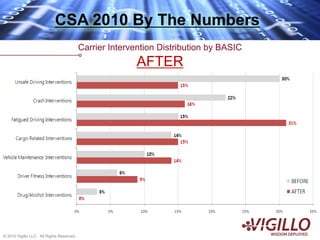
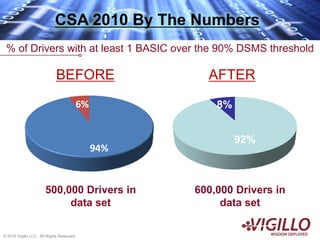


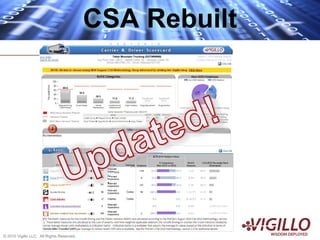
The document summarizes changes to the CSA methodology. It outlines that CSA Rebuilt includes vehicle miles travelled as a new utilization factor, evaluates carriers in safety event groups rather than peer groups, adds and removes many violations, and adjusts intervention thresholds. Analysis shows the changes result in more carriers exceeding thresholds, with unsafe driving and hours of service now the most common causes of intervention compared to before.


![Csa2010listening Session Dec 10 09 Grwoodford 2[1]](https://cdn.slidesharecdn.com/ss_thumbnails/csa2010listeningsessiondec1009grwoodford21-12604776464633-phpapp01-thumbnail.jpg?width=640&height=640&fit=bounds)


