2. VIETNAM
SELECTED ISSUES
Approved By
Asia and Pacific
Department
Prepared By Jochen Schmittmann, David Corvino (all APD),
and Mitsuru Katagiri (MCM).
ENVIRONMENT AND CLIMATE CHANGE_____________________________________________ 3
A. Climate Change Risks _______________________________________________________________ 3
B. Environmental and Resource Sustainability_________________________________________ 4
C. Vietnam’s Initiatives and Commitments ____________________________________________ 6
D. Policy Considerations _______________________________________________________________ 7
DEMOGRAPHICS_______________________________________________________________________ 8
FIGURES
1. Population Structure 2014 __________________________________________________________ 9
2. Fertility, Life Expectancy, and Population Growth___________________________________ 9
3. Population by Age Groups__________________________________________________________ 9
4. Number of Years for the Old Age Dependency Ratio to Increase from 15 percent
to 20 percent ______________________________________________________________________ 10
5. Per Capita Income Level at the Peak of Working-Age Population Share __________ 10
6. Baseline Growth Impact of Demographic Trends, Impact of Aging on TFP, and
Impact of Higher Labor Force Participation________________________________________ 11
7. Work Force Decomposition by Productivity Impact of Aging______________________ 11
FINANCIAL DEEPENING ______________________________________________________________ 13
A. Financial Development, Capital Misallocation and Growth ________________________ 13
B. Credit Growth and Financial Stability ______________________________________________ 16
C. Conclusions________________________________________________________________________ 16
References _____________________________________________________________________________ 18
CONTENTS
May 23, 2017
3. VIETNAM
2 INTERNATIONAL MONETARY FUND
CREDIT MISALLOCATION AND ECONOMIC GROWTH IN VIETNAM ______________ 19
A. Introduction _______________________________________________________________________ 19
B. Banking Model of Credit Misallocation ____________________________________________ 21
C. Credit Misallocations and SOEs in Vietnam________________________________________ 29
D. Conclusion and Policy Implications ________________________________________________ 31
FIGURE
1. Policy Effects of Recapitalization___________________________________________________ 27
TABLES
1. Loan Rates and Profitability________________________________________________________ 30
2. Debt Growth and Profitability______________________________________________________ 30
References _____________________________________________________________________________ 32
4. VIETNAM
INTERNATIONAL MONETARY FUND 3
ENVIRONMENT AND CLIMATE CHANGE1
Vietnam’s economy and population are expected to be increasingly affected by climate change. In
addition, the country’s growth model—which permitted quick reduction of poverty—has been
unsustainably relying on mining and natural resources and air, land and water pollution increased.
Well aware of the critical challenges faced by the country, the government has undertaken numerous
initiatives and programs to adapt the economy to climate change risks and transform the growth
model to support an environmental-friendly economy, but significant challenges remain.
A. Climate Change Risks
1. Vietnam is highly affected by climate change. Its long coastline, geographic location, and
diverse topography and climates contribute to Vietnam being one of the most hazard-prone
countries in the Asia-Pacific region. Given the high concentration of the population and economic
assets in coastal lowlands and the significant role played by agriculture and fisheries in the
economy, Vietnam is ranked among the five countries likely to be most affected by climate change.2
Over the last 50 years, temperatures have increased twice as fast as the global average, the sea level
has risen by 20 centimeters and the frequency and intensity of extreme weather events (drought,
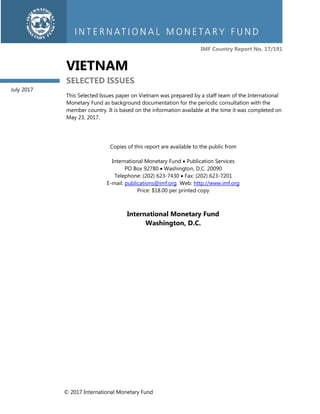
flood, salinization) have risen sharply. 3 Natural disasters result in 470 fatalities and cost 0.8 percent
of GDP (annual average between 1990 and 2016).4
2. Climate risks pose immense challenges. Based on the authorities’ climate change
scenarios, by the end of the century, sea levels are expected to rise by up to a meter. Sea waters
would then cover 40 percent of the Mekong Delta area (where half of the country’s rice is
produced), 3 percent of coastal provinces and 20 percent of Ho Chi Minh City, impacting directly
1
Prepared by David Corvino (APD).
2
GFDRR Country Profile for Vietnam.
3
Vietnam National strategy on climate change.
4
Cred EM-DAT database. Includes climatological, hydrological and biological disasters.
0
0.005
0.01
0.015
0.02
0.025
0.03
0.035
0.04
1980
1982
1984
1986
1988
1990
1992
1994
1996
1998
2000
2002
2004
2006
2008
2010
2012
2014
Natural Disasters, 1980–2015
(per thousand sq.km)
Vietnam
South-East Asia
World
Source: EM-DAT; WDI; and IMF staff calculations
0
0.5
1
1.5
2
2.5
3
3.5
Total damage Total affected Fatalities
(in percent of GDP) (in percent of population) (per 100,000 people)
Impact of Natural Disasters, 1990–2015
(average over the period)
Vietnam
South-East Asia
World
Source: EM-DAT; WDI; and IMF staff calculations
5. VIETNAM
4 INTERNATIONAL MONETARY FUND
10–12 percent of the population and reducing GDP by 10 percent. The sectors most affected will be
agriculture, aquaculture, energy transportation and tourism.
3. Climate change could threaten agricultural development and food security. Overall, the
contribution of the primary sector was 15 percent of GDP in 2016—in decline from 18 percent in
2010—and employed about 45 percent of the labor force. Agricultural commodity exports
accounted for 13 percent of total exports in 2016 (US$22 billion). Rising sea levels already cause
agricultural lands to narrow and increase the frequency of sea water intrusion episodes, particularly
in deltaic regions. Climate change is also likely to increase the frequency, severity and intensity of
hydro-meteorological events, lengthen droughts during dry seasons and strengthen floods in rainy
seasons. Absent adaptation measures, key crop yields (rice, coffee, maize, cassava) and their
production would be strongly affected, impacting rural income, food security, and commodity
exports. In 2016, rice production fell by 1.1 million tons due to salinization in the Mekong Delta.
Rice, which is grown by nearly 80 percent of Vietnamese farmers on 45 percent of the agricultural
land, could see its production decrease by 9 million tons (13 percent) by 2050. Climate change is
also likely to affect fisheries, aquacultures, and forestry.
4. Other sectors, such as energy and transportation, are vulnerable to climate change.
Changing temperature trends will affect the demand for a variety of energy-related services, such as
air-conditioning, industrial cooling and agriculture drainage pumps. A 1 degree Celsius rise in
summer temperatures is expected to raise energy demand by 1 percent. This change will occur in
conjunction with the increased energy demand from population growth and improvement of living
standards in Vietnam. Like most infrastructure-intensive industries, energy and transportation are
vulnerable to the impacts of extreme climatic events. Studies indicate that a rise of 1 meter in sea
level would submerge 10,000 kilometers of roads. Increased rainfall variability and intensity will
affect hydropower generation and cause landslides in the uplands, which would damage road and
railway networks.
5. Climate change risks will weigh on the Vietnamese population. Lower agricultural
incomes, the erosion of coastal land and the deterioration of some arable land will have adverse
effects on poverty reduction and could accelerate rural to urban migration. A significant portion of
Vietnam’s urban population lives in informal settlements, making them vulnerable to excessive heat,
floods and violent storms. Coastal cities are particularly exposed to many risks, including sea-level
rise, increased tropical storm intensity and sudden river flooding, exacerbated by the lack of suitable
drainage facilities. Ho Chi Minh City, whose population approaches close to 10 million, is projected
to be among the cities in the region most affected by sea-level rise and increased storm surges.
B. Environmental and Resource Sustainability
6. Rapid resource-intensive development and war have resulted in environmental
degradation and destruction of natural capital, despite rapid economic development. Rapid
industrialization since the 1990s has led to impressive growth and poverty reduction. But growth has
relied on intensive, unsustainable exploitation of mining and other natural resources. Vietnam’s
stock of natural capital has declined as mineral and non-mineral resources were depleted and air,
6. VIETNAM
INTERNATIONAL MONETARY FUND 5
land and water pollution increased. Legacy issues related to war add to the urgency of
environmental upgrade in Vietnam, especially the need to complete cleanup of dioxin hotspots and
more effective social policies to deal with longer term health effects (hereditary diseases and birth
defects in the affected areas).
7. Vietnam’s Adjusted Net Saving (ANS), a comprehensive indicator of changes in the
country’s wealth, is significantly less than national saving as conventionally measured. ANS
was developed at the World Bank. It corrects national saving as conventionally measured for
changes in natural capital (N) and human capital (H). N consists of reproducible and non-
reproducible mineral and non-mineral resources, including environmental resources such as clean
air, water and soil. Changes in H are proxies by education spending. ANS is defined as Net National
Savings (NNS) corrected for resource depletion, environmental degradation, and education
spending. Despite strong education spending, Vietnam’s intensive oil production and CO2 and
particulate emissions have caused ANS to be strongly lower than the NNS. In recent years, lower oil
production has reversed that trend, and in 2014, the gap was close to zero.
8. Agriculture and industry have contributed significantly to degradation of natural
capital. Vietnam is one of the largest users of fertilizer in the world which, together with intensified
livestock production, contributes largely to polluting land and water. Deforestation and erosion
problems are an issue in certain regions where arable land is needed for agriculture. Shrimp
aquaculture and fisheries have been the cause for large-
scale destruction of mangroves and are a major source of
water pollution, due to the use of chemicals and
antibiotics. Overfishing in the near shore areas and use of
destructive methods are causing depletion of fisheries, a
primary source of livelihood for coastal communities. The
industrial boom has been accompanied by increased land
and water pollution, partly due to the absence of waste
management and control. In 2016, a steel plant released
large amounts of toxic chemical waste, killing fish along a
0.0
0.4
0.8
1.2
1.6
2.0
BRN KHM IDN LAO MYS PHL SGP THA VNM World
Carbon dioxide damage
Particulate emission damage
Vietnam: CO2 and PM damage
(In percent of GNI; 2010–14 average)
Sources: WDI; and IMF staff calculations.
0
5
10
15
20
25
30
2001 2002 2003 2004 2005 2006 2007 2008 2009 2010 2011 2012 2013 2014
Net national savings
Adjusted net savings
Vietnam: NNS and ANS, 2001–2014
(In percent of GNI)
Sources: WDI.
0
0.2
0.4
0.6
0.8
1
1.2
1.4
1.6
1.8
1961
1963
1965
1967
1969
1971
1973
1975
1977
1979
1981
1983
1985
1987
1989
1991
1993
1995
1997
1999
2001
2003
2005
2007
2009
2011
2013
GlobalHectarespercapita
Vietnam: Ecological Footprint, 1961–2013
Ecological footprint
Biocapacity
Source: Global Footprint Network.
Ecological deficit
Ecological reserve
7. VIETNAM
6 INTERNATIONAL MONETARY FUND
long stretch of coast, causing long term disruption in the livelihoods of fishermen and reducing
tourism in affected provinces by about 30 percent.
9. Air pollution is a severe problem. Vietnam is among the top ten countries affected by air
pollution: in large cities and industrial zones, levels of fine particulate matter are comparable to
China’s. Studies in Ho Chi Minh City revealed association between air pollution concentration and
hospital admissions for lung and respiratory problems, pointing out the already problematic impact
of air pollution on health. The major sources include fuel combustion by industry and the power
sector, transport domestic and commercial emissions from using coal and biomass. Greenhouse gas
(GHG) emissions are expected to double between 2010 and 2020 and triple by 2030, and the entire
population is exposed to levels exceeding WHO guidelines.
10. The energy sector is a major contributor to air pollution. Vietnam is the 20th largest user
of coal fired plants in the world. It produces a quarter of its electricity from coal, with the remaining
coming from hydroelectric power and natural gas. To meet rising energy demand, Vietnam’s current
Power Development Plan (PDP VII) emphasizes coal fired power and projects 55GW of power to be
fueled by coal in 2030, up from 14GW today. If implemented, coal would then amount for 53
percent of the country’s energy mix, which would make Vietnam the eighth largest user of coal for
energy production, with levels similar to Russia or Indonesia, despite a smaller population. In
addition to the risks and costs from relying highly on imported coal, a Harvard report estimates that
fatalities from air pollution due to coal-fired plants would rise from 4,300 to 25,000 per year. 5 In
addition, Vietnam is the most energy intensive economy in the Southeast Asia and in line with its
peer. Large reduction of GHG emissions could be made from a more energy-efficient economy.
C. Vietnam’s Initiatives and Commitments
11. Vietnam is placing climate change and the environment at the core of the country’s
development agenda. National strategies and related action plans were developed to address the
key policy issues. The National Climate Change Strategy (NCCS), issued in 2011, sets a list of
objectives and targets for the government up to 2050, with a view to: (a) improve climate change
resilience through mitigation and monitoring; (b) strengthen the country’s adaptability by lowering
5
Burden of disease from rising coal emissions in Asia, Koplitz and all, 2015
0
20
40
60
80
100
Vietnam Middle Income China ASEAN-5
Vietnam: Energy Mix, 2014
(In percent of total)
Coal Hydroelectric Natural Gas Renewable Oil Nuclear
Sources: WDI.
0
1
2
3
4
5
6
7
8
Vietnam Middle income China ASEAN
Vietnam: EnergyIntensity , 2014
(MJ/$2011 PPP GDP)
Sources: WDI.
8. VIETNAM
INTERNATIONAL MONETARY FUND 7
the risks posed by climate change; and (c) adopt a more sustainable, low-carbon growth model. The
National Green Growth Strategy (NGGS) approved in 2012, tackles environmental issues and aims at
achieving a low carbon economy and protecting natural capital. To achieve these ambitious
objectives, the strategy defines underlying targets such as the improvement of energy efficiency, the
gradual limitation of sectors generating pollution and natural resource degradation, the
development of key sustainable infrastructure (transportation, energy, irrigation and urban works)
and the reduction of GHG emissions.
12. Steps have been taken to develop cleaner and more sustainable energy sources. The
Renewable Energy Development Project, in partnership with the World Bank, plans to increase the
share of renewable energy to 30 percent in 2030 by providing credit support for renewable energy
investments and facilitating private sector participation. Progress has been made with the
operational start of several wind power plants and General Electric is investing in a US$1.5 billion
project to produce up to 1,000 megawatts of wind generated electricity by 2018. Many other
projects are in early stages, but electricity pricing remains an issue for private sector profitability.
Other notable adaptive initiatives have aimed at increasing forest plantation, improving energy
efficiency with new regulations for newly constructed office and commercial buildings and develop
public transportation networks in urban areas.
13. By ratifying the Paris Agreement on Climate in 2016, the authorities have committed
to reduce GHG emissions by 2030. Vietnam’s Nationally Determined Contributions (NDC)
comprises two main components, the mitigation of GHG emission and the adaptation to climate
change. The authorities have made the commitment to reduce GHG emissions by 8 percent
compared to business as usual, financed by domestic resources. With international support, the
reduction could attain 25 percent. In addition, Vietnam is dedicated to achieve the Sustainable
Development Goals by 2030, many of which contain targets to tackle environmental and climate
change issues.
14. To deliver climate change policies, the government as created an inter-ministerial
committee and initiated four key national programs. The National Committee on Climate
Change (NCCC), chaired by the Prime Minister and including key ministers, was established in 2012
to lead, coordinate, harmonize and monitor climate change and green growth program
implementation, including international cooperation. The NCCC defines implementation action plans
and objectives for ministries, provinces and implementing bodies. The authorities have also
introduced four policy implementation programs: (i) the National Target Program to Respond to
Climate Change (NTP-RCC); (ii) the Support Program to Respond to Climate Change (SP-RCC); (iii)
the National Scientific and Technological Program on Climate Change aiming to support the NTP-
RCC; and (iv) the National Target Program on Energy Efficiency and Conservation (NTP-EE).
D. Policy Considerations
15. Despite the initiatives discussed above, significant policy challenges remain. Climate
change financing represents a critical challenge for public financial management. Comprehensive
costing as well as identification of financing of adaptation and mitigation projects remains difficult.
9. VIETNAM
8 INTERNATIONAL MONETARY FUND
The numerous national strategies—sometimes with conflicting objectives—must be harmonized, in
order to align climate change and environmental objectives at the national, provincial and sectoral
level.
16. Environmentally friendly tax and subsidy reforms and independent environmental
regulation are an important part of the policy toolkit. Pigouvian taxes and subsidies can play a
determining role in addressing environmental issues by reflecting social costs and benefits of
production and consumption activities. They induce firms and households to adopt
environmentally-friendly behavior and incentivize green investments. It is also important to create
fiscal space to ensure that adaptation action plans be financed and that emergency funds and safety
nets are sufficient to mitigate climate change, which impacts primarily low-income households. Arms
length regulation is likewise essential.
17. Low energy prices have negative ecological impacts. Research from IMF’s Fiscal Affairs
Department estimates that to fully price negative externalities associated with fuel consumption, tax
on gasoline in Vietnam should be increased by 0.46 US dollar per liter (0.43 US dollar for diesel).6
The government’s proposal to double the environmental protection tax on petroleum
consumption—from an average of 0.11 to 0.24 US dollar per liter—is a positive development, but its
impact on vulnerable population must be carefully considered. Heightened transparency and
communication about the use of tax revenue towards improving the environment could help make
the reform better accepted by the public. Electricity tariffs must also be reviewed, to account for
externalities from energy production, incentivize investment in energy efficiency projects and
stimulate private investment, particularly in renewable energy production.
18. Measures to improve the business climate are critical to boost private investment. The
government has a key role to play in strengthening policy frameworks to enable private sector
participation in support of sustainable growth. Foreign investment is needed, predominantly in
large-scale infrastructure projects.
6
Getting Energy Prices Right: From Principle to Practice, Heine and others, 2014
10. VIETNAM
INTERNATIONAL MONETARY FUND 9
DEMOGRAPHICS1
Vietnam has enjoyed a substantial demographic dividend in the last decades. Going forward rapid
projected aging could weigh on economic growth and necessitate social security and fiscal reforms.
Managed well, this transition can go hand in hand with the Vietnamese living long, healthy,
prosperous, and productive lives.2
1. Vietnam is a young country, but
projected to undergo a demographic transition
marked by slowing population growth and
aging. Vietnam has a young population (median
age of 26) with the largest age cohorts between 20
and 34 (Figure 1). However, declining fertility rates
since the early 1970s and to a lesser extent rising life
expectance will lead to an increase in the
population’s median age (Figure 2).3 The population
growth rate is projected to fall close to zero by
2050. The working-age population share peaked in
2013 and is projected to decline over coming
decades (Figure 3). The share of the population age 65 and older (old-age population) will increase
rapidly, although from low levels, and reach close to 3½ times the current level by 2050.
2. Aging in Vietnam is projected to occur fast and at a relatively low per capita income
level. Figure 4 shows the number of years it takes for the old-age dependency ratio to increase from
15 to 20 percent. This transition is projected to take only 8 years in Vietnam, a speed of aging similar
1
Prepared by Jochen Schmittmann (APD).
2
See “Golden Aging”, World Bank 2015.
3
Vietnam has had population policies advocating a limited number of children since the 1960s. The current policy
emphasizes a family size of one to two children.
Figure 1. Vietnam: Population Structure 2014
Source: Vietnamese authorities.
Figure 2. Vietnam: Fertility, Life Expectancy,
and Population Growth
(In percent, LHS; In years, RHS)
0
10
20
30
40
50
60
70
80
90
0
1
2
3
4
5
6
7
1950
1955
1960
1965
1970
1975
1980
1985
1990
1995
2000
2005
2010
2015
2020
2025
2030
2035
2040
2045
2050
Fertility, LHS
Population growth rate, LHS
Life expectancy, RHS
Sources: UN Population Division, World Population Prospects, 2015 revision; and IMF staff calculations.
Note: Projections based on the UN's medium fertility variant.
Figure 3. Vietnam: Population by Age Groups
(Millions of Persons)
0
500
1,000
1,500
2,000
2,500
3,000
3,500
4,000
4,500
1950
1955
1960
1965
1970
1975
1980
1985
1990
1995
2000
2005
2010
2015
2020
2025
2030
2035
2040
2045
2050
Age 0-14
Age 15-64
Age 65+
Sources:UN Population Division,World Population Prospects,2015 revision;and IMF staff calculations.
Note: Projections based on the UN's medium fertility variant.
11. VIETNAM
10 INTERNATIONAL MONETARY FUND
to other Asian economies. In contrast, the same transition took 26 years in Europe and more than 50
years in the United States. The rapid speed of aging has two implications. First, Vietnam will have
less time to adapt policies to a more-aged society than many advanced economies had. Second,
Vietnam is at risk of becoming old before becoming rich, or, to put it differently, Vietnam is likely to
face the challenges of high fiscal costs of aging and demographic headwinds to growth at relatively
low per capita income levels. Figure 5 shows per capita income at purchasing power parity relative
to the United States at the historical or projected peak of the share of the working-age population
in selected advanced and Asian economies. Among these countries, Vietnam’s working age
population has reached its peak at the lowest relative per capita income level. All else equal, the
contribution of the quantity of labor to growth begins to turn negative following peak working-age
population. This underscores the need for Vietnam to sustain high growth rates in the next
decades.4
3. Demographic trends will turn into headwinds for economic growth. Vietnam has
enjoyed a substantial demographic dividend in the last decades that is gradually diminishing and
will eventually turn into a drag on growth. Demographic developments affect growth through
various channels, including the size of the labor force, productivity, and capital formation. We
establish a baseline growth impact of demographic-induced changes in labor force size assuming
unchanged total factor productivity (TFP) growth; unchanged age- and gender-specific labor force
participation rates (and employment rates); and a constant capital-to-effective-labor ratio. 5
Labor
force size changes are estimated to add close to ½ percentage point to average annual growth
between 2020 and 2050 (Figure 6). The growth effect, however, is lower than previously and could
fall to zero by mid-century. On a per capita basis, a declining labor force size is estimated to subtract
0.1 percentage points from annual average growth between 2020 and 2050.
4
Vietnam’s low per capita income suggests the possibility of continued rapid real convergence through catch up in
technology and structural transformation of the economy from low productivity activities, especially in agriculture
where 40 percent of the workforce are employed, to higher productivity activities. However, this process is not
automatic and requires good policies that facilitate strong productivity growth.
5
The estimate is based on a growth accounting framework with capital and labor as inputs. See chapter 2 in the IMF’s
Spring 2017 Asia and Pacific Regional Economic Outlook for methodological details.
Figure 4. Vietnam: Number of Years for the Old
Age Dependency Ratio to Increase from 15
Percent to 20 Percent
(Ratio, population 65+ years / population 15-64
years)
0 10 20 30 40 50 60
Singapore
Thailand
China
Vietnam
Japan
Korea
Indonesia
India
Malaysia
Philippines
Hong Kong SAR
Australia
New Zealand
United States
Europe
Sources: UN Population Division, World Population Prospects, 2015 revision; and IMF staff calculations.
Note: Projections based on the UN's medium fertility variant. The old age dependency ratio is defined as population
65+ years / population 15-64 years. Countries in green reflect historical data, countries in blue reflect projections.
Figure 5. Vietnam: Per Capita Income Level at
the Peak of Working-Age Population Share
(Purchasing power parity based; in percent of U.S.
per capita income at each country's peak)
0
20
40
60
80
100
UnitedStates
Germany
Italy
Canada
France
UnitedKingdom
Australia
Japan
Korea
NewZealand
Philippines1/
Malaysia1/
India1/
Indonesia1/
Thailand
China
Vietnam
Sources: IMF World Economic Outlook database; and IMF staff calculations based on United Nations World Population Prospects: 2015 Revision
(medium-fertility scenario).
Note: 1/ Based on IMF staff projection. For Malaysia, the income level relative to the United States is calculated from the April 2017 WEO
projection for 2020. For India, Indonesia, and the Philippines, the income levels are calculated by applying the projected purchasing power
parity per capita income growth rate in 2022, starting from 2023 and up to the year in which the working-age population share is projected to
peak, respectively.
12. VIETNAM
INTERNATIONAL MONETARY FUND 11
4. Productivity growth could be lower with an aging
workforce. Studies suggest that aging has mixed
implications for productivity growth. Factors such as
accumulation of experience over time, depreciation of
knowledge, or age-related trends in physical and mental
capabilities all play a role. We estimate the effect of
workforce aging (measured by the share of workers 55-65
years old in the total workforce) on productivity for a
sample of Asian and European countries.6
We find that an
increase in the share of older workers is associated with a
significant reduction in labor productivity growth. For
Vietnam, the share of older workers in the workforce is
projected to increase by close to 10 percentage points by 2050. This could reduce growth by 0.2
percentage points per year. The impact of aging may also differ across professions with productivity
of workers in physically demanding professions (factory workers, construction, agriculture) declining
at older ages, while productivity may increase with age in other professions such as lawyers,
managers, and doctors. Vietnam has a high share of its workforce in professions where productivity
tends to decline with age (Figure 7). This underscores the importance of structural transformation
and moving up the value chain to prepare for an aging workforce.
5. Labor force participation rates (LFPRs) are already
high in Vietnam, but there is ample scope to support
growth by reallocating labor to productive activities.
A gradual increase in LFPRs by 6 percentage points by
2050 could increase growth by 0.2 percentage points per
year.7
That said, LFPRs in Vietnam for men and women
are among the highest in the region, limiting the scope
for increases. Notwithstanding, there is room to increase
female and older worker participation in the labor force,
as well as tackling under- and low-productivity
employment. The latter is particularly relevant in Vietnam
where productivity outside the FDI sector remains very
low, informality is high, and 40 percent of the workforce
is still employed in agriculture.
6. Rapid aging will pose fiscal challenges. Under current policies, age-related public
expenditures (pensions and health care) are projected to increase by 8 percentage points of GDP by
2050, more than double the current level.8 Most of the increase would be related to pensions.
Spending on education could fall with a declining number of young people, but this is unlikely to
6
See chapter 2 in the IMF’s Spring 2017 Asia and Pacific Regional Economic Outlook for methodological details.
7
This increase in LFPRs is similar to Japan’s experience in the last two decades.
8
See Box 2.2 in the IMF’s Spring 2017 Asia and Pacific Regional Economic Outlook.
Figure 7. Work Force Decomposition by
Productivity Impact of Aging
(Percent of total workforce, latest available)
0% 10% 20% 30% 40% 50% 60% 70% 80% 90% 100%
Vietnam
Thailand
Malaysia
Hong Kong, SAR
Korea
Japan
Singapore
Australia
Increases neutral decreases not classified
Sources: Staff estimates; ILO; classification of job type by aging impact based on Venn (2008).
Note: Category productivity "increases" with age includes: managers, and professionals; Category "neutral" includes: clerical support
workers and services and sales workers; Category "decreases" includes: technicians, skilled agricultural, forestry and fishery workers, craft
Figure 6. Vietnam: Baseline Growth Impact of
Demographic Trends, Impact of Aging on TFP,
and Impact of Higher Labor Force Participation
(Percentage point impact on real GDP growth;
average over 2020-50)
-0.3
-0.2
-0.1
0
0.1
0.2
0.3
0.4
0.5
0.6
Total Baseline impact TFP growth loss due to
aging of working
population
Impact of higher labor
force participation
Sources:UN Population Division, World Population Prospects,2015 revision;Penn World Tables 9.0; and IMF
staff calculations.
Note: The baseline estimates are based on the assumptions of unchangedlabor force participationby age-
gender cohort, constant capital-to-laborratio, and TFP growth unchangedfromhistorical average.Estimated
impact of workforce aging on total factor productivity(TFP) growth follows Aiyar and others (2016) based on
a sample of Asian and European countries. The risinglabor force participation rates scenario is based on the
experience of Japan from 1990 to 2015.
13. VIETNAM
12 INTERNATIONAL MONETARY FUND
fully offset rising age-related expenditures. On the revenue side, lower growth rates because of
demographic change could weigh on fiscal revenues.
7. The existing pension system is a defined benefit pay as you go system that covers
public sector workers and workers in formal private sector jobs. The system is unsustainable
because its generous benefits. Retirement ages, at 60 and 55 for men and women respectively, are
low. General and occupational early retirement rules are generous, reducing effective retirement
ages and increasing the system’s unfunded liabilities. Benefit indexation has regularly exceeded CPI.
Accrual rates are high both in international comparison and given an actuarially reasonable internal
rate of return on contributions, resulting in replacement rates of 75 percent after 30 and 25 years of
service for men and women, respectively. Pension fund reserves are poorly invested, with returns
below GDP growth. The pension system is also inequitable across private and public sector
employees and across the covered and uncovered population. Land reform to give peasants title to
land that can be traded and sold could be an effective old age insurance mechanism for large parts
of the rural population.
8. Long-term demographic challenges underscore the need for policies to raise the
economy’s growth potential and reform the social security system. Vietnam needs to achieve
high and sustained growth in the next decades before demographic developments become a
significant drag on growth. Faster productivity growth is needed while reducing the factor intensity
of growth. Key areas for reform to boost the economy’s growth potential and facilitate structural
transformation are SOE and banking reforms to achieve a level playing field for the private sector
and improve the allocation of capital. Growth-friendly fiscal consolidation is needed to strengthen
public finances before rapid aging sets in. On pensions, near-term reforms should raise retirement
ages and address early retirement, accrual rates and indexation.
14. VIETNAM
INTERNATIONAL MONETARY FUND 13
FINANCIAL DEEPENING1
Vietnam’s rapid financial deepening since the early 2000s has been punctuated by bouts of
instability. The financial system remains bank-centered and dominated by the state, credit growth
has been rapid, and the output efficiency of credit has declined, pointing to inefficient allocation.
Wide ranging bank reforms are needed to create a level playing field for access to credit; raise the
level and efficiency of investment; and increase financial sector resilience. Deeper financial
markets and institutions are also critically needed to finance investment, including in
infrastructure.
A. Financial Development, Capital Misallocation and Growth
1. A long literature documents that financial development has the potential to boost
economic growth, raise financial and economic inclusion and increase a country’s
resilience to shocks. Gine and Townsen, 2004; Jeong and Townsend, 2007,2008; Amaral and
Quintin,2010; Buera et al., 2011; Greenwood et all., 2013 have found sizeable impacts of
improved financial intermediation on aggregate productivity and income. King and Levine,
1993; Levin, 2005; support by empirical evidence the view that financial deepening spurs
economic growth Financial institutions and markets help to mobilize savings, promote
information and risk sharing sharing and improve resource allocation. The diversification and
management of risk promotes financial stability to the extent that deep and liquid financial
systems with diverse instruments help dampen the impact of shocks.
2. Vietnam’s financial system remains bank-centric and dominated by state-owned
banks, while non-bank financial institutions are relatively small and are only now being
actively nurtured. Vietnamese financial system is large for a middle-income country but credit
institutions account for the largest share. In 2016, banking sector assets amounted 194 percent
of GDP and accounted for more than 96 percent of the financial sector assets (insurance
companies: 3 percent; and securities and fund management companies: 1 percent). The four
major state-owned credit banks (SOCBs) account for 45 percent of the banking sector assets
and provide half of total credit which, despite cutbacks in recent years, remains heavily tilted
towards the SOE sector. Stock market capitalization increased to 33 percent of GDP, from 27
percent in 2015. Attracting foreign capital remains challenging due to (i) the lack of
diversification of securities products; (ii) the under-developed corporate bonds market; (iii) the
large share of state-owned capital in many enterprises; and (iv) the low freedom level of capital
mobility and the administrative constraints faced by foreign owners.
1
Prepared by David Corvino (APD).
15. VIETNAM
14 INTERNATIONAL MONETARY FUND
3. Vietnam’s rapid economic development during the last decade reflects rapid growth
in bank credit, including to the private sector. Credit growth has averaged 24 percent in the
last ten years. On average, the credit-to-GDP ratio expended by 4.8 percentage point per
annum between 2000 and 2015 and reached 124 percent of GDP at end-2016, exceeding the
ASEAN-5, other middle income countries, and significantly exceeding countries at similar levels
of development.
4. With rapid credit growth, the productivity of credit and rates of return to investment
have deteriorated. The credit intensity of growth has risen, with real credit growing almost
three times faster than real GDP. Credit targets—by bank and by sector of activity—remain in
effect, creating inefficiencies in the allocation
of capital across enterprises, between and
within industries. Although the share of SOEs
in total credit has declined (15 percent of total
in 2016), in line with authorities’ plan to
reduce state investment in non-core areas,
some poor performing SOEs remain highly
leveraged. Legacy problems and NPLs remain
unresolved, including through regulatory
forbearance, and the banks are hampered by
low capital ratios. A growing share of loans is
going to real estate, financial and personal sectors including mortgages. Real estate investment
expanded by 29 percent per year on average in real terms over the last decade while average
annual output growth in the sector was a meager 5.2 percent over the same period.2
5. Small and medium enterprises (SMEs) face barriers to credit, adding to the credit
misallocation problem. In 2015, according to a survey on Vietnamese enterprises3
, access to
finance was the main business environment constraint for the SMEs. Only 29 percent of the
2
The World Bank, “Vietnam systematic country diagnostic 2016”.
3
The World Bank, Enterprise Surveys, Vietnam 2015.
Source: World Bank.
20
40
60
80
100
120
2000 2001 2002 2003 2004 2005 2006 2007 2008 2009 2010 2011 2012 2013 2014 2015
Credit to Private Sector
(In percent of GDP)
Vietnam ASEAN-5 Middle income
Sources: World Bank; and IMF staff estimates.
Vietnam
0
20
40
60
80
100
120
140
0 2000 4000 6000 8000 10000
Credittoprivatesector
(inpercentofGDP)
GDP per Capita (PPP)
Credit-to-GDP ratio and GDP per Capita, 2015
-1.5
0
1.5
3
4.5
6
7.5
2000
2001
2002
2003
2004
2005
2006
2007
2008
2009
2010
2011
2012
2013
2014
2015
2016
2017
Vietnam: Credit Intensity of Growth
(In percent)
Sources: Vietnamese authorities; and IMF staff estimates.
16. VIETNAM
INTERNATIONAL MONETARY FUND 15
small enterprises (1–20 employees) have an active line of credit versus 57 percent of large firms
(+100 employees). Domestic SMEs compete for credit with SOEs and large domestic enterprises
with preferential access to resources. Consequently, their investment is subdued and is largely
internally financed.
6. Credit misallocation and SME financing constraints contribute to a low share of
investment in GDP (down by 10 percentage points since 2005) and are keeping Vietnam
from reaching a higher growth path. The private sector has not benefited from cutbacks in
SOE investment and non-state sector investment has stagnated around 12 percent of GDP.
Public investment efficiency is hampered by tight fiscal space and lack of coordination in a
fragmented general government. Local governments—which now account for about 80 percent
of total state budget investment—and SOE tend to select and undertake their own
infrastructure projects without employing a strategic approach linked to national priorities.
7. A new financial development index created by the Fund indicates that Vietnam’s
financial sector development has improved during the last two decades but remains
below emerging markets. The components of the Financial Development Index reveal that
Vietnam’s financial depth and efficiency are at its peers’ level for both institutions and markets.
However, access to financial institutions is low, owing to the relatively small amount of bank
branches and ATMs per capita (respectively 4 and 24 per 100,000 adults).
8. Vietnam could benefit from further financial development, improving access to
financial services and developing capital markets and institutions. Empirical analysis
indicates that there is a bell-shaped relationship between financial development and growth4
.
Financial development increases growth up to a certain point (between 0.45 and 0.7 on the FD
index) after which, further development has a negative impact. Research found that the
weakening effect on growth at higher levels of financial development can be attributed to
financial deepening, rather than to higher access or greater efficiency. In the case of Vietnam,
estimates suggest that improving access to financial services to individuals and SMEs could help
boost growth by an additional percentage point each year.
4
SND15/08 Sahay and others, “Rethinking Financial Deepening: Stability and Growth in Emerging Markets “
Source: IMF staff estimates
0
0.1
0.2
0.3
0.4
0.5
0.6
Financial Development Index, 1995–2014
Vietnam
ASEAN-5
Emerging Markets
Source: World Bank.
0.00
5.00
10.00
15.00
20.00
25.00
30.00
35.00
40.00
Bank branches per 100,000 adults ATMs per 100,000 adults
Financial Institutions Access, 2014
Vietnam
Middle income
East Asia & Pacific (developing)
17. VIETNAM
16 INTERNATIONAL MONETARY FUND
B. Credit Growth and Financial
Stability
9. Vietnam’s credit-to-GDP ratio is now
close to levels reached during previous
periods of macroeconomic instability,
signaling potential risks ahead. Past credit
cycles led to deteriorating quality of bank
balance sheets and higher inflation. The most
recent ones, in 2008 and 2011, were
characterized by large shares of credit directed
to SOEs and to the real estate sector. They were
followed by surges of inflation—over 20
percent—and engendered a sharp rise of NPLs
and significant weaknesses in the banking
sector, which are still weighing on the real
economy.
10. Regression analysis indicates that
credit in Vietnam is 40 percent of GDP
greater than expected. Specifically, a random-
effects regression linking credit to fundamentals
and using international panel data was
estimated following closely Cottarelli and others
(2004)5
. The fundamentals are: public debt, GDP
per capita, inflation, capital account openness,
bank regulation indicators, legal origin and a
time trend. The coefficients are then applied to
Vietnam’s fundamentals to determine the
expected level of credit to the private sector.
The results show that an appropriate level of
credit-to-GDP ratio would be around 80 percent
and that the gap has widen in recent years.
C. Conclusions
11. Vietnam’s economy would reap large benefits from financial sector reforms. Bank
and SOE reforms, for instance the phasing out of credit targets, lifting interest rate ceilings and
the establishment of a level playing field for access to credit, would improve credit allocation,
reduce market distortions and foster private sector investment and productivity. Deeper
5
Cottarelli and others, 2004, “Early Birds, Late Risers, and Sleeping Beauties: Bank Credit Growth to the Private Sector
in Central and Eastern Europe and the Balkans”
Source: IMF staff estimates.
Sources: Vietnamese authorities; and IMF staff estimates.
-5
0
5
10
15
20
25
30
-20
-15
-10
-5
0
5
10
15
20
25
30
2001Q1
2001Q4
2002Q3
2003Q2
2004Q1
2004Q4
2005Q3
2006Q2
2007Q1
2007Q4
2008Q3
2009Q2
2010Q1
2010Q4
2011Q3
2012Q2
2013Q1
2013Q4
2014Q3
2015Q2
2016Q1
2016Q4
Credit-to-GDP Cycles, 2001Q1–2016Q4
Credit cycle (HP Filter)
Inflation (EOP, RHS)
Source: IMF staff estimates.
0
20
40
60
80
100
120
140
20002001200220032004200520062007200820092010201120122013201420152016
Credit to Private Sector - Predictions based on
fundamentals
(In percent of GDP)
Actual
Prediction
18. VIETNAM
INTERNATIONAL MONETARY FUND 17
financial markets and institutions are also needed to finance investment, including in
infrastructure.
19. VIETNAM
18 INTERNATIONAL MONETARY FUND
References
Amaral, P. S. and E. Quintin (2010, 08). Limited Enforcement, Financial Intermediation, And
Economic Development: A Quantitative Assessment. International Economic Review.
Buera, F. J., J. P. Kaboski, and Y. Shin (2011, August). Finance and Development: A Tale of Two
Sectors. American Economic Review.
Gine, X. and R. M. Townsend (2004, August). Evaluation of financial liberalization: a general
equilibrium model with constrained occupation choice. Journal of Development
Economics.
Greenwood, J., J. Sanchez, and C. Wang (2013, January). Quantifying the Impact of Financial
Development on Economic Development. Review of Economic Dynamics.
Jeong, H. and R. Townsend (2007, July). Sources of TFP growth: occupational choice and
financial deepening. Economic Theory.
Jeong, H. and R. M. Townsend (2008, September). Growth And Inequality: Model Evaluation
Based On An Estimation-Calibration Strategy. Macroeconomic Dynamics.
King, R. G. and R. Levine (1993, August). Finance and Growth: Schumpeter Might Be Right. The
Quarterly Journal of Economics.
Levine, R. (2005, December). Finance and Growth: Theory and Evidence. In P. Aghion and
S. Durlauf (Eds.), Handbook of Economic Growth, Volume 1 of Handbook of Economic
Growth.
20. VIETNAM
INTERNATIONAL MONETARY FUND 19
CREDIT MISALLOCATION AND ECONOMIC GROWTH
IN VIETNAM1
The legacy of non-performing loans (NPLs), scarcity of funds for recapitalization and resulting
credit misallocation between the favored sector (proxied by SOEs) and the rest of the economy
(non-SOEs) is an important policy issue in Vietnam, weighing on the efficiency of resource
allocation and economic growth. This paper presents a theoretical and empirical analysis of the
issue. A simple banking model is embedded in a political economy setting to assess the factors
determining the extent of recapitalization and its effects on economic growth. The analysis
suggests that the extent of recapitalization depends on an array of factors, including the tightness
of the government budget constraint, the productivity of its spending, and concern for the favored
sector. Our empirical analysis using corporate data indicates credit misallocation between SOEs
and non-SOEs in Vietnam. We also draw lessons for Vietnam from case studies of the
international experiences with NPL resolution.
A. Introduction
1. Credit misallocation between private firms and SOEs or other favored enterprises
have been observed in other economies transitioning from the centrally planned
economy. In China, credit misallocation between SOEs and non-SOEs was pointed out as a
main source of low aggregate productivity (Hsieh and Klenow, 2009; Dollar and Wei, 2007).
Also, in central and eastern Europe, resolution of credit misallocation between SOEs and non-
SOEs was one of the central issues in the transition to market-based economies.2
2. This paper takes up the issue for the case of Vietnam, where, it has been argued, that
economic growth is constrained by resource misallocation between State owned enterprises
(SOEs) and non-SOEs. In particular, the claim is that commercial banks lend to underperforming
SOEs at unnaturally low rates, thus preventing profitable non-SOEs’ access to credit and
suppressing economic growth via credit misallocation. While there is only limited data about
NPLs for SOE lending, it is considered that the soundness of the banking sector in Vietnam has
been deteriorated by the weak SOE sector.3
Credit Misallocation and Economic Growth
3. China’s experience in the late 1990s implies that the long-term return from
resolving credit misallocation is high. China intensified restructuring policies on SOEs and
1
Prepared by Mitsuru Katagiri (MCM).
2
See Appendix V in Maliszewski et al. (2016) for more detail.
3
For instance, IMF (2013) emphasizes the relation between SOE lending and banking sector soundness.
21. VIETNAM
20 INTERNATIONAL MONETARY FUND
associated NPL problems in the late 1990s, and as a result of the restructuring policies, SOEs'
share in total industrial assets dropped from 90% in 2000 to 40% in 2015.4
While the SOE
reform entailed some short-term economic costs including high unemployment rates, the SOE
reform is considered one of the main drivers of China’s high economic growth, starting in the
late 1990s (Hsieh and Klenow, 2009; Song, Storesletten, and Zilibotti, 2011).
Resolving NPLs by Asset Management Companies (AMCs)
4. International experience suggests that NPL resolution by AMCs such as the
Vietnam Asset Management Corporation (VAMC) has some advantages. First, due to
economies of scale, AMCs make it possible for banks, particularly smaller banks, to resolve NPLs
efficiently. Second, considering the specific expertise for resolving NPLs, it is efficient for banks
to focus on new lending by allowing AMCs to concentrate on NPL resolution.
5. While there is no single optimal solution for NPL resolutions, international
experiences indicate common factors that contribute to successful NPL resolution by
AMCs.5
They include (1) enough legal powers, (2) pricing NPLs at market prices with strict
supervisory policies, and (3) ample capital buffers.
6. AMCs should have enough legal powers. For this purpose, proper insolvency systems
to facilitate out-of-court workout are important. When the existing legal system is not
equipped, the government can grant special legal powers to AMCs.
Several countries created an enhanced out-of-court framework for NPL resolution
(Korea, Thailand, Indonesia, and Malaysia).
Danahara (Malaysia) can appoint special administrators without having to go to court,
and readily foreclose on collateral.
7. Transferring NPLs at market prices is necessary to clarify the cost of NPLs and
prevent moral hazard. When it is difficult to compute market values of NPLs, the price should
be computed by standardized methods based on recovery rates, cash flow projections, and
collateral values. Furthermore, a strict supervisory policy should be simultaneously implemented
to encourage prompt recognition of losses incurred by reevaluation.
Danaharta (Malaysia) established standardized parameters to determine the market
value of NPLs, and purchased them at an average discount of 55 percent. For unsecured
loans, the market value was 10 percent of the principal amount outstanding. Banks who
sold NPLs retained a right to receive 80 percent of recoveries. Asset transfers were not
compulsory, but when banks whose NPL ratios were more than 10% refused to sell
NPLs, they had to decrease their book value to 80 percent of Dahanarta’s offered price.
4
See Appendix III in Maliszewski et al. (2016) for more detail.
5
In what follows, the argument is based on Ingves et al. (2004) and Cerruti and Neyens (2016).
22. VIETNAM
INTERNATIONAL MONETARY FUND 21
KAMCO (Korea) purchases NPLs as 45 percent of collateral value for secured loans and
3 percent on unsecured loans (on average, 35 percent of nominal values). The supervisor
instructed banks to separate out nonviable firms, following specific forward-looking
criteria and leverage levels.
8. Weak capital buffers make banks reluctant to resolve NPLs. If the bank becomes
undercapitalized due to credit losses incurred by NPL resolution, recapitalization by public
funds is one option. While purchasing NPLs at above market prices helps recapitalize the
banking sector, it conceals the cost of recapitalization from the public.6
Jobst et al. (2016) shows that banks with lower capital adequacy ratios tend to choose
smaller provisioning to NPLs in Europe. Similarly, Peek and Rosengren (2005) shows that
undercapitalized banks tended to conduct forbearance lending in Japan.
In China, NPLs were purchased by AMCs at the face values. The NPL resolution in 1999
was effectively financed by both AMC bonds (55 percent) and PBC credit (45 percent).
Since the PBC balance sheet suffered due to low cash recovery rates, this is a double act
of NPL removal and bank recapitalization (Ma, 2006).
9. Given these international experiences, this paper provides a model and empirical
analysis on forbearance lending, credit misallocation, and economic growth. First, it gives
a simple model based on the bank’s optimization and clarifies the importance of bank’s capital
buffers for resolving credit misallocation. Second, given the effect of recapitalization, it
examines when to carry out recapitalization enough to achieve the first best outcome from a
political economy viewpoint. Empirical evidence supporting these theoretical predictions are
also provided at last.
B. Banking Model of Credit Misallocation
10. A simple two-sector banking model to understand causes and consequences of
credit misallocation is proposed. We extend the Monti-Klein model, where a representative
bank has monopolistic powers in lending and deposit markets, by putting particular emphasis
on the importance of bank capital buffer to resolve the NPL problems and associated credit
misallocation.7
After establishing the equilibrium in a banking sector, we investigate the
government policy on bank recapitalization from a political economy perspective to understand
what can be constraints for the resolution of NPL problems through bank recapitalization.
Bank’s Optimization and Equilibrium Behavior
Corporate Sector
6
Ingves et al. (2004) criticize such indirect capitalization through AMCs due to its opaqueness while Cerruti and
Neyens (2016) take it as one of advantages for NPL resolution by AMCs.
7
See, for example, the chapter 3 in Freixas and Rochet (2008) for the prototype Monti-Klein model.
23. VIETNAM
22 INTERNATIONAL MONETARY FUND
11. Production takes place in two sectors, a high-productivity sector (H sector) and a
low-productivity sector (L sector), and requires working capital financed by bank credit.
In each sector , , firms have production functions,
and
where is output, is the amount of capital (i.e., credit), and is productivity satisfying
. While the H sector’s production function is assumed to be decreasing return to scale, 1,
as in a standard model, the L sector’s production function is assumed to be linear for the
analytical purpose. We think of the L sector as representing inefficient, lower productivity SOEs
that have a stock of legacy NPLs. The profit maximization by firms in each sector is formulated
as
max , and max ,
where , and , are lending rates in each sector.
12. The first order conditions for firms gives the following loan demand functions in
the H and L sector.
,
and ,
These loan demand functions are treated as given for banks when they optimally choose their
lending rates.
Bank's Optimization Problem
13. A representative bank lends to firms and invests in riskless bonds by their own
equity and deposits. The bank’s balance sheet is:
where is bonds, is deposits, and is equity. The bond gives the riskless market return, ,
which is totally exogenously determined in the model.
14. Given the initial amount of credit to the L sector , the bank chooses the amount
of NPL resolution. In what follows, we use the amount of NPLs and the amount of credit to the
L sector interchangeably. The law of motion for becomes,
1
where is the fraction of NPLs resolved, which is the bank’s choice variable. The resolution of
NPLs incurs a loan impairment cost and erodes the bank’s equity,
̅
24. VIETNAM
INTERNATIONAL MONETARY FUND 23
where 0 1 is the loss given default (LGD) for NPLs. The initial value of capital, ̅, consists
of the equity which the bank accumulated until the current period, , and the capital injected
by the government, . That is, ̅ , and the bank takes as being beyond its control.
The supply of deposits is determined by the following deposit supply function,
̅
where is the deposit rate and 0 is the elasticity of deposit supply.
15. The bank optimally chooses deposit and lending rates as well as the amount of
NPL resolution under several constraints including the capital constraint. The bank
maximizes the profit,
, ,
by choosing , , , , and , subject to (i) the law of motions for and given the initial
value for NPL, , and equity, ̅ , (ii) the budget constraint, (iii) the deposit supply
function, (iv) the loan demand functions in each sector, and (v) the capital constraint,
.
which indicates that the equity-debt ratio must be higher than .
Optimal Deposit Rate, Lending Rate, and NPL Resolution
16. The optimality conditions for the bank’s maximization problem give the optimal
lending rate, deposit rate, and the amount of NPL resolution. First, the deposit rate is,
∗
1
.
where / 1 is a mark-down for deposit rates Second, the lending rates in each sector
become,
,
∗
and ,
∗
where is a Lagrange multiplier for the capital constraint Note that the lending rate would be
higher when the capital constraint binds, which implies that undercapitalization causes higher
lending rates and entails insufficient credit supply. Finally, the optimal amount of NPL resolution
in equilibrium, ∗
, is determined as,
∗
∗
1
where ∗ ,
∗
and ,
∗
. An interesting result here is that the equilibrium value of
∗
is an increasing function of the capital injection by the government, . Hence, the
equilibrium behavior for ∗
implies that the capital injection by the government can help the
bank resolve more NPLs as investigated in the following comparative statics.
25. VIETNAM
24 INTERNATIONAL MONETARY FUND
Policy Effects of Recapitalization
17. Given the bank’s optimal behavior in equilibrium, the policy effects of
recapitalization, , are analyzed by comparative statics. To visually show the result of this
exercise, the model parameters are calibrated as follows. The capital ratio must be higher than
9 percent, which means 0.1, and LGD is 30 percent, 0.3. The NPL in the initial period, ,
is set so that the NPL ratio is equal to 12 percent. Both the market return and the return in
the good sector are set to 1.06 based on the average growth rate in Vietnam. Then, the
elasticity of deposit demand and the curvature of production function are chosen so that
the deposit and lending rate are equal to 5 percent and 9 percent, respectively. The most
important and difficult parameter to be set is the return in the bad sector . I set 0.7 for
illustration. Note that the quantitative result would depend this value, but the qualitative
implication does not change. Finally, the initial value of equity, ̅, is chosen so that the
resolution of NPLs is 20 percent without capital injection, 0.
18. The government’s recapitalization policy is evaluated by macroeconomic
performance and bank's profitability measures. First, the aggregate output, , and the
aggregate productivity, , are defined as
and
.
Note that the aggregate productivity would be increased if the bank credit is more allocated to
the H sector because . In other words, the credit misallocation to the L sector lowers the
aggregate output via decreasing the aggregate productivity, . Second, the bank's profitability
is measured by the following net interest margin (NIM) for loans and deposits,
. ,
.
We investigate macroeconomic consequences of credit misallocation by evaluating the effects
on those variables through comparative statics.
19. The equilibrium amount of NPL resolution, , is increasing with respect to the
government’s capital injection, (Figure 1-1). This is because, under the capital constraint,
the bank needs enough initial capital buffers, , for NPL resolution to absorb the credit
losses incurred by the NPL resolution. Otherwise, the NPL resolution would cause a serious
capital shortage and consequently force the bank to substantially reduce the amount of credit
to meet the capital requirement.
20. This equilibrium relationship between bank capital and NPLs implies that the
government can facilitate the resolution of NPLs. The government can help the bank resolve
more NPLs through increasing recapitalization by public funds, . Since the full NPL resolution
26. VIETNAM
INTERNATIONAL MONETARY FUND 25
( 1) would be realized at some point as the capital injection by the government, ,
continues to increase, we will discuss the policy implication of recapitalization separately
between (i) the second-best case (i.e., partial NPL resolution, 1), and (ii) the first-best case
(i.e., full NPL resolution, 1).8
The Case of Partial NPL Resolution ( 1, the second best)
21. In the partial NPL resolution case, credit misallocation entails some growth cost by
lowering aggregate productivity. Since the banking sector is still undercapitalized, it cannot
resolve all NPLs. As shown in the equilibrium amount of credit across the two sectors (Figure 1-
2), while the credit to the L sector proportionally decreases as the bank’s capital buffers
increase, some firms in the L sector continue operating thanks to forbearance lending in this
case. Given the fact that , the credit misallocation due to undercapitalization lowers
aggregate productivity compared with the case of full NPL resolution.
22. Unless NPLs are fully resolved, credit to the H sector would be constant with
respect to recapitalization (Figure 1–2). In the model, when 1, the Lagrange multiplier for
the capital constraint is constant at,
1
0.
Therefore, the equilibrium lending rate and the amount of credit are also constant with respect
to . Intuitively, this is because, when the bank faces undercapitalization due to the credit
costs incurred by NPL resolution, the bank would not extend new loans toward the H sector but
keep it constant under the constraint that it must keep its capital ratios at the required level.
23. During the process of NPL resolution, aggregate output is slightly decreasing
with respect to recapitalization (Figure 1–3). This result simply comes from the fact that the
bank decreases their lending to the L sector, while it does not increase their lending to the H
sector. In other words, the model implies that, in the process of NPL resolution, while the
aggregate productivity would improve due to the normalization of credit allocation, the
aggregate output would slightly decrease due to the decrease in the total amount of credit,
unless NPLs are fully resolved.
24. The NIM would increase as recapitalization proceeds (Figure 1–4). While deposit
rates are constant, the bank’s asset return is increasing due to the normalization of credit
allocation in their loan portfolio. That is, when the bank has enough capital, it improves its
profitability by moving credits from the L sector to the H sector. Since the profitability is an
important factor to attract outside investors, this result implies that recapitalization is possibly
effective to attract new equity including foreign investors.
8
There is also no NPL resolution case (i.e., x = 0) when the bank’s capital buffer is very thin. This case is, however, so
extreme that we do not consider this case hereafter.
27. VIETNAM
26 INTERNATIONAL MONETARY FUND
The Case of Full NPL Resolution ( 1, the first best)
25. In the first best case, a complete shutdown of credit to the low-productivity sector
is realized. This is because the bank fully recognizes and resolves NPLs with full bank
recapitalization and no capital scarcity. There are two subcases in the first best case. The first
subcase is that NPLs are fully resolved but the capital constraint is still binding (i.e., 1 and
0), and the second subcase is that NPLs are fully resolved and the capital constraint is slack
due to ample capital buffers (i.e., 1 and 0).
26. After completing the NPL resolution, credit to the high-productivity sector would
increase along with recapitalization (Figure 1–2). When 1 is realized, the Lagrange
multiplier becomes,
which is obviously a decreasing function of . Hence, given the fact that the equilibrium
lending rate ,
∗
is decreasing with respect to , the lending rate and credit to the H sector
would also increase along with an increase in . Intuitively, this result indicates that once the
bank completes its NPL resolution, it does not have to use capital buffers for absorbing the
credit losses incurred by NPL resolution, but can use them for extending new lending. Because
of the decline in lending rate ,
∗
, the bank’s profitability measured by NIM would decline along
with recapitalization (Figure 1–4).
27. On the back of the increase in credit, the aggregate output would increase along
with recapitalization after completing the NPL resolution (Figure 1–3). Since is slightly
decreasing with respect to when 1, the response of to becomes a V-shaped
function with respect to , which is kinked at 1 as shown in Figure 1–3. This result implies
that credit misallocation suppresses economic growth not only through lowering aggregate
productivity but also through disturbing high-productivity firms’ access to credit.
28. As the amount of recapitalization continues to increase, the capital injection
becomes ineffective for boosting output eventually. This is because the capital constraint
becomes slack due to ample capital buffers at some point. In this case, since the Lagrange
multiplier is constant at zero, all variables including lending rates, the amount of credit,
output, and profitability measures are constant with respect to . Hence, from a policy
perspective, the government has no incentive to inject more capital into the banking sector
once the capital constraint becomes slack.
28. VIETNAM
INTERNATIONAL MONETARY FUND 27
Figure 1: Policy Effects of Recapitalization
Sources: IMF staff estimates.
Government Policy on Optimal Amount of Recapitalization
29. The government’s optimal decision on the amount of recapitalization is modeled
as a political economy equilibrium. Given the equilibrium in a banking model above, the
process of policy making is formulated as a two-stage game between the government and the
bank. In this game, the government faces the following budget constraint,
,
where is the tax revenue, is the amount of recapitalization, and is other government
expenditures. Then, given the above budget constraint and the bank’s optimization in the
second stage, the government decides on the amount of recapitalization in the first stage to
maximize the following social welfare function,
where is the aggregate output, is the output in the low-productivity sector, and is the
social welfare from government expenditures, which satisfies ⋅ 0 and ⋅ 0. The
parameters and , which represent the relative importance of and in the social
29. VIETNAM
28 INTERNATIONAL MONETARY FUND
welfare, are interpreted that: (i) a high means that the government has a special interest to
support the low-productivity sector, namely SOEs, and (ii) a higher means that the
government considers other government expenditures (infrastructure, social security etc.) as
important expenses.
30. The optimal amount of recapitalization can be either of the following three cases:
(i) zero capitalization ( ), (ii) partial capitalization ( and ), and (iii) full
capitalization ( and ). The cases (i) and (iii) are characterized as corner solutions,
while the case (ii) is characterized as an inner solution in which the first order condition
⁄ 0 is satisfied. Since the government has no incentive to increase once the capital
constraint becomes slack (i.e., 0), the case (iii) corresponds the case that the government
chooses the minimum amount of which brings 0.
31. The government’s optimal choice is computed by the following sequential
procedures. First, try to compute which satisfies the following first order condition (FoC),
0.
and defines the value of as ∗
. If we cannot find satisfying the FoC because we have
⁄ 0 for all , then the government’s optimal choice has a corner solution of zero
capital injection, 0. Given the fact that ⁄ 0 and 0, this corner
solution is more likely to be chosen when the value of and/or are large. Also, if we cannot
find it because we have ⁄ 0 even when the capital constraint becomes slack (i.e., even
when the Lagrange multiplier reaches zero), then define ∗
as the minimum value of
which brings 0. The other corner solution is more likely to be chosen when we have a large
. Once we can find ∗
, then compare the level of social welfare under 0 with that
under ∗
. Define the social welfare in each case as and ∗
, respectively. Then, we have
and ∗ ∗ ∗
where and ∗
are aggregate output realized in the second stage under 0 and ∗
,
and is the low-productivity sector’s output under 0. Note that since NPLs are fully
resolved and 1 both in the full capitalization case ( 0 and in the partial capitalization
case ( 0), we have ∗
0. The government will choose the zero recapitalization, 0, if
∗ ∗ ∗
0,
and choose, ∗
, if ∗
0.
32. The political economy equilibrium suggests that the NPL resolution by public
recapitalization depends on the social welfare function. First, since we can show 0 and
∗
, the above optimality condition implies that a higher value of and makes
it difficult to realize the NPL resolution by recapitalization. In other words, NPL resolution by
public recapitalization will not take place if the government has special interests to help the
low-productivity sector, namely SOEs, (i.e., high ), or if it considers other government
30. VIETNAM
INTERNATIONAL MONETARY FUND 29
expenditures including infrastructure and social security as more important expenses than
recapitalization of the banking sector, (i.e., high ). Second, since we assume that is
concave (i.e., 0), we have ∗
/ ′ ′ ∗
0. This implies that
when the government has an ample tax revenues (i.e., when is high), then the government
tends to choose capitalization by public money.
C. Credit Misallocation and SOEs in Vietnam
33. In addition to the theoretical investigation, credit misallocation is empirically
examined by corporate data in Vietnam. The dataset is the annual data from Worldscope,
which contains all listed firms’ financial data, during 2005–2015. For regression analysis, the
following variables are defined.
dum_soe = 1 if the state share is more than 10 percent, and dum_soe = 0 otherwise.
roa = EBIT/total asset
roa_soe = dum_soe*roa
intr = interest expenses/total debt
d_debt = Year-on-year growth rate of total debt
Then, the existence of credit misallocation between SOEs and non-SOEs is empirically
examined.9
34. First, the difference in loan rates between SOEs and non-SOEs is examined. For this
purpose, we run,
β β _ controls
The control variables include , , and log of total assets. The estimation result shows
that β 0.0044 : 2.30 . Hence, it shows that SOEs obtain credit at lower rates on
average even after controlling for profitability and firm size.
35. Second, the relationship between loan rates and profitability is examined. To
examine whether loan rates are lower for SOEs at the ex-ante and/or ex-post stage, we run
β β β β _ β _ controls
The control variables include log of total assets, the growth rate of total asset, and year
dummies. Also, fixed effects for each firm are included. If SOEs obtain credit at lower rates, we
will have β 0 (ex-ante) and/or β 0 (ex-post). In addition to the estimation using a whole
9
Before the estimation exercise, the data cleaning is conducted as follows. First, I drop data for the industries of
Telecommunications, Utilities, and Financials (ICB: 6000-9000) because their financial strategy is different from others.
Second, if the sample hits at least one of the following criteria, it is removed as an outlier. (1) roa is more than 99%
tile or less than 1% tile. Then, roa is in [-0.17, 0.38], (2) intr is negative or more than 40%, (3) d_debt is more than
100%, (4) d_ta is more than 50%.
31. VIETNAM
30 INTERNATIONAL MONETARY FUND
sample, the sub-sample estimation using same specification for “good firms” (those with ROA
higher than the median) and “bad firms” (those with ROA lower than the median) are
conducted.
36. On the relationship between loan rates and profitability, it is observed that
unprofitable SOEs obtain credit at lower rates in the ex-ante stage (Table 1). While the
relationship between
loan rates and
profitability is negative
on average, this
relationship is
significantly biased to
positive (i.e., β 0) for
unprofitable SOEs (SOEs
in the bad firm sample),
which implies that
underperforming SOEs
obtain additional loans
at lower loan rates.
37. Third, the relationship between loan growth and profitability is examined. If
unprofitable SOEs obtain forbearance lending, the relationship between loan growth and
profitability, which normally has positive correlations, would be negatively biased and become
ambiguous. To examine this hypothesis, we run
_ β β β _ control
The control variables include total asset, year dummies, and fixed effects for each firm. If the
forbearance lending to SOEs is carried out, we will have β 0.
38. The estimation result for the relationship between loan growth and profitability
implies forbearance lending to SOEs. Table 2 shows that the relationship is clearly positive for
all firms on average (i.e., β 0) in the whole sample estimation as well as the subsample
Table 1. Vietnam: Loan Rates and Profitability
Source: IMF staff estimates.
Note: *, **, *** indicate that the coefficient is significant at 10 percent, 5 percent, and 1 percent level.
Dependent Variable: intert
all firms
good firms
(above median)
bad firms
(below median)
-0.064*** -0.154*** -0.111*
0.148*** 0.216*** 0.105**
0.015 0.030 0.183**
0.050 -0.043 0.069
roat-1
roat
roa_soet-1
roa_soet
Table 2. Vietnam: Debt Growth and Profitability
Source: IMF staff estimates.
Note: *, **, *** indicate that the coefficient is significant at 10 percent, 5 percent, and 1 percent level.
Dependent Variable: d_debtt
all firms
good firms
(above median)
bad firms
(below median)
0.731*** 0.693 1.768***
-0.800** -1.421* -1.252**
roat-1
roa_soet-1
32. VIETNAM
INTERNATIONAL MONETARY FUND 31
estimation, which means that profitable firms increase their debt to expand their businesses
while unprofitable ones decrease their debt to shrink their businesses. However, for SOEs
(particularly for SOEs in the bad firm sample), this relationship is biased to negative compared
with private firms (i.e., β 0), and no clear relationship between loan growth and profitability
is observed for SOEs (i.e., β β is close to zero). This implies that some SOEs obtain
forbearance lending even with their underperforming profitability.
D. Conclusion and Policy Implications
39. This paper argues that the extent of bank recapitalization is a political economy
equilibrium. The political trade-off for recapitalization reflect the extent of the government's
concern (special interest) for the favored, low-productivity sector, and the tightness of its
budget constraint. Partial or full bank recapitalization may be the selected policy response
depending on an array of factors. The first-best, consisting of fast NPL resolution and full
recapitalization, raises the quality of credit allocation and growth relative to the second-best,
partial recapitalization outcome. The first-best requires a government budget that is not too
tight (marginal cost of funds below a certain threshold), highlighting the importance of fiscal
space for financial stability. An empirical analysis supports the importance of the policy
regarding credit misallocation between SOEs and non-SOEs in Vietnam.
33. VIETNAM
32 INTERNATIONAL MONETARY FUND
References
Dollar, David and Shang-Jin Wei (2007): “Das (Wasted) Kapital: Firm Ownership and Investment
Efficiency in China,” IMF Working paper, 07/9
Cerruti, Caroline and Ruth Neyens (2016): “Public Asset Management Companies: A Toolkit,” A
Worldbank Study
Freixas, Xavier and Rochet J. C. (2008): Microeconomics of Banking, The MIT press
Hsieh, Chang-Tai, and Peter J. Klenow (2009): “Misallocation and Manufacturing TFP in China
and India,” Quarterly Journal of Economics, 124(4), 1403-1443
He, Dong (2004): “The Role of KAMCO in Resolving Nonperforming Loans in the Republic of
Korea,” IMF working paper, 04/172
International Monetary Fund (2013): Vientnam – Financial System Stability Assessment
Ingves, Stefan, Steven A. Seelig, and Dong He (2004): “Issues in the Establishment of Asset
Management Companies,” IMF policy discussion paper, 04/3
Jobst, Andreas, Anna Ilyina, Dermot Monaghan, Dmitriy Kovtun, Jose M Garrido, Kenneth H
Kang, Marina Moretti, Shekhar Aiyar, Wolfgang Bergthaler and Yan Liu (2016): “A
Strategy for Resolving Europe's Problem Loans,” IMF staff discussion notes, 15/19
Peek, Joe and Eric S. Rosengren (2005): “Unnatural Selection: Perverse Incentives and the
Misallocation of Credit in Japan,” American Economic Review, 95(4), 1144-1166
Maliszewski, Wojciech, Serkan Arslanalp, John Caparusso, José Garrido, Si Guo, Joong Shik Kang,
W. Raphael Lam, T. Daniel Law, Wei Liao, Nadia Rendak, Philippe Wingender, Jiangyan
Yu, and Longmei Zhang (2016): “Sharing China’s Bank Restructuring Bill,” IMF working
paper, 16/203
Ma, Guonan (2006): “Resolving China’s Corporate Debt Problem,” China and World Economy,
14(3), 19-37
Song, Zheng, Kjetil Storesletten, and Fabrizio Zilibotti (2011): “Growing Like China,” American
Economic Review, 101(1), 196-233