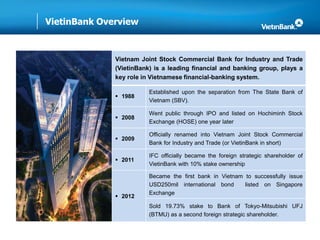
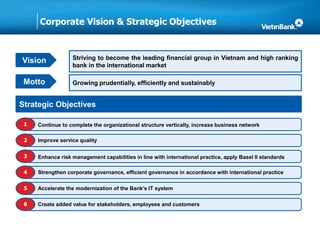
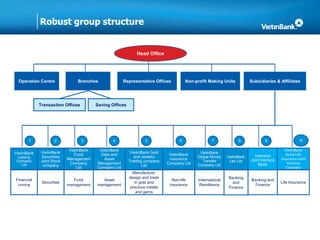
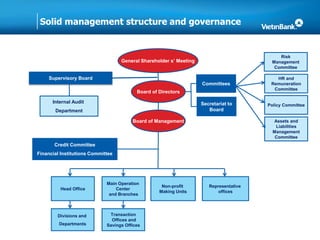
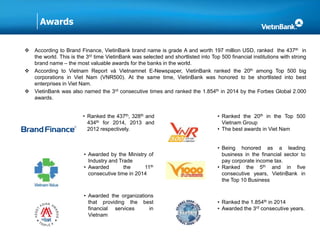
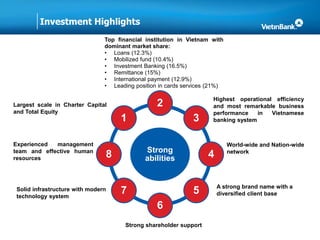
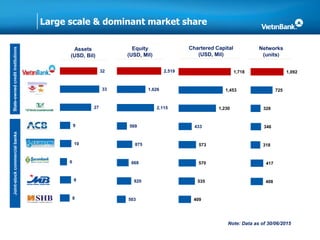
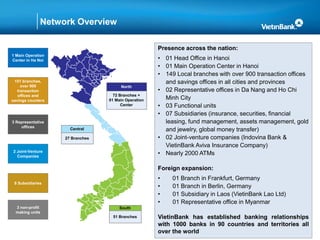
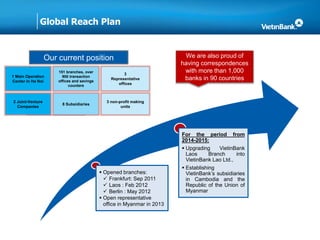
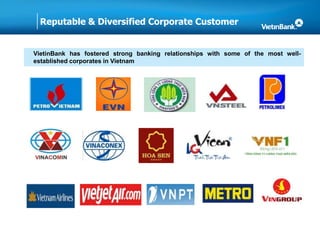
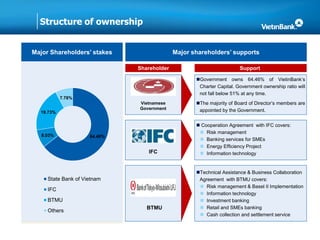
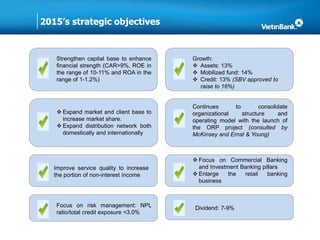
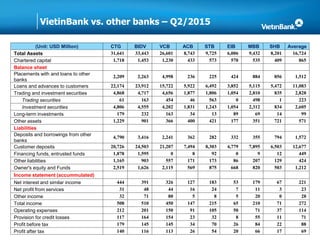
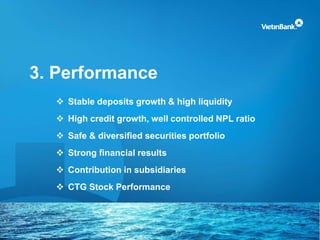
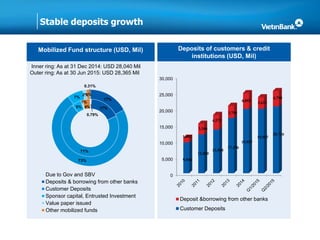
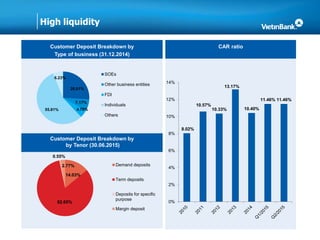
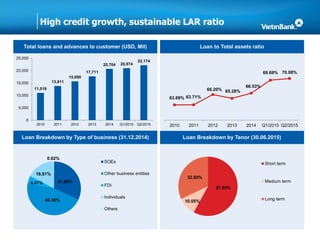
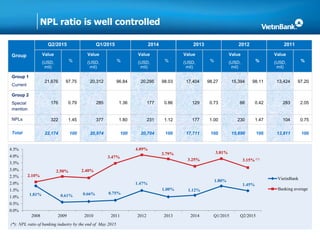
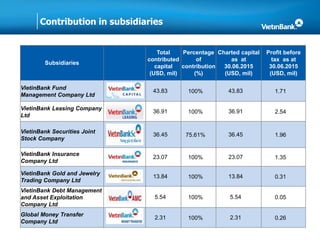
IR Presentation
Quarter II - 2015
Improving the values of life
Table of contents
1. General information
2. Investment highlights
3. Performance
1. General information
 Important Milestones
 Corporate Vision & Strategic Objectives
 Organization Structure
 Awards
VietinBank Overview
Vietnam Joint Stock Commercial Bank for Industry and Trade
(VietinBank) is a leading financial and banking group, plays a
key role in Vietnamese financial-banking system.
 1988
Established upon the separation from The State Bank of
Vietnam (SBV).
 2008
Went public through IPO and listed on Hochiminh Stock
Exchange (HOSE) one year later
 2009
Officially renamed into Vietnam Joint Stock Commercial
Bank for Industry and Trade (or VietinBank in short)
 2011
IFC officially became the foreign strategic shareholder of
VietinBank with 10% stake ownership
 2012
Became the first bank in Vietnam to successfully issue
USD250mil international bond listed on Singapore
Exchange
Sold 19.73% stake to Bank of Tokyo-Mitsubishi UFJ
(BTMU) as a second foreign strategic shareholder.
Corporate Vision & Strategic Objectives
Continue to complete the organizational structure vertically, increase business network1
Improve service quality2
Enhance risk management capabilities in line with international practice, apply Basel II standards3
Strengthen corporate governance, efficient governance in accordance with international practice4
Accelerate the modernization of the Bank’s IT system5
Create added value for stakeholders, employees and customers6
Vision Striving to become the leading financial group in Vietnam and high ranking
bank in the international market
Strategic Objectives
Motto Growing prudentially, efficiently and sustainably
Robust group structure
Head Office
Operation Centre Branches Representative Offices Non-profit Making Units Subsidiaries & Affiliates
Transaction Offices
VietinBank
Leasing
Company
Ltd
VietinBank
Securities
Joint Stock
company
VietinBank
Debt and
Asset
Management
Company Ltd
VietinBank
Insurance
Company Ltd
VietinBank
Aviva Life
Insurance Joint
Venture
Company
VietinBank
Fund
Management
Company
Ltd
Financial
Leasing
Asset
management
Non-life
insurance
Life Insurance
Fund
management
Banking and
Finance
VietinBank Gold
and Jewelry
Trading company
Ltd
Securities
Indovina
Joint Venture
Bank
Manufacture,
design and trade
in gold and
precious metals
and gems
1 2 3 4 5 6
Saving Offices
VietinBank
Global Money
Transfer
Company Ltd
International
Remittance
7 8 10
VietinBank
Lao Ltd
Banking
and
Finance
9
Solid management structure and governance
Supervisory Board
Board of Directors
Board of Management
Internal Audit
Department
Committees
Secretariat to
Board
Risk
Management
Committee
HR and
Remuneration
Committee
Policy Committee
Assets and
Liabilities
Management
Committee
Head Office
Main Operation
Center
and Branches
Non-profit
Making Units
Representative
offices
Transaction
Offices and
Savings Offices
Credit Committee
Financial Institutions Committee
Divisions and
Departments
General Shareholder s’ Meeting
Awards
 According to Brand Finance, VietinBank brand name is grade A and worth 197 million USD, ranked the 437th in
the world. This is the 3rd time VietinBank was selected and shortlisted into Top 500 financial institutions with strong
brand name – the most valuable awards for the banks in the world.
 According to Vietnam Report và Vietnamnet E-Newspaper, VietinBank ranked the 20th among Top 500 big
corporations in Viet Nam (VNR500). At the same time, VietinBank was honored to be shortlisted into best
enterprises in Viet Nam.
 VietinBank was also named the 3rd consecutive times and ranked the 1.854th in 2014 by the Forbes Global 2.000
awards.
• Ranked the 437th, 328th and
434th for 2014, 2013 and
2012 respectively.
• Ranked the 20th in the Top 500
Vietnam Group
• The best awards in Viet Nam
• Awarded by the Ministry of
Industry and Trade
• Awarded the 11th
consecutive time in 2014
• Being honored as a leading
business in the financial sector to
pay corporate income tax.
• Ranked the 5th and in five
consecutive years, VietinBank in
the Top 10 Business
• Awarded the organizations
that providing the best
financial services in
Vietnam
• Ranked the 1.854th in 2014
• Awarded the 3rd consecutive years.
2. Investment highlights
 Chartered Capital, Total Equity and Total Asset
 Market Share
 Network
 Brand name & Client base
 Shareholder support
 Corporate governance and HR
 Operating results vs. other listed banks
Strong
abilities
2
3
4
5
6
7
8
1
Top financial institution in Vietnam with
dominant market share:
• Loans (12.3%)
• Mobilized fund (10.4%)
• Investment Banking (16.5%)
• Remittance (15%)
• International payment (12.9%)
• Leading position in cards services (21%)
Highest operational efficiency
and most remarkable business
performance in Vietnamese
banking system
World-wide and Nation-wide
network
Largest scale in Charter Capital
and Total Equity
Experienced management
team and effective human
resources
A strong brand name with a
diversified client base
Strong shareholder support
Solid infrastructure with modern
technology system
Investment Highlights
Large scale & dominant market share
Assets
(USD, Bil)
Equity
(USD, Mil)
Chartered Capital
(USD, Mil)
Networks
(units)
State-ownedcreditinstitutionsJoint-stockcommercialbanks
8
9
6
10
9
27
33
32
503
820
668
875
569
2,115
1,626
2,519
409
535
570
573
433
1,230
1,453
1,718
408
417
318
346
328
725
1,092
Note: Data as of 30/06/2015
Network Overview
Presence across the nation:
• 01 Head Office in Hanoi
• 01 Main Operation Center in Hanoi
• 149 Local branches with over 900 transaction offices
and savings offices in all cities and provinces
• 02 Representative offices in Da Nang and Ho Chi
Minh City
• 03 Functional units
• 07 Subsidiaries (insurance, securities, financial
leasing, fund management, assets management, gold
and jewelry, global money transfer)
• 02 Joint-venture companies (Indovina Bank &
VietinBank Aviva Insurance Company)
• Nearly 2000 ATMs
Foreign expansion:
• 01 Branch in Frankfurt, Germany
• 01 Branch in Berlin, Germany
• 01 Subsidiary in Laos (VietinBank Lao Ltd)
• 01 Representative office in Myanmar
VietinBank has established banking relationships
with 1000 banks in 90 countries and territories all
over the world
1 Main Operation
Center in Ha Noi
151 branches,
over 900
transaction
offices and
savings counters
3 Representative
offices
2 Joint-Venture
Companies
8 Subsidiaries
3 non-profit
making units
North
72 Branches +
01 Main Operation
Center
Central
27 Branches
South
51 Branches
Global Reach Plan
1 Main Operation
Center in Ha Noi
151 branches, over
900 transaction
offices and savings
counters
3
Representative
offices
2 Joint-Venture
Companies
8 Subsidiaries
3 non-profit making
units
Our current position We are also proud of
having correspondences
with more than 1,000
banks in 90 countries
 Opened branches:
 Frankfurt: Sep 2011
 Laos : Feb 2012
 Berlin : May 2012
 Open representative
office in Myanmar in 2013
For the period from
2014-2015:
 Upgrading VietinBank
Laos Branch into
VietinBank Lao Ltd.,
 Establishing
VietinBank’s subsidiaries
in Cambodia and the
Republic of the Union of
Myanmar
Reputable & Diversified Corporate Customer
VietinBank has fostered strong banking relationships with some of the most well-
established corporates in Vietnam
Structure of ownership
Major Shareholders’ stakes
Shareholder
Vietnamese
Government
IFC
BTMU
Support
Government owns 64.46% of VietinBank’s
Charter Capital. Government ownership ratio will
not fall below 51% at any time.
The majority of Board of Director’s members are
appointed by the Government.
 Cooperation Agreement with IFC covers:
 Risk management
 Banking services for SMEs
 Energy Efficiency Project
 Information technology
Technical Assistance & Business Collaboration
Agreement with BTMU covers:
 Risk management & Basel II Implementation
 Information technology
 Investment banking
 Retail and SMEs banking
 Cash collection and settlement service
64.46%8.03%
19.73%
7.78%
State Bank of Vietnam
IFC
BTMU
Others
Major shareholders’ supports
2015’s strategic objectives
Strengthen capital base to enhance
financial strength (CAR>9%, ROE in
the range of 10-11% and ROA in the
range of 1-1.2%)
Continues to consolidate
organizational structure and
operating model with the launch of
the ORP project (consulted by
McKinsey and Ernst & Young)
Improve service quality to increase
the portion of non-interest income
 Focus on Commercial Banking
and Investment Banking pillars
 Enlarge the retail banking
business
 Expand market and client base to
increase market share.
 Expand distribution network both
domestically and internationally
Dividend: 7-9%Focus on risk management: NPL
ratio/total credit exposure <3.0%
Growth:
 Assets: 13%
 Mobilized fund: 14%
 Credit: 13% (SBV approved to
raise to 16%)
VietinBank vs. other banks – Q2/2015
(Unit: USD Million) CTG BIDV VCB ACB STB EIB MBB SHB Average
Total Assets 31,641 33,443 26,601 8,743 9,725 6,006 9,432 8,201 16,724
Chartered capital 1,718 1,453 1,230 433 573 570 535 409 865
Balance sheet
Placements with and loans to other
banks
2,209 2,263 4,998 236 225 424 884 856 1,512
Loans and advances to customers 22,174 23,912 15,722 5,922 6,492 3,852 5,115 5,472 11,083
Trading and investment securities 4,868 4,717 4,656 1,877 1,806 1,054 2,810 835 2,828
Trading securities 61 163 454 46 563 0 498 1 223
Investment securities 4,806 4,555 4,202 1,831 1,243 1,054 2,312 834 2,605
Long-term investments 179 232 163 34 13 89 69 14 99
Other assets 1,229 901 366 400 421 177 351 721 571
Liabilities
Deposits and borrowings from other
banks
4,790 3,416 2,241 362 282 332 355 794 1,572
Customer deposits 20,726 24,503 21,207 7,494 8,303 4,779 7,895 6,503 12,677
Financing funds, entrusted funds 1,878 1,595 0 8 92 0 9 12 449
Other liabilities 1,165 903 557 171 173 86 207 129 424
Owner's equity and Funds 2,519 1,626 2,115 569 875 668 820 503 1,212
Income statement (accummulated)
Net interest and similar income 444 391 326 127 183 53 179 67 221
Net profit from services 31 48 44 16 24 7 11 3 23
Other income 32 71 80 5 8 5 20 0 28
Total income 508 510 450 147 215 65 210 71 272
Operating expenses 212 201 150 91 105 50 71 37 114
Provision for credit losses 117 164 154 23 32 8 55 11 71
Profit before tax 179 145 145 34 70 26 84 22 88
Profit after tax 140 116 113 26 54 20 66 17 69
3. Performance
 Stable deposits growth & high liquidity
 High credit growth, well controlled NPL ratio
 Safe & diversified securities portfolio
 Strong financial results
 Contribution in subsidiaries
 CTG Stock Performance
Stable deposits growth
Mobilized Fund structure (USD, Mil) Deposits of customers & credit
institutions (USD, Mil)
Inner ring: As at 31 Dec 2014: USD 28,040 Mil
Outer ring: As at 30 Jun 2015: USD 28,365 Mil
0.79%
17%
71%
5%
1%
4%
0.31%
17%
73%
7%
2%1%
Due to Gov and SBV
Deposits & borrowing from other banks
Customer Deposits
Sponsor capital, Entrusted Investment
Value paper issued
Other mobilized funds
0
5,000
10,000
15,000
20,000
25,000
30,000
9,566
12,050
13,568
17,156
19,957
19,967
20,726
1,492
3,366
4,572
3,796
4,895 3,623
4,790
Deposit &borrowing from other banks
Customer Deposits
High liquidity
Customer Deposit Breakdown by
Type of business (31.12.2014)
Customer Deposit Breakdown by
by Tenor (30.06.2015)
CAR ratio
14.03%
82.65%
0.55%
2.77% Demand deposits
Term deposits
Deposits for specific
purpose
Margin deposit
8.02%
10.57%
10.33%
13.17%
10.40%
11.46% 11.46%
0%
2%
4%
6%
8%
10%
12%
14%
26.01%
7.17%
4.78%55.81%
6.23%
SOEs
Other business entities
FDI
Individuals
Others
High credit growth, sustainable LAR ratio
Total loans and advances to customer (USD, Mil)
Loan Breakdown by Type of business (31.12.2014)
Loan to Total assets ratio
Loan Breakdown by Tenor (30.06.2015)
11,018
13,811
15,690
17,711
20,704 20,974
22,174
0
5,000
10,000
15,000
20,000
25,000
2010 2011 2012 2013 2014 Q1/2015 Q2/2015
63.69%
63.71%
66.20%
65.28%
66.53%
69.69% 70.08%
2010 2011 2012 2013 2014 1Q2015 2Q2015
57.95%
10.05%
32.00%
Short term
Medium term
Long term
31.86%
46.30%
4.41%
16.81%
0.62%
SOEs
Other business entities
FDI
Individuals
Others
63.69% 63.71%
66.20% 65.28%
66.53%
69.69% 70.08%
2010 2011 2012 2013 2014 Q1/2015 Q2/2015
NPL ratio is well controlled
Group
Q2/2015 Q1/2015 2014 2013 2012 2011
Value
(USD,
mil)
%
Value
(USD,
mil)
%
Value
(USD,
mil)
%
Value
(USD,
mil)
%
Value
(USD,
mil)
%
Value
(USD,
mil)
%
Group 1
Current
21,676 97.75 20,312 96.84 20,295 98.03 17,404 98.27 15,394 98.11 13,424 97.20
Group 2
Special
mention
176 0.79 285 1.36 177 0.86 129 0.73 66 0.42 283 2.05
NPLs 322 1.45 377 1.80 231 1.12 177 1.00 230 1.47 104 0.75
Total 22,174 100 20,974 100 20,704 100 17,711 100 15,690 100 13,811 100
1.81% 0.61% 0.66% 0.75%
1.47%
1.00% 1.12%
1.80%
1.45%
2.10%
2.50% 2.40%
3.47%
4.09%
3.79%
3.25%
3.81%
3.15% (*)
0.0%
0.5%
1.0%
1.5%
2.0%
2.5%
3.0%
3.5%
4.0%
4.5%
2008 2009 2010 2011 2012 2013 2014 Q1/2015 Q2/2015
VietinBank
Banking average
(*): NPL ratio of banking industry by the end of May 2015
• VietinBank has a robust credit systems, clearly defining relevant
exposure limits and credit risk appetite
• Such systems are enhanced by a strong credit culture, benefiting
from well-defined delegations of authority and reporting lines
Robust Credit Systems
• Loans and advances are relatively well allocated according to
business entities & industry sectors, ensuring a high degree of
diversification of potential risks
• The credit policy has put in place strict exposure credit limits
Well Defined Sectoral,
Single Party and Group
Exposure Credit Limits
• Comprehensive and detailed loan classification and provisioning
requirements and policies are in place, in consistent with regulatory
norms and guidelines
• Existence of robust procedures have resulted in positive
developments in non-performing asset measures in recent times
Comprehensive Loan
Classification and
Provisioning Requirements
• Strong Credit risk management system is in place which has
ensured improvement in the asset quality in this growing economic
environment
Strong Credit Risk
Management System
Asset Quality Management
Safe & diversified securities portfolio
Components of Investment portfolioInvestment portfolio
(USD, Mil)
5,420
6,433
6,332
7,539
8,327
7,108
7,303
31.1%
29.7%
26.7% 27.8%
26.8%
23.6%
24.5%
0
1,000
2,000
3,000
4,000
5,000
6,000
7,000
8,000
9,000
0%
5%
10%
15%
20%
25%
30%
35%
Total investment Investment to total asset ratio
43%
55%
0.06%
2%
30%
67%
0.11%
2%
Interbank Debt securities
Equity securities Long-term investments
Inner ring: As at 31 Dec 2014
Outer ring: As at 30 Jun 2015
Strong financial results
Profit results (USD, Mil)
Financial ratios
Operating Income Breakdown
Cost to income ratio
361
625
590
559
527
143
296
164
296 295
273
270
58
140
0
100
200
300
400
500
600
700
2010 2011 2012 2013 2014 Q1/2015 Q2/2015
Profit before provisions for credit losses Profit after tax
1.5%
2.0%
1.7%
1.4%
1.2%
1.0%
1.2%
22.1%
26.7%
19.9%
13.7%
10.5% 9.0% 11.1%
0%
5%
10%
15%
20%
25%
30%
0%
1%
1%
2%
2%
3%
2010 2011 2012 2013 2014 Q1/2015 Q2/2015
ROA ROE
82% 90% 84% 84% 84% 89% 87%
10%
5%
6% 7% 7%
5% 6%
9% 5% 10% 9% 9% 6% 6%
0%
20%
40%
60%
80%
100%
2010 2011 2012 2013 2014 Q1/2015 Q2/2015
Other operating income Fees and commission income
Net interest income
48.57%
40.57%
42.96%
45.49%
46.72%
41.50% 41.68%
36%
38%
40%
42%
44%
46%
48%
50%
2010 2011 2012 2013 2014 Q1/2015 Q2/2015
Contribution in subsidiaries
Subsidiaries
Total
contributed
capital
(USD, mil)
Percentage
of
contribution
(%)
Charted capital
as at
30.06.2015
(USD, mil)
Profit before
tax as at
30.06.2015
(USD, mil)
VietinBank Fund
Management Company Ltd
43.83 100% 43.83 1.71
VietinBank Leasing Company
Ltd
36.91 100% 36.91 2.54
VietinBank Securities Joint
Stock Company
36.45 75.61% 36.45 1.96
VietinBank Insurance
Company Ltd
23.07 100% 23.07 1.35
VietinBank Gold and Jewelry
Trading Company Ltd
13.84 100% 13.84 0.31
VietinBank Debt Management
and Asset Exploitation
Company Ltd
5.54 100% 5.54 0.05
Global Money Transfer
Company Ltd
2.31 100% 2.31 0.26
CTG Stock Performance – 1H2015
Value
The closing price on
05th Jan 2015
13,900 VND/share
The closing price on
30th June 2015
19,200 VND/share
The highest prices in
1H2015
13,900 - 21,200 VND/share
Volume 279,451,620 shares
Trading value 5,455 Billion VND
The trading volume
of foreign investors
Net purchase 31,898,820 share
Foreign owned
1,101,488,251 cp
(29.58%)
Current room of
foreign investors
15,533,116 cp
(0.42%)
EPS 1,630 VND/share
P/E (30th June 2015) 11.78x
BVPS 19,200 VND/share
P/B (30th June 2015) 1.42x
80%
100%
120%
140%
160%
180%
200%
05/01/201526/01/201524/02/201517/03/201507/4/2015 04/5/2015 25/5/201515/06/2015
Growth of VN-Index and Bank Stock -1H2015
CTG VCB BID MBB
STB ACB VNIndex
0
1,000
2,000
3,000
4,000
5,000
6,000
7,000
0
5
10
15
20
25
Thousandsdong
CTG Stock Performance – 1H2015
Volumn (Thousands of share) CTG price
Website for investors
http://investor.vietinbank.vn
For further information, please contact:
Investor Relations - Board of Director Secretariats
VietinBank
Address: 108 Tran Hung Dao street, Hanoi, Vietnam.
Email: investor@vietinbank.vn
Tel: 84-4-3 941 3622
Thank you!
Disclaimer :
This presentation is prepared by using financial reports and other reliable sources with the aims to provide
information only. Readers should use this presentation as a reference source. The information might be
updated from time to time and we have no responsibility to notify about that change.

Vietin bank ir presentation q2.2015

  • 1.
    IR Presentation Quarter II- 2015 Improving the values of life
  • 2.
    Table of contents 1.General information 2. Investment highlights 3. Performance
  • 3.
    1. General information Important Milestones  Corporate Vision & Strategic Objectives  Organization Structure  Awards
  • 4.
    VietinBank Overview Vietnam JointStock Commercial Bank for Industry and Trade (VietinBank) is a leading financial and banking group, plays a key role in Vietnamese financial-banking system.  1988 Established upon the separation from The State Bank of Vietnam (SBV).  2008 Went public through IPO and listed on Hochiminh Stock Exchange (HOSE) one year later  2009 Officially renamed into Vietnam Joint Stock Commercial Bank for Industry and Trade (or VietinBank in short)  2011 IFC officially became the foreign strategic shareholder of VietinBank with 10% stake ownership  2012 Became the first bank in Vietnam to successfully issue USD250mil international bond listed on Singapore Exchange Sold 19.73% stake to Bank of Tokyo-Mitsubishi UFJ (BTMU) as a second foreign strategic shareholder.
  • 5.
    Corporate Vision &Strategic Objectives Continue to complete the organizational structure vertically, increase business network1 Improve service quality2 Enhance risk management capabilities in line with international practice, apply Basel II standards3 Strengthen corporate governance, efficient governance in accordance with international practice4 Accelerate the modernization of the Bank’s IT system5 Create added value for stakeholders, employees and customers6 Vision Striving to become the leading financial group in Vietnam and high ranking bank in the international market Strategic Objectives Motto Growing prudentially, efficiently and sustainably
  • 6.
    Robust group structure HeadOffice Operation Centre Branches Representative Offices Non-profit Making Units Subsidiaries & Affiliates Transaction Offices VietinBank Leasing Company Ltd VietinBank Securities Joint Stock company VietinBank Debt and Asset Management Company Ltd VietinBank Insurance Company Ltd VietinBank Aviva Life Insurance Joint Venture Company VietinBank Fund Management Company Ltd Financial Leasing Asset management Non-life insurance Life Insurance Fund management Banking and Finance VietinBank Gold and Jewelry Trading company Ltd Securities Indovina Joint Venture Bank Manufacture, design and trade in gold and precious metals and gems 1 2 3 4 5 6 Saving Offices VietinBank Global Money Transfer Company Ltd International Remittance 7 8 10 VietinBank Lao Ltd Banking and Finance 9
  • 7.
    Solid management structureand governance Supervisory Board Board of Directors Board of Management Internal Audit Department Committees Secretariat to Board Risk Management Committee HR and Remuneration Committee Policy Committee Assets and Liabilities Management Committee Head Office Main Operation Center and Branches Non-profit Making Units Representative offices Transaction Offices and Savings Offices Credit Committee Financial Institutions Committee Divisions and Departments General Shareholder s’ Meeting
  • 8.
    Awards  According toBrand Finance, VietinBank brand name is grade A and worth 197 million USD, ranked the 437th in the world. This is the 3rd time VietinBank was selected and shortlisted into Top 500 financial institutions with strong brand name – the most valuable awards for the banks in the world.  According to Vietnam Report và Vietnamnet E-Newspaper, VietinBank ranked the 20th among Top 500 big corporations in Viet Nam (VNR500). At the same time, VietinBank was honored to be shortlisted into best enterprises in Viet Nam.  VietinBank was also named the 3rd consecutive times and ranked the 1.854th in 2014 by the Forbes Global 2.000 awards. • Ranked the 437th, 328th and 434th for 2014, 2013 and 2012 respectively. • Ranked the 20th in the Top 500 Vietnam Group • The best awards in Viet Nam • Awarded by the Ministry of Industry and Trade • Awarded the 11th consecutive time in 2014 • Being honored as a leading business in the financial sector to pay corporate income tax. • Ranked the 5th and in five consecutive years, VietinBank in the Top 10 Business • Awarded the organizations that providing the best financial services in Vietnam • Ranked the 1.854th in 2014 • Awarded the 3rd consecutive years.
  • 9.
    2. Investment highlights Chartered Capital, Total Equity and Total Asset  Market Share  Network  Brand name & Client base  Shareholder support  Corporate governance and HR  Operating results vs. other listed banks
  • 10.
    Strong abilities 2 3 4 5 6 7 8 1 Top financial institutionin Vietnam with dominant market share: • Loans (12.3%) • Mobilized fund (10.4%) • Investment Banking (16.5%) • Remittance (15%) • International payment (12.9%) • Leading position in cards services (21%) Highest operational efficiency and most remarkable business performance in Vietnamese banking system World-wide and Nation-wide network Largest scale in Charter Capital and Total Equity Experienced management team and effective human resources A strong brand name with a diversified client base Strong shareholder support Solid infrastructure with modern technology system Investment Highlights
  • 11.
    Large scale &dominant market share Assets (USD, Bil) Equity (USD, Mil) Chartered Capital (USD, Mil) Networks (units) State-ownedcreditinstitutionsJoint-stockcommercialbanks 8 9 6 10 9 27 33 32 503 820 668 875 569 2,115 1,626 2,519 409 535 570 573 433 1,230 1,453 1,718 408 417 318 346 328 725 1,092 Note: Data as of 30/06/2015
  • 12.
    Network Overview Presence acrossthe nation: • 01 Head Office in Hanoi • 01 Main Operation Center in Hanoi • 149 Local branches with over 900 transaction offices and savings offices in all cities and provinces • 02 Representative offices in Da Nang and Ho Chi Minh City • 03 Functional units • 07 Subsidiaries (insurance, securities, financial leasing, fund management, assets management, gold and jewelry, global money transfer) • 02 Joint-venture companies (Indovina Bank & VietinBank Aviva Insurance Company) • Nearly 2000 ATMs Foreign expansion: • 01 Branch in Frankfurt, Germany • 01 Branch in Berlin, Germany • 01 Subsidiary in Laos (VietinBank Lao Ltd) • 01 Representative office in Myanmar VietinBank has established banking relationships with 1000 banks in 90 countries and territories all over the world 1 Main Operation Center in Ha Noi 151 branches, over 900 transaction offices and savings counters 3 Representative offices 2 Joint-Venture Companies 8 Subsidiaries 3 non-profit making units North 72 Branches + 01 Main Operation Center Central 27 Branches South 51 Branches
  • 13.
    Global Reach Plan 1Main Operation Center in Ha Noi 151 branches, over 900 transaction offices and savings counters 3 Representative offices 2 Joint-Venture Companies 8 Subsidiaries 3 non-profit making units Our current position We are also proud of having correspondences with more than 1,000 banks in 90 countries  Opened branches:  Frankfurt: Sep 2011  Laos : Feb 2012  Berlin : May 2012  Open representative office in Myanmar in 2013 For the period from 2014-2015:  Upgrading VietinBank Laos Branch into VietinBank Lao Ltd.,  Establishing VietinBank’s subsidiaries in Cambodia and the Republic of the Union of Myanmar
  • 14.
    Reputable & DiversifiedCorporate Customer VietinBank has fostered strong banking relationships with some of the most well- established corporates in Vietnam
  • 15.
    Structure of ownership MajorShareholders’ stakes Shareholder Vietnamese Government IFC BTMU Support Government owns 64.46% of VietinBank’s Charter Capital. Government ownership ratio will not fall below 51% at any time. The majority of Board of Director’s members are appointed by the Government.  Cooperation Agreement with IFC covers:  Risk management  Banking services for SMEs  Energy Efficiency Project  Information technology Technical Assistance & Business Collaboration Agreement with BTMU covers:  Risk management & Basel II Implementation  Information technology  Investment banking  Retail and SMEs banking  Cash collection and settlement service 64.46%8.03% 19.73% 7.78% State Bank of Vietnam IFC BTMU Others Major shareholders’ supports
  • 16.
    2015’s strategic objectives Strengthencapital base to enhance financial strength (CAR>9%, ROE in the range of 10-11% and ROA in the range of 1-1.2%) Continues to consolidate organizational structure and operating model with the launch of the ORP project (consulted by McKinsey and Ernst & Young) Improve service quality to increase the portion of non-interest income  Focus on Commercial Banking and Investment Banking pillars  Enlarge the retail banking business  Expand market and client base to increase market share.  Expand distribution network both domestically and internationally Dividend: 7-9%Focus on risk management: NPL ratio/total credit exposure <3.0% Growth:  Assets: 13%  Mobilized fund: 14%  Credit: 13% (SBV approved to raise to 16%)
  • 17.
    VietinBank vs. otherbanks – Q2/2015 (Unit: USD Million) CTG BIDV VCB ACB STB EIB MBB SHB Average Total Assets 31,641 33,443 26,601 8,743 9,725 6,006 9,432 8,201 16,724 Chartered capital 1,718 1,453 1,230 433 573 570 535 409 865 Balance sheet Placements with and loans to other banks 2,209 2,263 4,998 236 225 424 884 856 1,512 Loans and advances to customers 22,174 23,912 15,722 5,922 6,492 3,852 5,115 5,472 11,083 Trading and investment securities 4,868 4,717 4,656 1,877 1,806 1,054 2,810 835 2,828 Trading securities 61 163 454 46 563 0 498 1 223 Investment securities 4,806 4,555 4,202 1,831 1,243 1,054 2,312 834 2,605 Long-term investments 179 232 163 34 13 89 69 14 99 Other assets 1,229 901 366 400 421 177 351 721 571 Liabilities Deposits and borrowings from other banks 4,790 3,416 2,241 362 282 332 355 794 1,572 Customer deposits 20,726 24,503 21,207 7,494 8,303 4,779 7,895 6,503 12,677 Financing funds, entrusted funds 1,878 1,595 0 8 92 0 9 12 449 Other liabilities 1,165 903 557 171 173 86 207 129 424 Owner's equity and Funds 2,519 1,626 2,115 569 875 668 820 503 1,212 Income statement (accummulated) Net interest and similar income 444 391 326 127 183 53 179 67 221 Net profit from services 31 48 44 16 24 7 11 3 23 Other income 32 71 80 5 8 5 20 0 28 Total income 508 510 450 147 215 65 210 71 272 Operating expenses 212 201 150 91 105 50 71 37 114 Provision for credit losses 117 164 154 23 32 8 55 11 71 Profit before tax 179 145 145 34 70 26 84 22 88 Profit after tax 140 116 113 26 54 20 66 17 69
  • 18.
    3. Performance  Stabledeposits growth & high liquidity  High credit growth, well controlled NPL ratio  Safe & diversified securities portfolio  Strong financial results  Contribution in subsidiaries  CTG Stock Performance
  • 19.
    Stable deposits growth MobilizedFund structure (USD, Mil) Deposits of customers & credit institutions (USD, Mil) Inner ring: As at 31 Dec 2014: USD 28,040 Mil Outer ring: As at 30 Jun 2015: USD 28,365 Mil 0.79% 17% 71% 5% 1% 4% 0.31% 17% 73% 7% 2%1% Due to Gov and SBV Deposits & borrowing from other banks Customer Deposits Sponsor capital, Entrusted Investment Value paper issued Other mobilized funds 0 5,000 10,000 15,000 20,000 25,000 30,000 9,566 12,050 13,568 17,156 19,957 19,967 20,726 1,492 3,366 4,572 3,796 4,895 3,623 4,790 Deposit &borrowing from other banks Customer Deposits
  • 20.
    High liquidity Customer DepositBreakdown by Type of business (31.12.2014) Customer Deposit Breakdown by by Tenor (30.06.2015) CAR ratio 14.03% 82.65% 0.55% 2.77% Demand deposits Term deposits Deposits for specific purpose Margin deposit 8.02% 10.57% 10.33% 13.17% 10.40% 11.46% 11.46% 0% 2% 4% 6% 8% 10% 12% 14% 26.01% 7.17% 4.78%55.81% 6.23% SOEs Other business entities FDI Individuals Others
  • 21.
    High credit growth,sustainable LAR ratio Total loans and advances to customer (USD, Mil) Loan Breakdown by Type of business (31.12.2014) Loan to Total assets ratio Loan Breakdown by Tenor (30.06.2015) 11,018 13,811 15,690 17,711 20,704 20,974 22,174 0 5,000 10,000 15,000 20,000 25,000 2010 2011 2012 2013 2014 Q1/2015 Q2/2015 63.69% 63.71% 66.20% 65.28% 66.53% 69.69% 70.08% 2010 2011 2012 2013 2014 1Q2015 2Q2015 57.95% 10.05% 32.00% Short term Medium term Long term 31.86% 46.30% 4.41% 16.81% 0.62% SOEs Other business entities FDI Individuals Others 63.69% 63.71% 66.20% 65.28% 66.53% 69.69% 70.08% 2010 2011 2012 2013 2014 Q1/2015 Q2/2015
  • 22.
    NPL ratio iswell controlled Group Q2/2015 Q1/2015 2014 2013 2012 2011 Value (USD, mil) % Value (USD, mil) % Value (USD, mil) % Value (USD, mil) % Value (USD, mil) % Value (USD, mil) % Group 1 Current 21,676 97.75 20,312 96.84 20,295 98.03 17,404 98.27 15,394 98.11 13,424 97.20 Group 2 Special mention 176 0.79 285 1.36 177 0.86 129 0.73 66 0.42 283 2.05 NPLs 322 1.45 377 1.80 231 1.12 177 1.00 230 1.47 104 0.75 Total 22,174 100 20,974 100 20,704 100 17,711 100 15,690 100 13,811 100 1.81% 0.61% 0.66% 0.75% 1.47% 1.00% 1.12% 1.80% 1.45% 2.10% 2.50% 2.40% 3.47% 4.09% 3.79% 3.25% 3.81% 3.15% (*) 0.0% 0.5% 1.0% 1.5% 2.0% 2.5% 3.0% 3.5% 4.0% 4.5% 2008 2009 2010 2011 2012 2013 2014 Q1/2015 Q2/2015 VietinBank Banking average (*): NPL ratio of banking industry by the end of May 2015
  • 23.
    • VietinBank hasa robust credit systems, clearly defining relevant exposure limits and credit risk appetite • Such systems are enhanced by a strong credit culture, benefiting from well-defined delegations of authority and reporting lines Robust Credit Systems • Loans and advances are relatively well allocated according to business entities & industry sectors, ensuring a high degree of diversification of potential risks • The credit policy has put in place strict exposure credit limits Well Defined Sectoral, Single Party and Group Exposure Credit Limits • Comprehensive and detailed loan classification and provisioning requirements and policies are in place, in consistent with regulatory norms and guidelines • Existence of robust procedures have resulted in positive developments in non-performing asset measures in recent times Comprehensive Loan Classification and Provisioning Requirements • Strong Credit risk management system is in place which has ensured improvement in the asset quality in this growing economic environment Strong Credit Risk Management System Asset Quality Management
  • 24.
    Safe & diversifiedsecurities portfolio Components of Investment portfolioInvestment portfolio (USD, Mil) 5,420 6,433 6,332 7,539 8,327 7,108 7,303 31.1% 29.7% 26.7% 27.8% 26.8% 23.6% 24.5% 0 1,000 2,000 3,000 4,000 5,000 6,000 7,000 8,000 9,000 0% 5% 10% 15% 20% 25% 30% 35% Total investment Investment to total asset ratio 43% 55% 0.06% 2% 30% 67% 0.11% 2% Interbank Debt securities Equity securities Long-term investments Inner ring: As at 31 Dec 2014 Outer ring: As at 30 Jun 2015
  • 25.
    Strong financial results Profitresults (USD, Mil) Financial ratios Operating Income Breakdown Cost to income ratio 361 625 590 559 527 143 296 164 296 295 273 270 58 140 0 100 200 300 400 500 600 700 2010 2011 2012 2013 2014 Q1/2015 Q2/2015 Profit before provisions for credit losses Profit after tax 1.5% 2.0% 1.7% 1.4% 1.2% 1.0% 1.2% 22.1% 26.7% 19.9% 13.7% 10.5% 9.0% 11.1% 0% 5% 10% 15% 20% 25% 30% 0% 1% 1% 2% 2% 3% 2010 2011 2012 2013 2014 Q1/2015 Q2/2015 ROA ROE 82% 90% 84% 84% 84% 89% 87% 10% 5% 6% 7% 7% 5% 6% 9% 5% 10% 9% 9% 6% 6% 0% 20% 40% 60% 80% 100% 2010 2011 2012 2013 2014 Q1/2015 Q2/2015 Other operating income Fees and commission income Net interest income 48.57% 40.57% 42.96% 45.49% 46.72% 41.50% 41.68% 36% 38% 40% 42% 44% 46% 48% 50% 2010 2011 2012 2013 2014 Q1/2015 Q2/2015
  • 26.
    Contribution in subsidiaries Subsidiaries Total contributed capital (USD,mil) Percentage of contribution (%) Charted capital as at 30.06.2015 (USD, mil) Profit before tax as at 30.06.2015 (USD, mil) VietinBank Fund Management Company Ltd 43.83 100% 43.83 1.71 VietinBank Leasing Company Ltd 36.91 100% 36.91 2.54 VietinBank Securities Joint Stock Company 36.45 75.61% 36.45 1.96 VietinBank Insurance Company Ltd 23.07 100% 23.07 1.35 VietinBank Gold and Jewelry Trading Company Ltd 13.84 100% 13.84 0.31 VietinBank Debt Management and Asset Exploitation Company Ltd 5.54 100% 5.54 0.05 Global Money Transfer Company Ltd 2.31 100% 2.31 0.26
  • 27.
    CTG Stock Performance– 1H2015 Value The closing price on 05th Jan 2015 13,900 VND/share The closing price on 30th June 2015 19,200 VND/share The highest prices in 1H2015 13,900 - 21,200 VND/share Volume 279,451,620 shares Trading value 5,455 Billion VND The trading volume of foreign investors Net purchase 31,898,820 share Foreign owned 1,101,488,251 cp (29.58%) Current room of foreign investors 15,533,116 cp (0.42%) EPS 1,630 VND/share P/E (30th June 2015) 11.78x BVPS 19,200 VND/share P/B (30th June 2015) 1.42x 80% 100% 120% 140% 160% 180% 200% 05/01/201526/01/201524/02/201517/03/201507/4/2015 04/5/2015 25/5/201515/06/2015 Growth of VN-Index and Bank Stock -1H2015 CTG VCB BID MBB STB ACB VNIndex 0 1,000 2,000 3,000 4,000 5,000 6,000 7,000 0 5 10 15 20 25 Thousandsdong CTG Stock Performance – 1H2015 Volumn (Thousands of share) CTG price
  • 28.
    Website for investors http://investor.vietinbank.vn Forfurther information, please contact: Investor Relations - Board of Director Secretariats VietinBank Address: 108 Tran Hung Dao street, Hanoi, Vietnam. Email: investor@vietinbank.vn Tel: 84-4-3 941 3622
  • 29.
    Thank you! Disclaimer : Thispresentation is prepared by using financial reports and other reliable sources with the aims to provide information only. Readers should use this presentation as a reference source. The information might be updated from time to time and we have no responsibility to notify about that change.