The document provides an overview of VietinBank's performance in Q3 2017. Some key points:
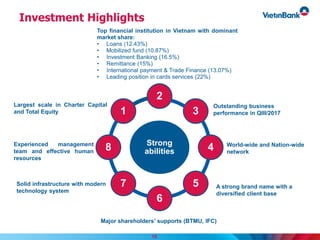
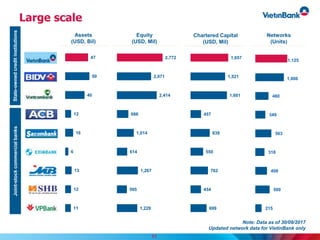
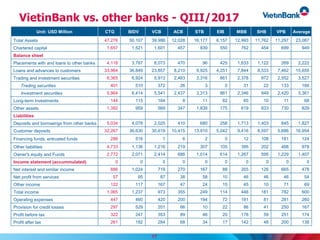
- VietinBank is Vietnam's leading bank with the largest assets and market share across key business lines.
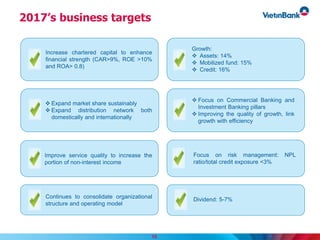
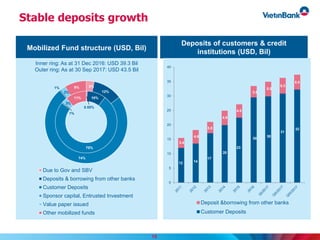
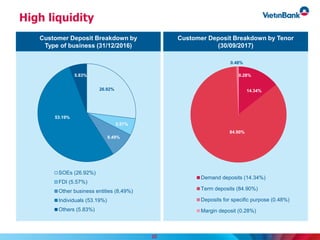
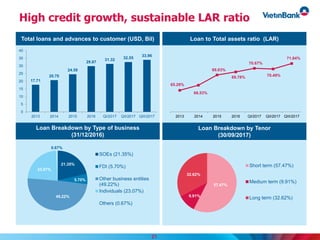
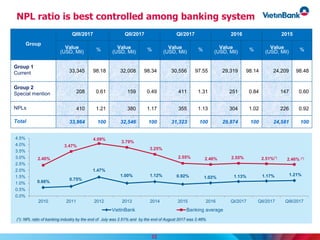
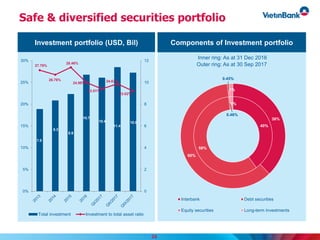
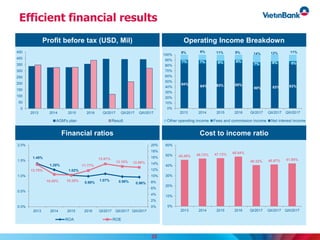
- In Q3 2017, VietinBank saw stable deposit growth, high but well-controlled credit growth, a safe and diversified securities portfolio, and efficient financial results.
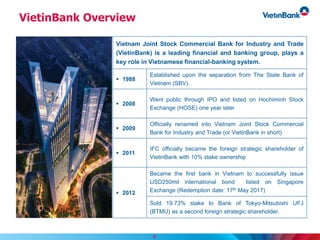
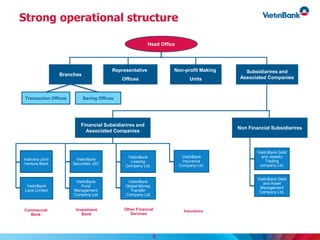
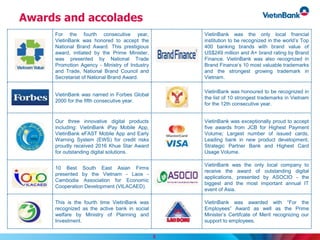
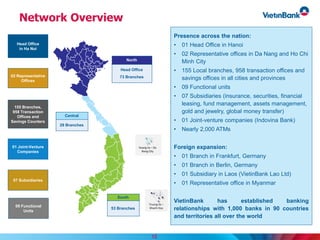
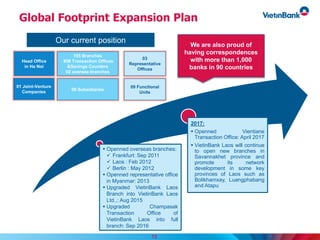
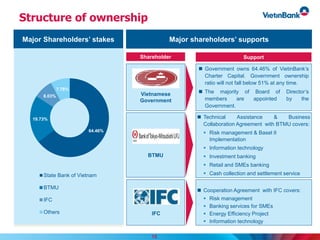
- VietinBank maintains a strong domestic network while expanding internationally, and receives support from major shareholders like BTMU and IFC.