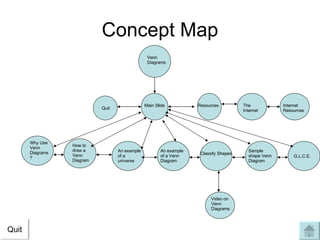
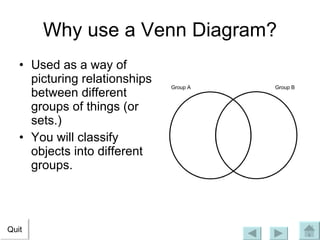
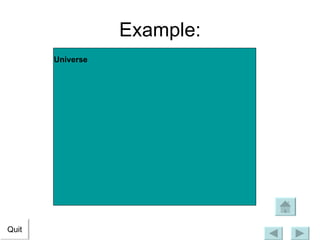
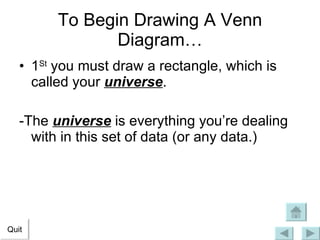
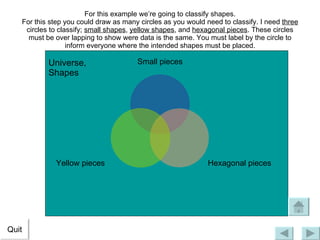
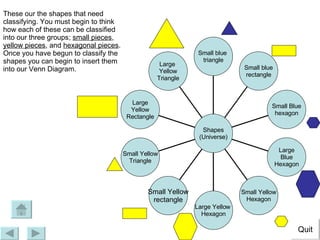
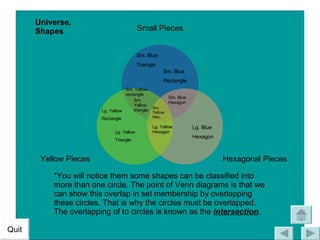
Venn diagrams can be used to show relationships between different groups or sets of objects. They involve drawing overlapping circles to represent the sets, with the overlapping sections indicating items that are members of both sets. The document provides an example using shapes to demonstrate how to draw a Venn diagram, classify the shapes into different groups (small, yellow, hexagonal), and place them in the appropriate sections of the diagram based on their attributes. Instructions and an example are given for how to set up and complete a Venn diagram, along with the intended learning goals around classifying 2D shapes.
![About Me My name is Allyson Green. I’m a junior at Grand Valley State University. I hope one day to be making impact on children, as my teachers impacted me. If you need to contact me, you can e-mail me at [email_address] Quit](https://image.slidesharecdn.com/venn-diagram-project-1225683225766606-9/85/Venn-Diagram-Project-12-320.jpg)