1. Microaggression Mediating the Effect of Ethnic Identity on Two Types of Civic Engagement
Van L. Phan & Wing Yi Chan, PhD.
Department of Psychology, Georgia State University
Introduction
Ethnic identity is associated with community
service among first-generation college students;
however, studies have been inconclusive regarding
the extent to which ethnic identity is correlated
with other types of civic engagement, such as
political participation (Jensen, 2008).
Ethnic identity refers to one’s sense of
belonging to his/her ethnic group of heritage
(Stuart & Jose, 2014).
It is important to consider different types of
civic engagement because they provide
different avenues to solving social problems.
The purpose of this study was to examine whether
microaggression mediates the effect of ethnic
identity on both types of civic engagement.
Microaggression is a subtle and sometimes
unintentional form of racial discrimination
(Nadal et al., 2014).
Hypothesis: We hypothesized that racial/ethnic
minorities who strongly identify with their ethnic
group would be more aware of microaggression
and, as a result, would be more likely to engage in
civic engagement.
Methods (cont.) Discussion
Measures
Ethnic Identity. The Multi-Group Ethnic Identity Measure (Phinney, 1992).
Microaggression. The Racial and Ethnic Microaggressions Scale (Nadal et al., 2011).
Community Service. The community service subscale of the Active & Engaged Citizenship
(Zaff et al., 1988).
Political Participation. Did you vote in the 2013 mayoral election?
Data Analysis
We first tested the zero-order correlations among all study variables. Then, a hierarchical linear
regression was used with community service as the dependent variable. A binary logistic
regression was used with political participation as the dependent variable. In both regression
models, ethnic identity was entered into the first block and microaggression was entered into the
second block.
Results
First study to examine the relationship between
ethnic identity and two types of civic engagement
mediated by microaggression for first-generation
college students.
Consistent with previous research, we found that
ethnic identity is positively associated with
community service. Microaggression was also a
significant predictor, but it did not mediate the
relationship between ethnic identity and community
service.
Neither ethnic identity nor microaggression were
associated with political participation. Lack of
significance may be due to a small number of
participants (n=12) who voted in the mayoral
election.
Future Directions
Future research should examine why the predictors
are only related to community service, but not
political participation.
It is possible that racial/ethnic minorities feel a
stronger attachment to their immediate community
which encourages involvement in such community
instead of the larger society.
Acculturation may play a role in political
participation among racial/ethnic minorities.
Individuals who are more acculturated to the host
culture (i.e., the U.S) are more likely to participate in
the larger political system because they feel a greater
sense of attachment and perhaps more invested in the
success of the larger political system.
Acknowledgements
Thank you to all of the members of the Youth
Engaged 4 Solutions (YES!) Lab and all of the
study participants.
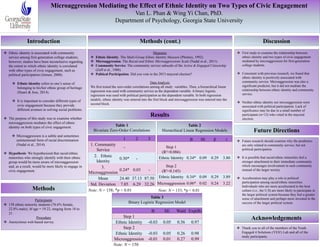
1 2 3
1. Community
Service
-
2. Ethnic
Identity
0.30* -
3.
Microaggression
0.24* 0.03 -
Mean 24.40 37.13 87.50
Std. Deviation 7.85 6.29 32.26
Note: N = 158; *p < 0.01
B SE Wald Exp(B)
Step 1
Ethnic Identity -0.03 0.05 0.56 0.97
Step 2
Ethnic Identity -0.03 0.05 0.26 0.98
Microaggression -0.01 0.01 0.27 0.99
Note: N = 158
Table 1
Bivariate Zero-Order Correlations
Methods
Participants
158 ethnic minority students (76.6% female,
22.8% male); M age = 19.22, ranging from 18 to
21.
Procedure
Anonymous web-based survey.
Table 2
Hierarchical Linear Regression Models
B SE β t
Step 1
(R²=0.086)
Ethnic Identity 0.34* 0.09 0.29 3.80
Step 2
(R²=0.145)
Ethnic Identity 0.34* 0.09 0.29 3.89
Microaggression 0.06* 0.02 0.24 3.22
Note: N = 133; *p < 0.01
Table 3
Binary Logistic Regression Model