Downloaded 14 times
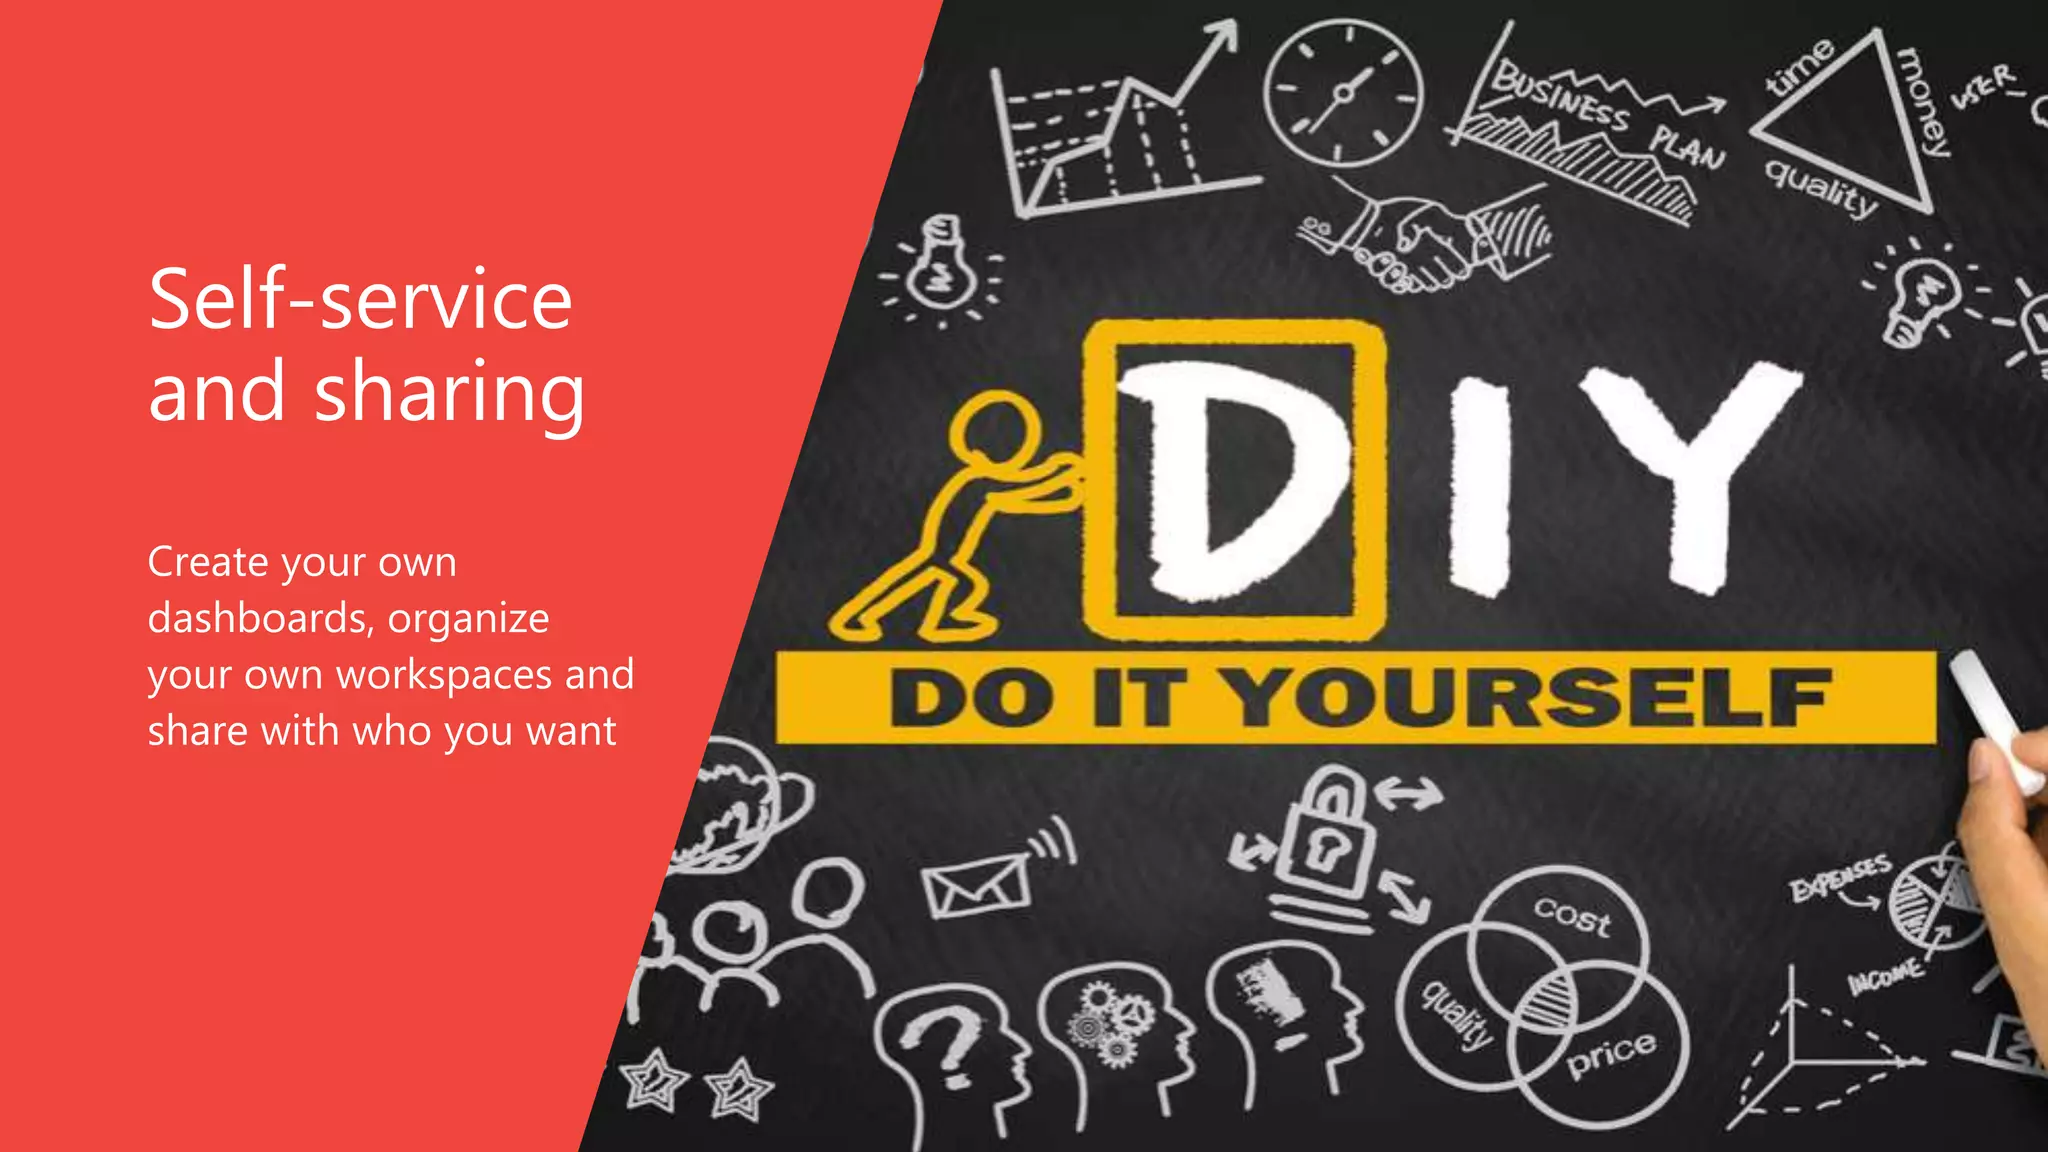
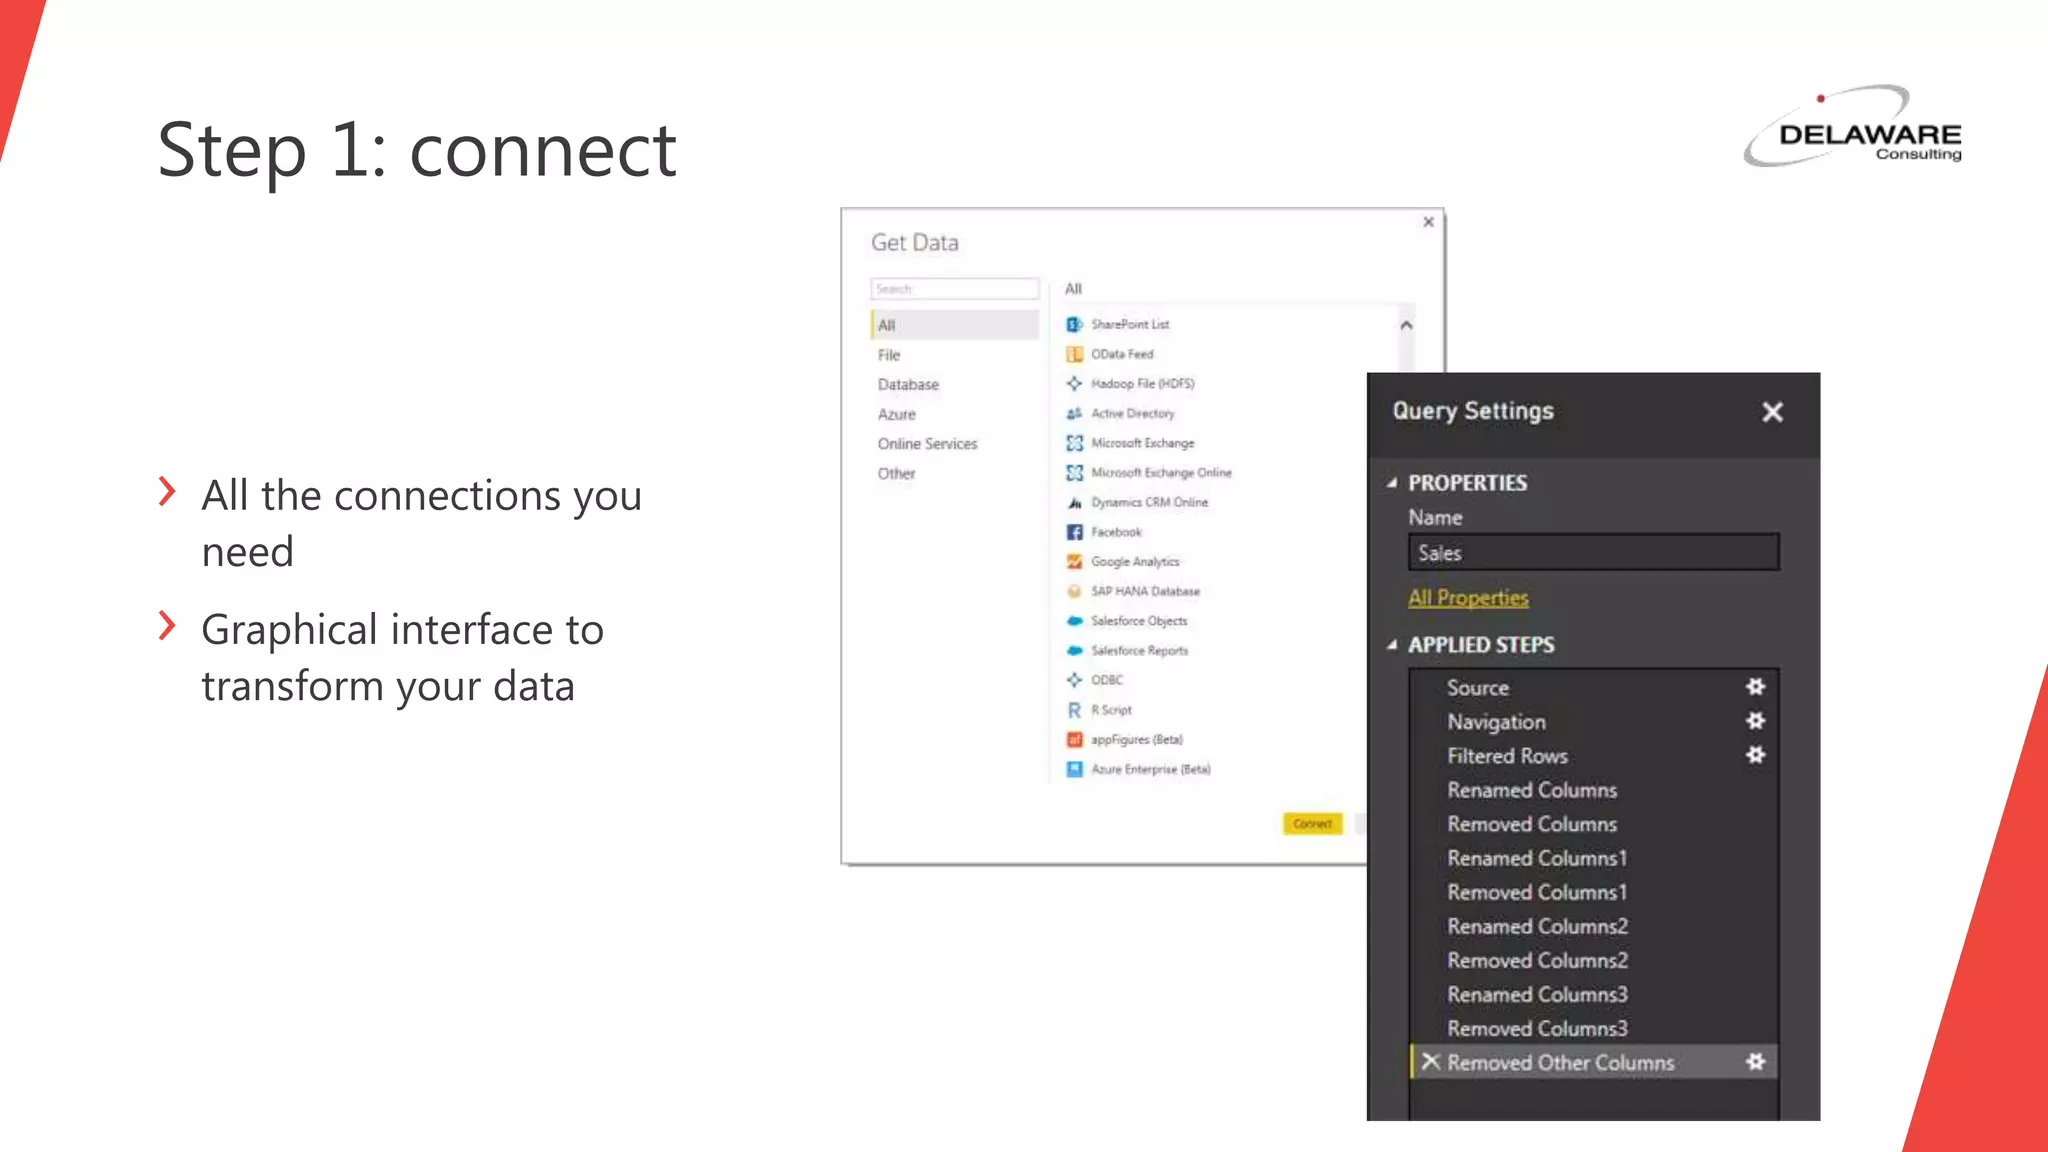
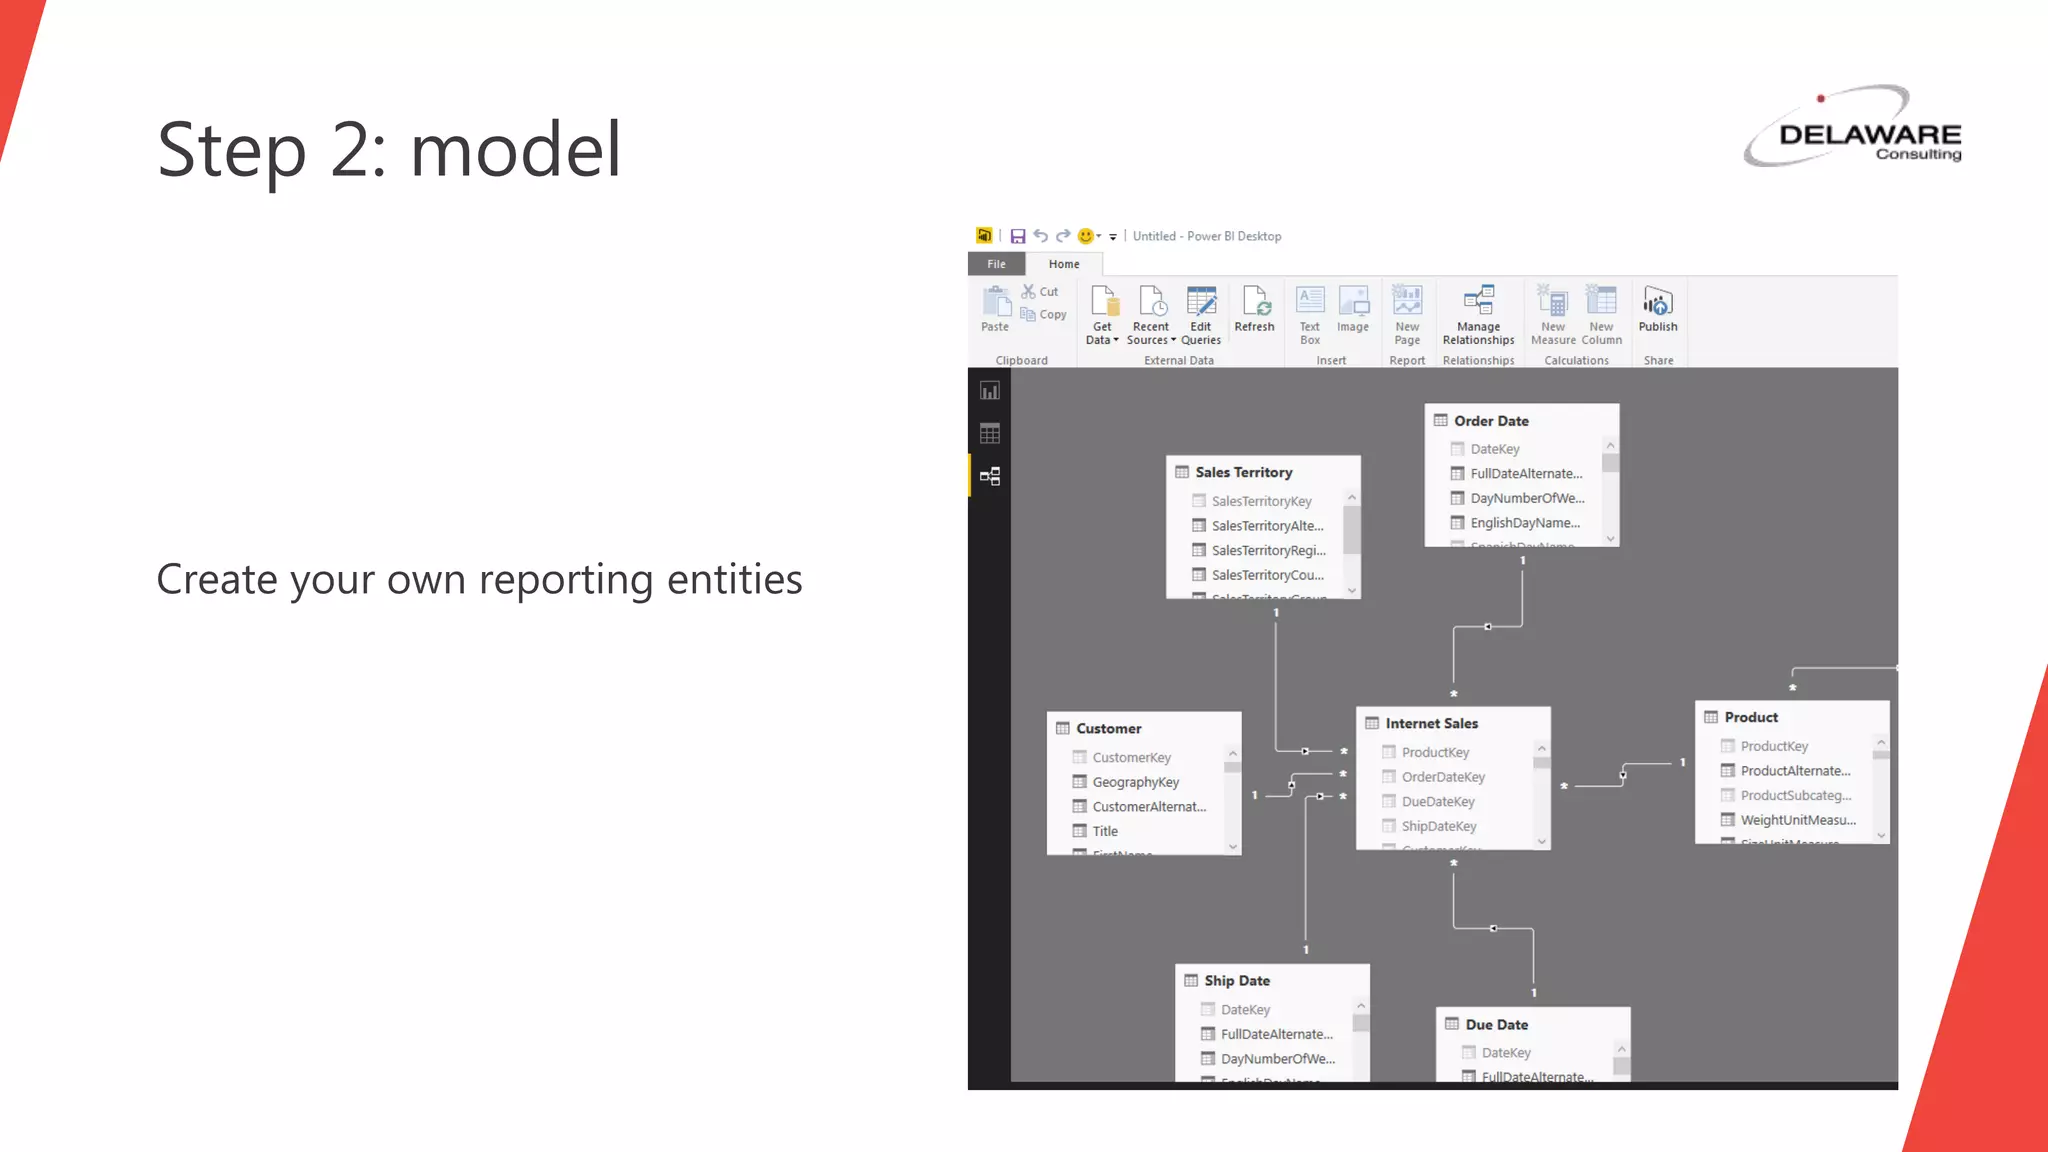
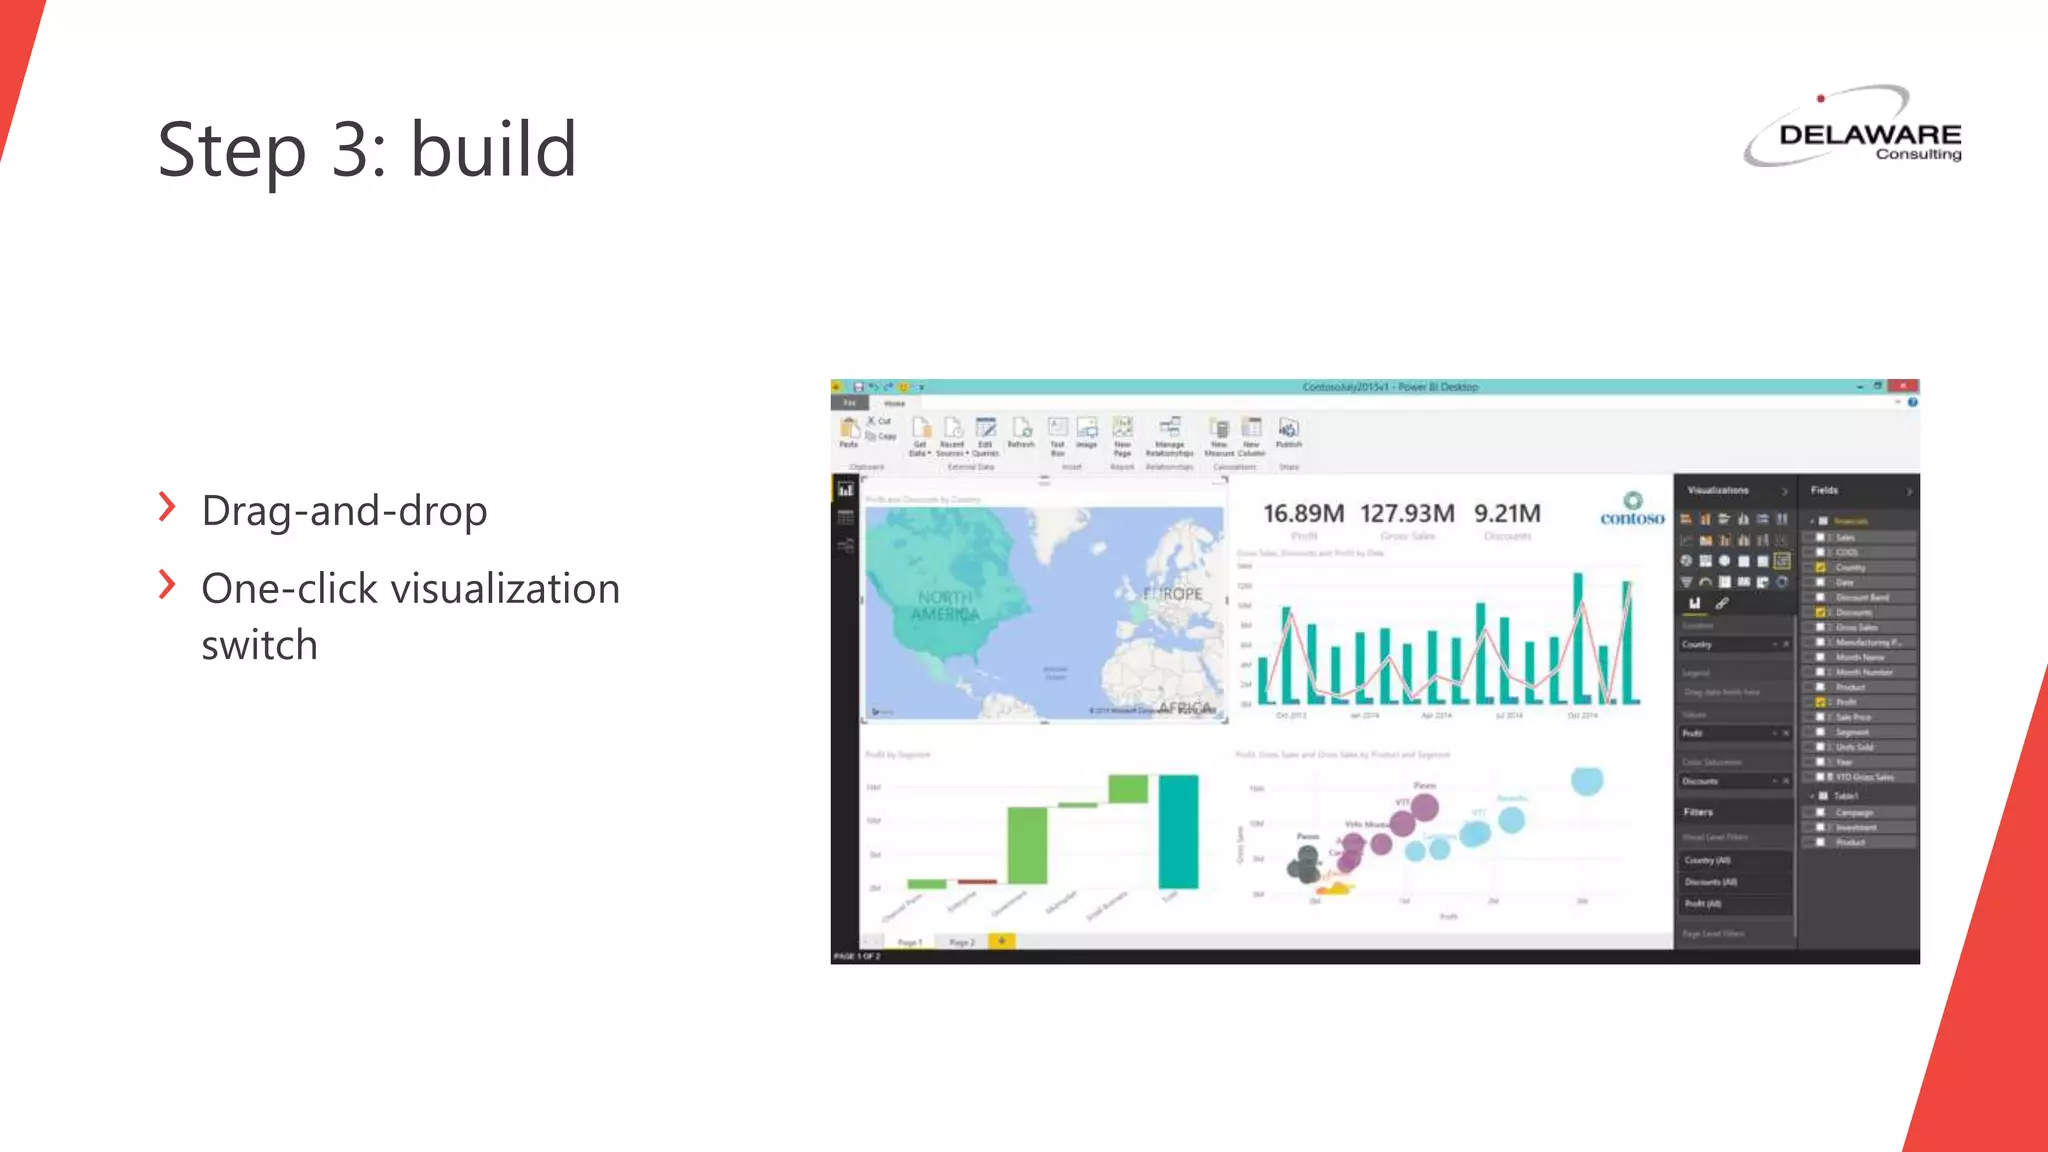
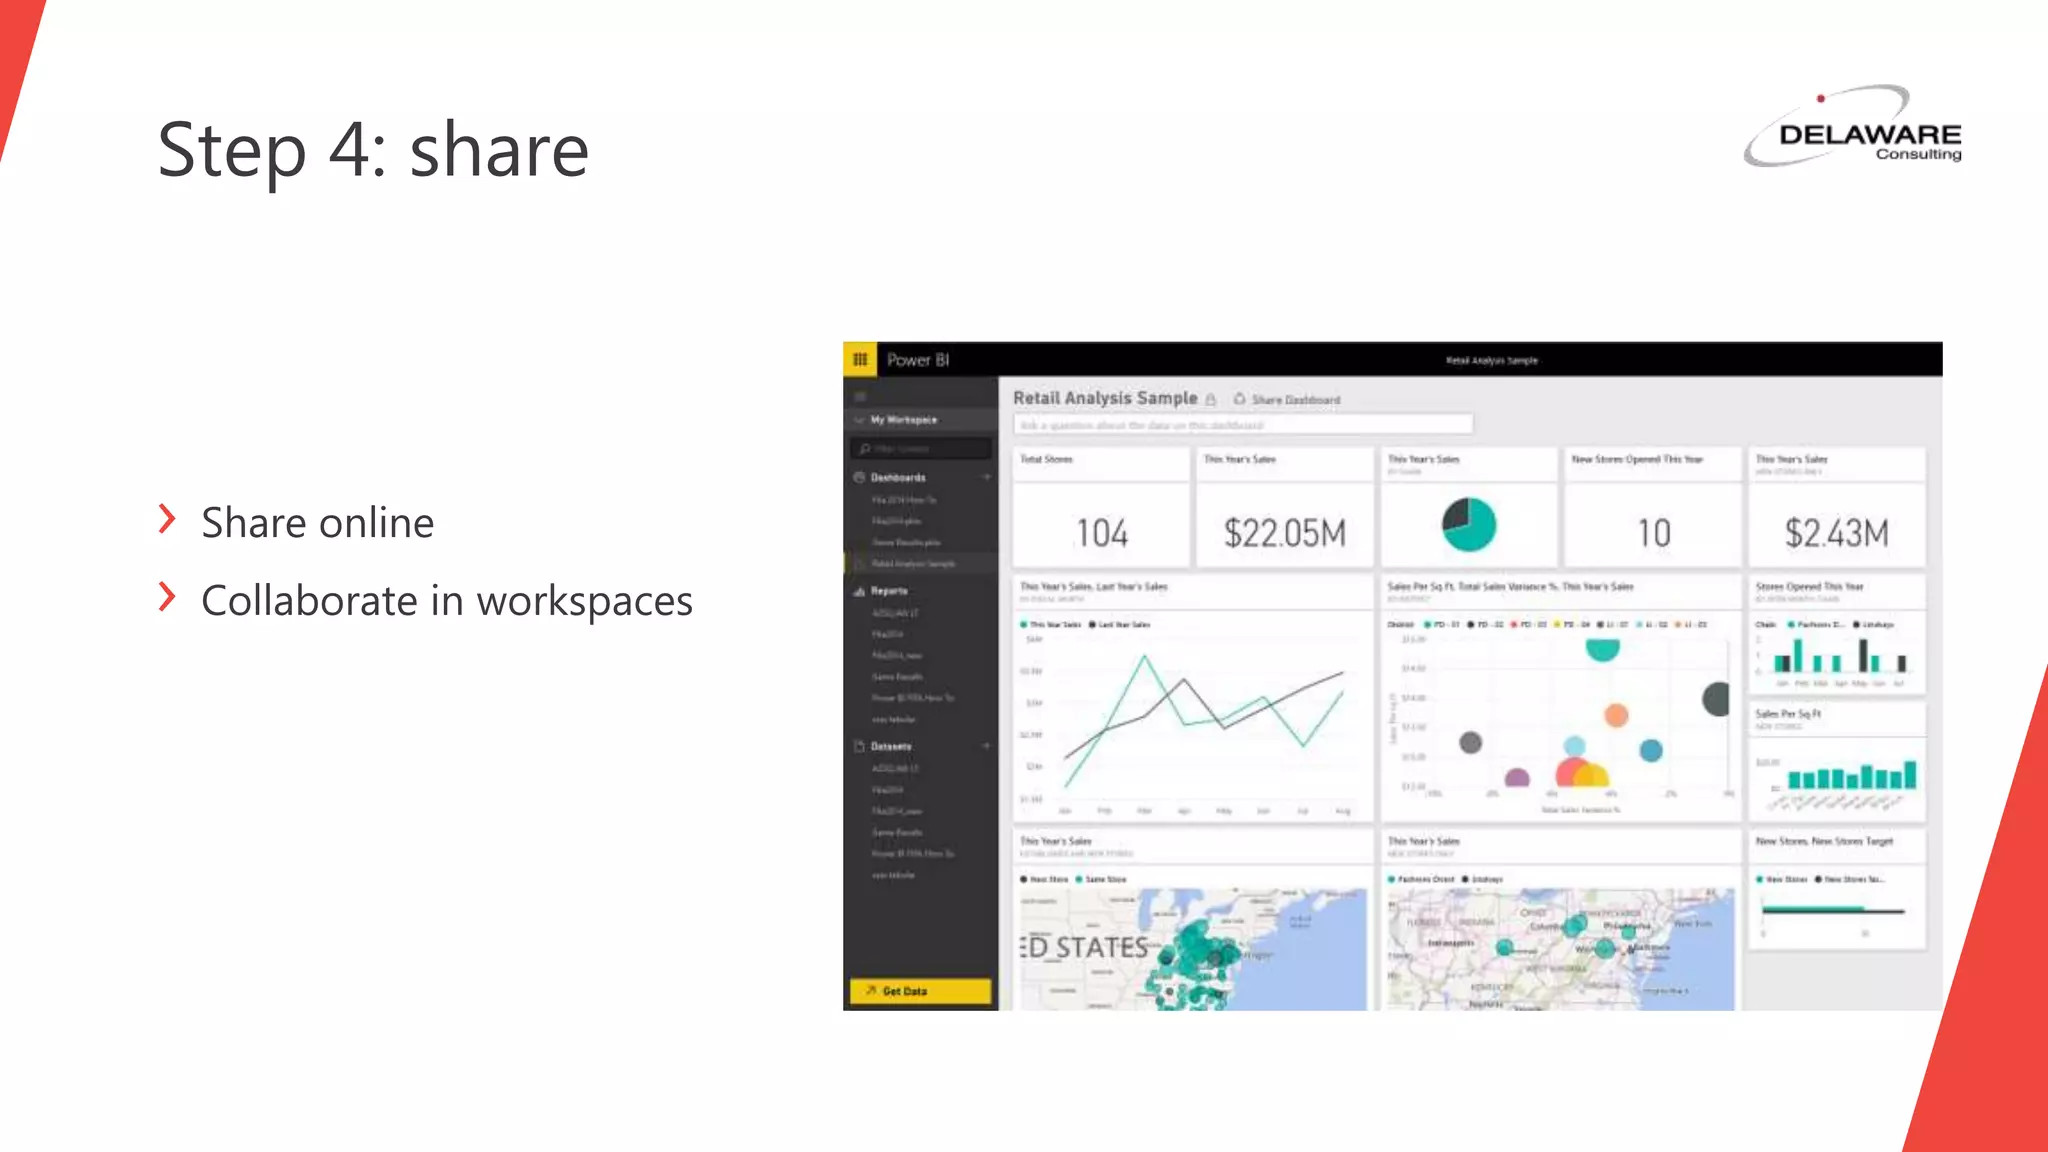
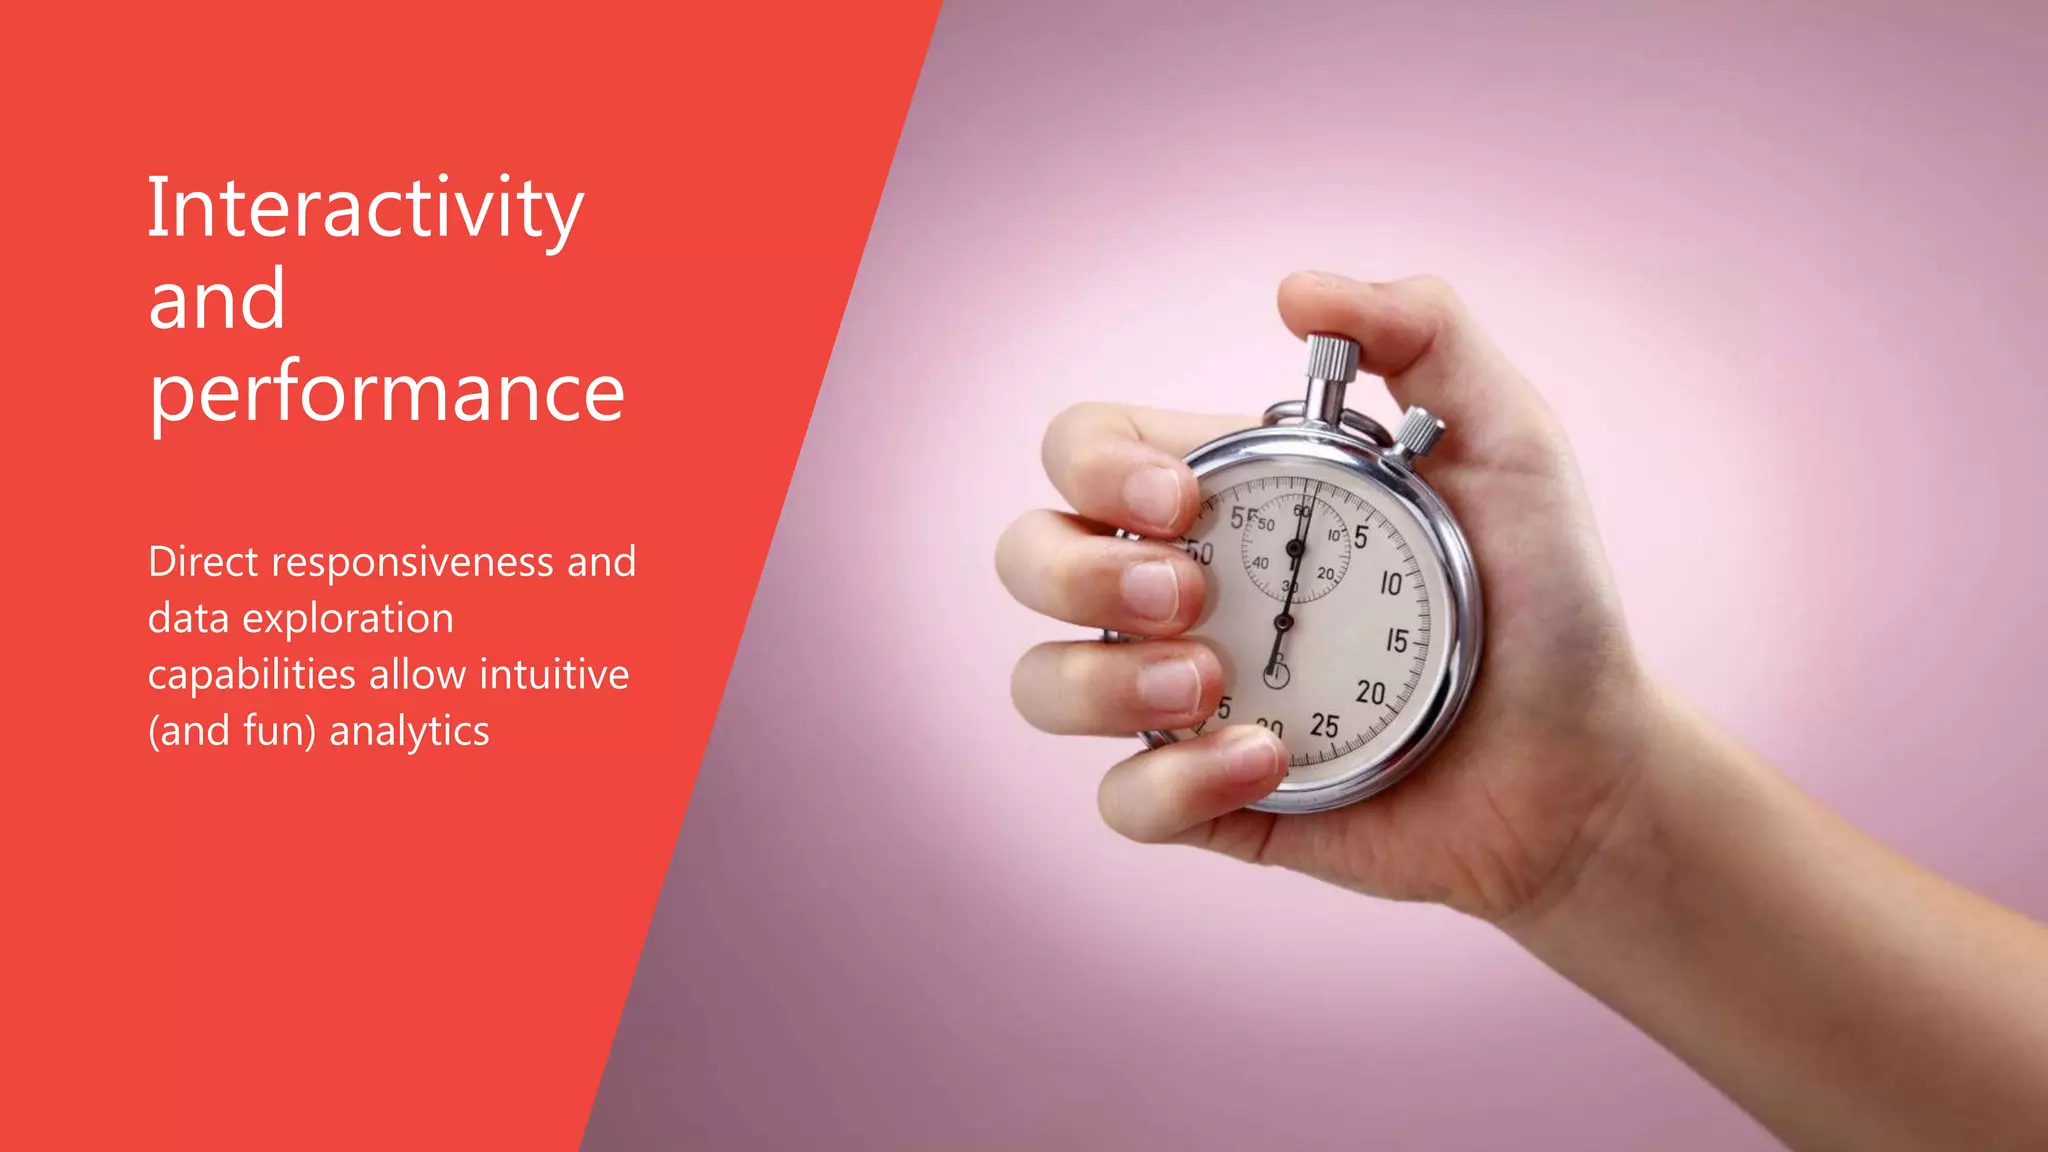

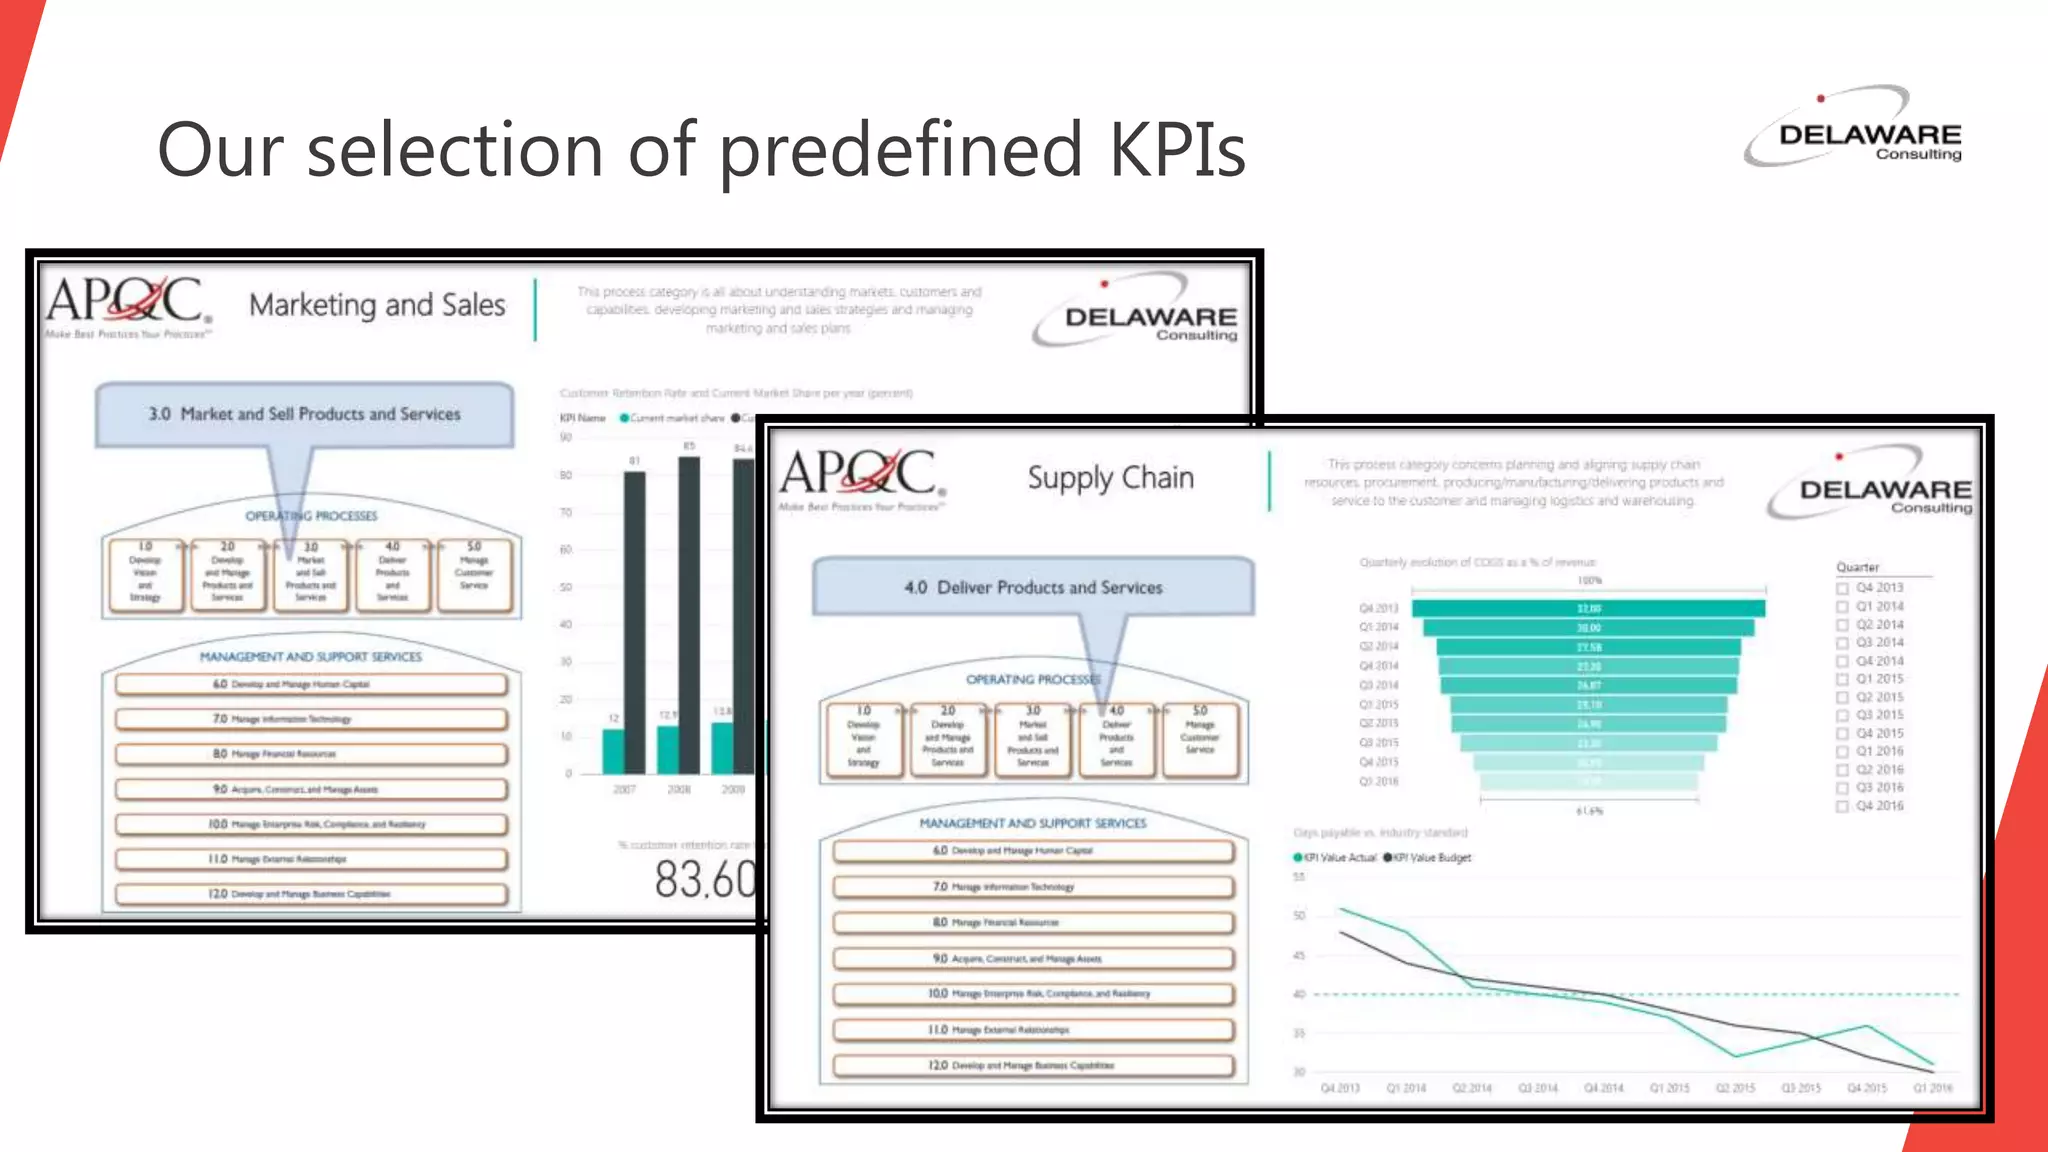
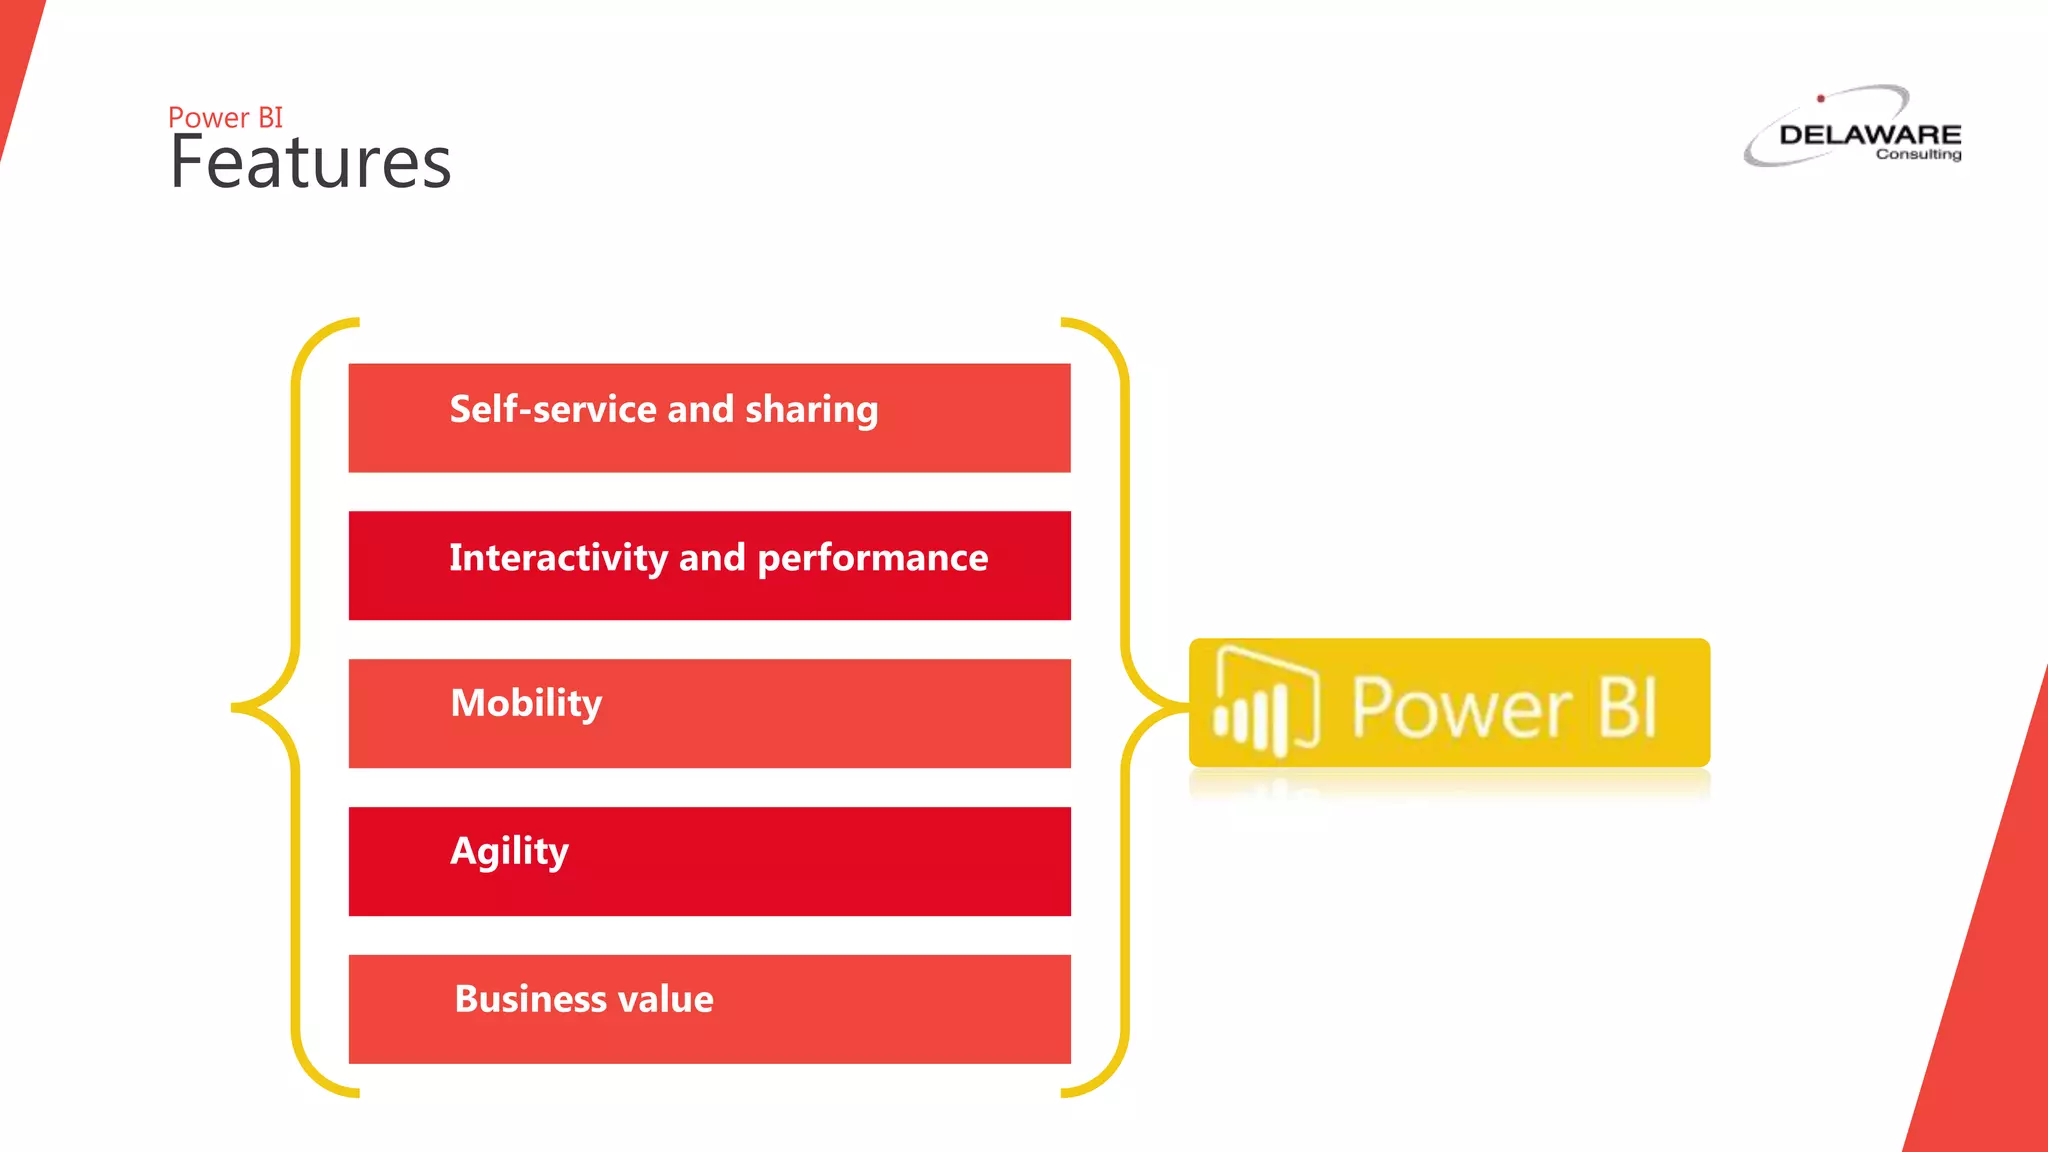

The document outlines the use of data visualizations for enhanced insights through a self-service platform allowing users to create dashboards, model data, and collaborate in workspaces. It describes a step-by-step process involving connecting data, modeling reporting entities, building visualizations, and sharing insights. The emphasis is on interactivity, performance, and the business value offered through predefined KPIs and Microsoft technology.


![Vibe Coding vs. Spec-Driven Development [Free Meetup]](https://cdn.slidesharecdn.com/ss_thumbnails/vibecodingvsspecdrivendevelopment-251209105622-43f455e7-thumbnail.jpg?width=640&height=640&fit=bounds)


